The Water Footprint Assessment of Agriculture in Banjar River Watershed
J Himanshu Rao1
*
 , Mahesh Kumar Hardaha1
and Hardikkumar Mansukhbhai Vora1
, Mahesh Kumar Hardaha1
and Hardikkumar Mansukhbhai Vora1
http://dx.doi.org/10.12944/CWE.14.3.15
Copy the following to cite this article:
Rao J. H, Hardaha M. K, Vora H. M, The Water Footprint Assessment of Agriculture in Banjar River Watershed. Curr World Environ 2019; 14(3). DOI:http://dx.doi.org/10.12944/CWE.14.3.15
Copy the following to cite this URL:
Rao J. H, Hardaha M. K, Vora H. M, The Water Footprint Assessment of Agriculture in Banjar River Watershed. Curr World Environ 2019; 14(3). Available from: https://bit.ly/2Qu7CLn
Download article (pdf) Citation Manager Publish History

Introduction
Water is an essential natural resource for human survival. It is one of the most crucial physical entity responsible for survival of human beings on earth. Water is principally used for drinking purposes and for providing sanitation. The other uses of water includes its involvement in agriculture, livestock rearing and management, domestic supplies and industrial operations. The water is greatly endangered by human activities.1,2,3,4
Freshwater scarcity is a major concern.5,6 Increasing populations, socioeconomic growths, worldwide freshwater withdrawal, drying rivers and high population levels are all signs of rising water scarcity.7,8,9,10 Water scarcity has been aggregating in more and more countries all over the world.11 Agriculture is the major consumer of freshwater with 85% of global surface and ground water consumption.12,13
To manage the global concern of freshwater scarcity, water footprint (WF) has emerged as an interactive tool for exploring the water use among the policy makers to encourage effective, justifiable and sustainable water use. The concept of WF, was initially introduced by Hoekstra14 and consequently elaborated by Hoekstra and Chapagain.15 WF is a consumption or pollution based indicator of water use allocated for producing a product, commodity or a service. Knowledge of how allocated surface and groundwater resources are consumed over the production process is highly valuable for effective planning, management and sustenance of water resources by policy makers.16,17
The WF of a product refers to the amount of water required for producing the product over the complete production chain. WF assessment is an analytical tool that can describe the relationship between human activities and water scarcity, and offers an innovative approach to integrated water resources management.18 The WF is further classified into three components, based on the consumption or degradation of freshwater use.18 The first and second components are the WFgreen and WFblue whereas the third component is the WF grey.
The green WF (WFgreen) refers to the consumption of rainwater, and blue WF (WFblue) denotes the consumption of surface or groundwater required for producing the product. The degradative component of WF i.e. grey WF (WFgrey), measures the volume of water requisite to integrate the load of pollutants flowing towards freshwater bodies based on the acceptable and ambient water quality standards.
Former WF studies primarily concentrated on six distinct areas: product, sector, river basin, administrative boundary, country and global level. At the product level, Van Oel and Hoekstra19 quantified the WF of paper products and Chapagain and Hoekstra20 quantified it for tea and coffee consumption in the Netherlands. Mekonnen and Hoekstra21 made a global assessment of WF of farm animal products.
At a river basin, Miguel et al.,22 evaluated the WF of agriculture sector in Duero river basin, Dumont et al.,23 analyzed the WF of Guadalquivir river basin with special focus on groundwater and Zeng et al., 24 assessed it for Heihe river basin. D’Ambrosio et al.,25 assessed the sustainability in water use for Canale d’Aiedda Basin using water footprint as an indicator, Martínez-Paz et al.,26 evaluated the water footprint of irrigated agriculture sector of Segura river basin through simulation of anthropised water cycle combining a hydrological model and a decision support system. At provincial level Zhao et al.,27 estimated the regional water footprint of Leshan city in China. At country level, Kampman,28 Ahmed and Ribbe,29 Ge et al.,30 Arabi et al.,31 quantified the WF of India, rainfed and irrigated areas of Sudan, China and Iran. Chapagain and Hoekstra32 quantified the water footprint of rice at global level from production and consumption perspectives.
Using a 5 × 5 arc minute grid, Mekonnen and Hoekstra33 quantified the WFgreen, WFblue and WFgrey of crops and derived crop products for global production. By adopting an interregional input output framework, Zhang et al.,34 analyzed the water footprint of Beijing, China.
The WF within a geographically delineated area (e.g. a province, nation, catchment area or river basin) is the sum of all the processes taking place in that area.18 Although the literature on WF assessment studies is increasing rapidly, there are still very few studies focusing on specific river basins.35 The assessment of WF at a watershed level is an essential step in integrated water resource management and sustainable water use as it helps to understand how human activities influence natural water cycles.24
In India, very few studies has been executed to assess the WF at a basin level. Sambhaji et al.,6 assessed the WF of selected sub basins of river Ganga (i.e. Gomti and Betwa) whereas Kumar36 determined the WF of major crops in rainfed and irrigated areas of Kinnerasani basin. Banjar river watershed lies in a tribal area with meagre literacy, poor socio-economic condition, lack of proper water management practices which leads to agriculture as only source of income for livelihood. The objective of this study is to quantify the WFgreen, WFblue and WFgrey of crops grown in Banjar river watershed (BRW) so as to make a comparison with other water footprint studies executed at global and basin or catchment level. Such comparison would help policy makers and corresponding government agencies to achieve highest crop yields with optimal surface and groundwater resources. It will also prove to be advantageous to have an analysis on the WFgrey values and its changing trend if yields increases substantially.
Study Area: Banjar river watershed (BRW)
Banjar river is one of the primary tributary of river Narmada. The watershed predominantly exists in Balaghat and Mandla district of Madhya Pradesh with higher altitude areas of watershed lying in Kabirdham (Kawardha) and Rajnandgaon district of Chhattisgarh. It is geographically located in between 21041’00’’N - 23030’00’’N latitudes and 80020’00’’E - 81015’00’’E longitudes and covering a total geographical area of 2503 km2 up to the gauging station. The general elevation of the watershed varies from 442 m to 905 m. The study was carried out in between 2000 to 2013. The climate of the area is tropical with moderate winter and severe summers and it generally receives rainfall from southwest monsoon. However due to high general elevation and abundance of forests in the watershed,37 summer temperature does not rise as much as in other areas which generally ranges from 70C in winter to 480C in summer in between 2000 to 2013 with average annual rainfall ranging from 1000 to 1400 mm for the watershed.
A key portion of watershed is covered with forests followed by open land/fallow land/Barren land and agriculture.37 The underlying soils in the watershed are Clay loam, Loam and Clay soil. The Fig. 1 shows the location of BRW and land use pattern of BRW.
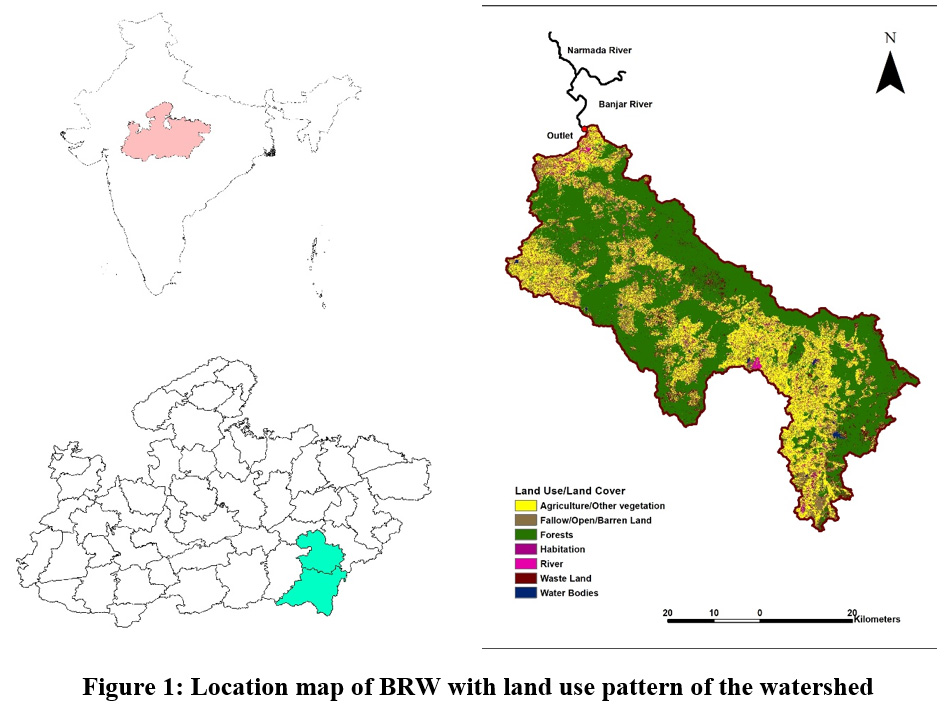 |
Figure 1: Location map of BRW with land use pattern of the watershed Click here to view Figure |
Materials and Method
The WF of crops grown in BRW were computed following the calculation framework as suggested by Hoekstra et al.,18 by considering the WFgreen, WFblue and WFgrey for the study. At preliminary stages, snap pour point technique was followed so as to delineate the watershed in GIS environment using Arc Map 10.3 and consecutively the shape file of watershed was allowed to coincide with the administrative boundaries of the developmental blocks of districts for identifying the blocks that are lying completely or partially within the boundaries of the watershed.
WF assessment of crops
The WFgreen and WFblue of crops were computed using the CROPWAT model using the Crop Water Requirement option of the model, whereas the WFgrey was calculated based on the data available on the fertilizer application rates obtained from the local survey and the data obtained from the Farmer’s welfare website of Government of Madhya Pradesh. The CROPWAT model developed by the FAO Land and Water Development Division38 includes a simple water balance model that allows the simulation of crop water stress conditions and estimations of yield reductions based on well-established methodologies for determination of crop evapotranspiration.39 CROPWAT model estimates the crop evapotranspiration of a given crop by using reference evapotranspiration (ET0). The reference evapotranspiration may be defined as the evapotranspiration rate from a hypothetical grass reference crop with specific characteristics, which has an abundance of water.
CROPWAT model requires meteorological data including maximum temperature, minimum temperature, relative humidity, sunshine hours and rainfall. The lack of available meteorological data at the watershed scale lead to the adoption of data acquired from Global weather data for SWAT for a period of 14 years (2000 – 2013). The unavailability of crop classification maps of BRW lead to the appropriation of an assumption that the crop production statistics for the developmental blocks lying in the watershed was based on the proportionate area. The crop yield statistics of districts underlying in the watershed were obtained from the Agriculture Production Statistics portal of Government of India.
Beside meteorological data, CROPWAT model also requires soil data and crop data for computing the ET0 and ETC The soil map of the watershed was adopted from Tiwari,37 however the soil parameters for each soil type i.e. total available soil moisture content, maximum infiltration rate, initial soil moisture depletion and maximum rooting depth were used based on the preset values of the model. The crop data which includes certain crop parameters such as crop coefficients, length of crop development stages, rooting depth, critical depletion fraction, yield response function and crop height were acquired from FAO Irrigation and Drainage paper no. 56.37
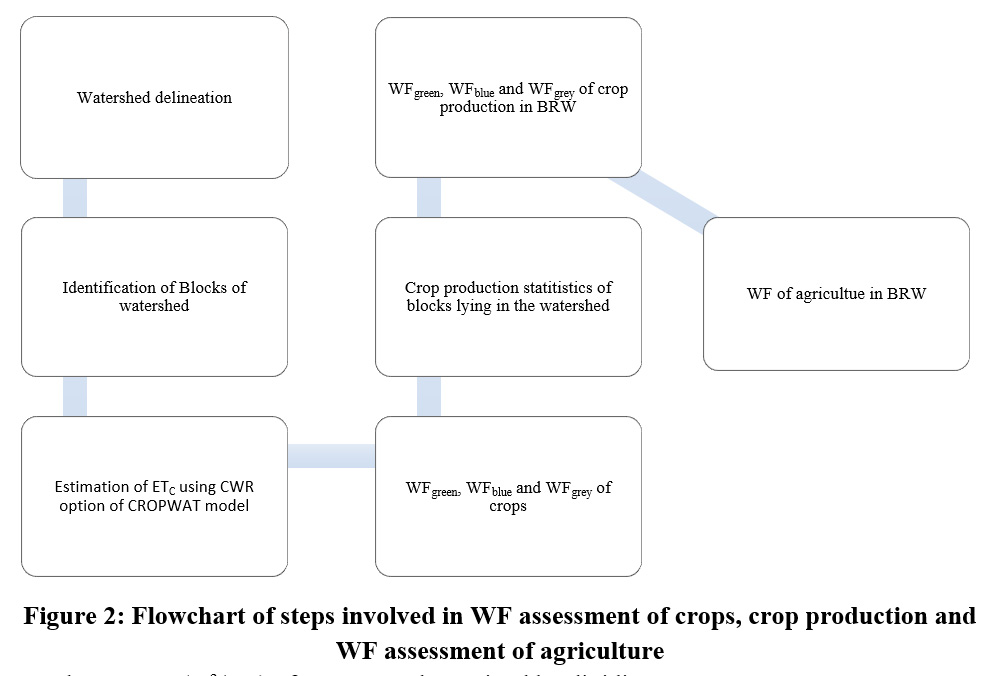 |
Figure 2: Flowchart of steps involved in WF assessment of crops, crop production and WF assessment of agriculture Click here to view Figure |
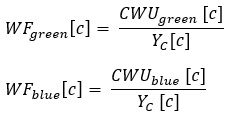
The WFgreen (m3/ton) of crops was determined by dividing green crop water use (CWUgreen, m3/ha) with crop yield. In the similar manner the WFblue of crops was determined by dividing the blue crop water use (CWUblue, m3/ha) with crop yields (Yc, ton/ha).
The CWUgreen and CWUblue were computed by multiplying a factor of 10 with green and blue evapotranspiration.
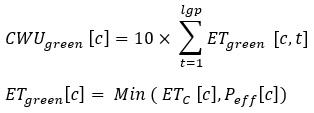
where, t refers to the time step of 10 days, lgp and c stands length of growing period and crop, ETgreen is the green evapotranspiration. “The multiplication of a factor of 10 with ETgreen (mm) and ETblue (mm) gave the values of CWUgreen and CWUblue in terms of m3/ha. The values of crop evapotranspiration (ETC, mm) and effective rainfall (Peff, mm) were acquired from the CROPWAT model. The effective rainfall in the current context denotes the amount of total precipitation that can be used for evapotranspiration by the crop and soil surface. The effective rainfall was calculated using the USDA SCS method. The assessment of WF of agriculture in BRW was the first attempt to quantify the WFgreen, WFblue and WFgrey. The CWUblue was calculated in the similar manner as that of CWUgreen whose formulas are depicted as
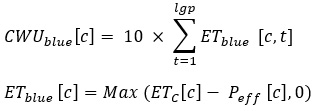
where ETblue is the blue evapotranspiration (mm). The ETgreen is the depth of rainfall supplied to a crop so as to compensate the water losses through crop evapotranspiration whereas the ETblue may be defined as the depth of irrigation water (surface or groundwater) required to compensate the water losses through crop evapotranspiration.27
The WFgrey (m3/ton) was assessed using the mathematical structure as suggested by Hoekstra et al.,18 The chemical application rate to the field per hectare (AR [c], kg/ha) times the leaching-run-off fraction (α, %) is divided by the difference of maximum acceptable concentration (cmax, kg/m3) and natural concentration for the pollutant considered (cnat, kg.m3) and then divided by the crop yield (YC, ton/ha) gives WFgrey (m3/ton). In computing WFgrey, it should be noted that only those pollutants which have higher chemical application rates are taken into consideration for WFgrey accounting as it will present significant value of WFgrey.18 The consumption of chemicals in BRW for agriculture production was only in the form of fertilizer and thus here the chemical application rate is referring to the fertilizer consumed for a decent production. The equation used for assessing the WFgrey is depicted as follows
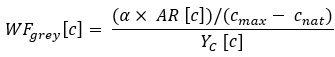
The inadequacy of mathematical model for calculating the leaching runoff fraction (α, %) lead to assumption of adopting α as 10% for assessing the WFgrey as suggested by Hoekstra et al.18
WF assessment of agriculture (WFA)
The WF of agriculture denotes the entire amount of water required for producing all the crops grown within the boundaries of the watershed. The WFA in BRW (million m3/yr) was calculated by summing up the water footprint of crop production (WFCP) for different crops grown in BRW. It was assessed using the following formula
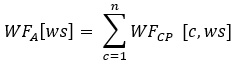
where, c refers to the crop grown in BRW, n represents number of crops and ws denotes BRW. The WFCP for crops grown in the watershed was obtained using the following formula

where, ws has its usual meaning, WFgreen(CP) [c,ws], WFblue(CP) [c,ws], WFgrey(CP) [c,ws] are the green, blue and grey water footprint of crop production for crops grown in BRW expressed in million m3/yr. The WFCP crops grown in BRW were evaluated using the following formulas
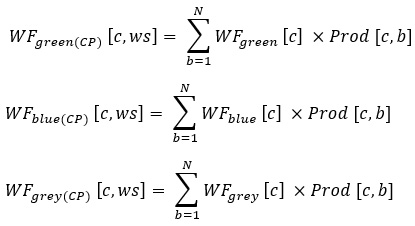
where, b is the blocks of BRW, N shows number of blocks in BRW, and Prod [c, b] refers to production of crop (ton/ha) of a crop c in block b.
Results
Water footprint of crops
The table 1 shows the WF of crops grown in BRW for the mean of 2000 to 2013.Among all the crops taken into consideration, the WF of rice (7848 m3/ton) was maximum followed by gram (5782 m3/ton) and wheat (5417 m3/ton). The higher values of WF for gram was due to lower crop yield of gram over the entire watershed. As gram is a rabi crop, the WFblue was maximum in between the other two components. The WFgreen was highest for rice.
The practice of organic farming in the watershed lead to the value of WFgrey as low for all the crops. The WFgrey was highest for arhar (81 m3/ton) and was lowest for groundnut (38 m3/ton). The figure 3 and 4 portrays the WFgreen, WFblue and WFgrey of crops grown in BRW.
Table 1: Water footprint of crops grown in BRW
|
Crop |
Blue WFP |
Green WFP |
Grey WFP |
Total WFP |
|
m3/ton |
||||
|
Arhar |
109 |
4719 |
81 |
4909 |
|
Gram |
5150 |
569 |
63 |
5782 |
|
Groundnut |
997 |
3051 |
38 |
4086 |
|
Jowar |
212 |
3481 |
45 |
3739 |
|
Maize |
116 |
2734 |
36 |
2886 |
|
Rice |
2884 |
4925 |
39 |
7848 |
|
Soybean |
100 |
2916 |
45 |
3060 |
|
Wheat |
5000 |
369 |
49 |
5417 |
Water footprint of agriculture (WFA)
The WF of agriculture was 690.37 million m3/yr over the mean of 2000 to 2013 in BRW. The table 2 shows the WFCP for crops grown in BRW. Rice was the major contributor to the water footprint of agriculture in BRW having 87.38 % contribution with 63.81 % of WFgreen(CP) of WFtotal(CP). This was due to the predominant practice of taking rice as a kharif crop in BRW. Availability of surplus water and favourable soil type also plays a prominent role in adopting rice as a principal Kharif crop in the BRW. Rice was followed by gram with 4.97 % of WFtotal(CP), wheat with 4.33 % of WFtotal(CP) and maize with 1.31% of WFtotal(CP) to the WFA.
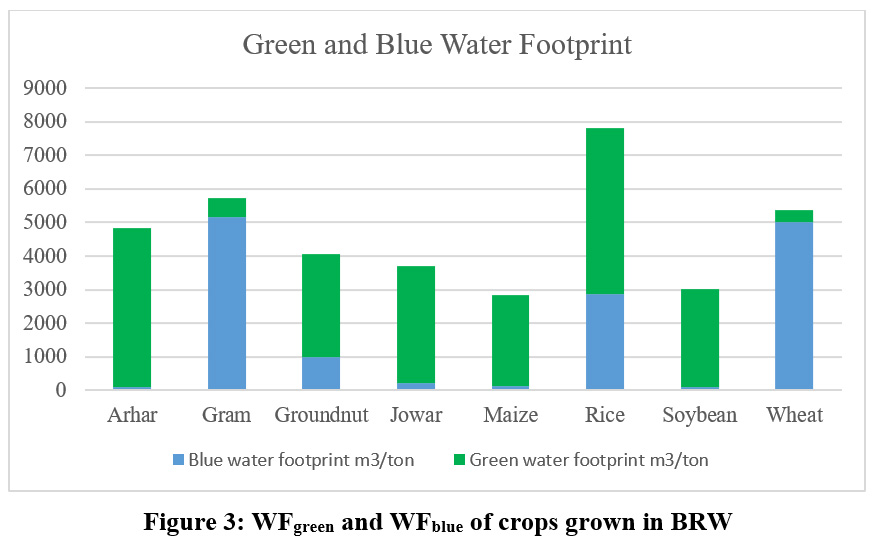 |
Figure 3: WFgreen and WFblue of crops grown in BRW Click here to view Figure |
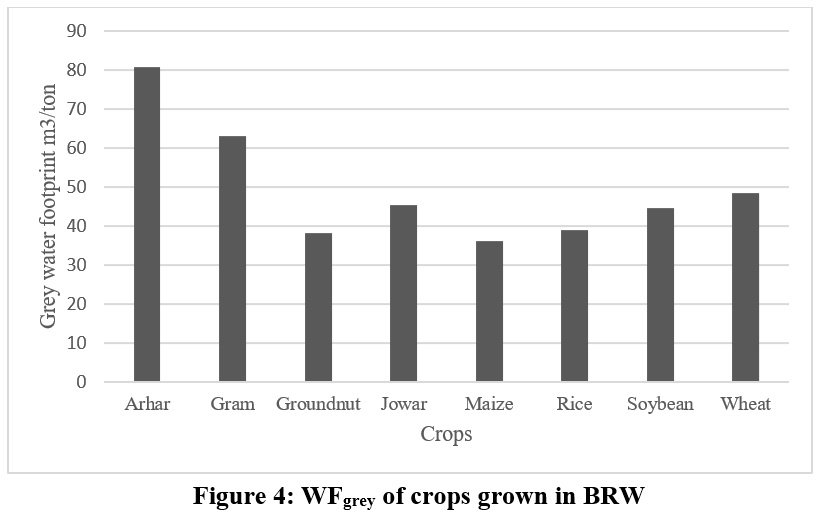 |
Figure 4: WFgrey of crops grown in BRW Click here to view Figure |
Table 2: WFCP of different crops grown in BRW
|
Crop |
Blue WFP |
Green WFP |
Grey WFP |
Total WFP |
|
|
Million m3/yr |
|||
|
Arhar |
0.11 |
4.76 |
0.08 |
4.96 |
|
Gram |
29.88 |
4.02 |
0.45 |
34.35 |
|
Groundnut |
0.11 |
0.39 |
0.01 |
0.50 |
|
Jowar |
0.01 |
0.18 |
0.00 |
0.20 |
|
Maize |
0.41 |
8.54 |
0.10 |
9.05 |
|
Rice |
215.42 |
385.00 |
2.87 |
603.29 |
|
Soybean |
0.31 |
7.64 |
0.14 |
8.09 |
|
Wheat |
27.79 |
1.91 |
0.25 |
29.94 |
|
TOTAL |
274.03 |
412.44 |
3.90 |
690.37 |
The acquisition of good rainfall in BRW is due to the chief occupancy of forests in the watershed which lead to higher WFgreen(CP) for rainfed (Kharif) crops of BRW. As discussed earlier, the WFgrey of crops was minimal and hence the WFgrey(CP) crops grown in BRW was negligible as compared to the WFgreen and WFblue. The Fig. 5 shows the percentage share of each crop in WFgreen, WFblue and WFgrey.
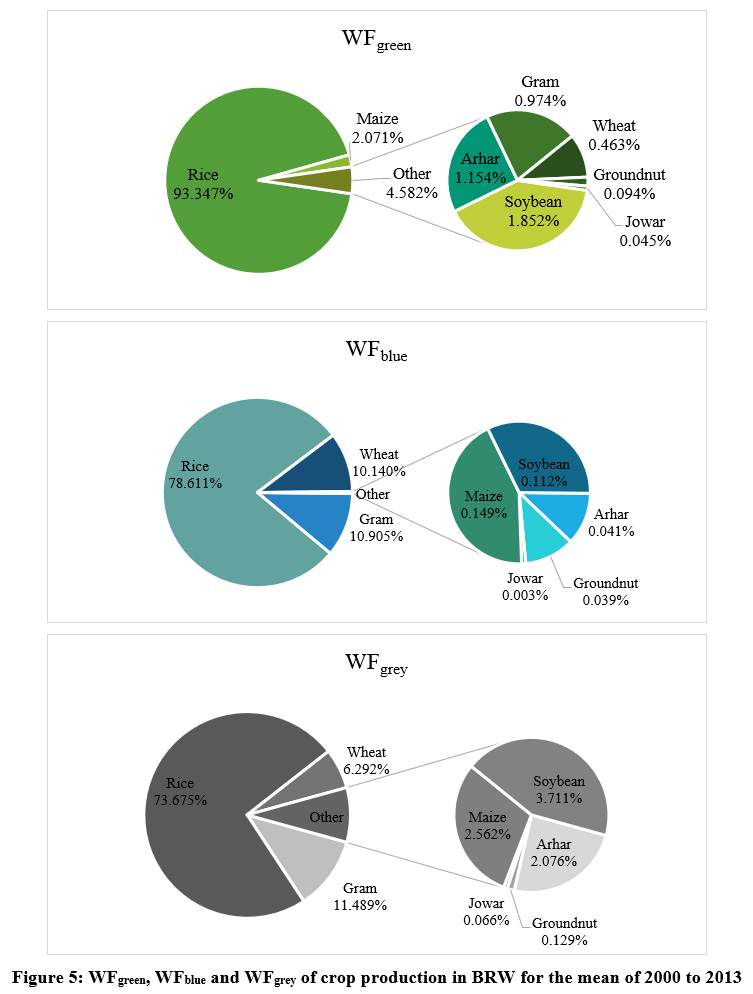 |
Figure 5: WFgreen, WFblue and WFgrey of crop production in BRW for the mean of 2000 to 2013 Click here to view Figure |
Spatial distribution of WFCP in BRW
The Fig. 6 shows the spatial distribution of WF(green)CP, WF(blue)CP WF(grey)CP WF(total)CP of crops grown in BRW. Both the components i.e. green and blue water footprint indicated a similar pattern of spatial extent of WFCP. It revealed that Baihar block of the watershed was having maximum share of the WF(green)CP (123.96 million m3/yr) and WF(blue)CP (75.80 million m3/yr). It was due to high cropped areas of the crops. The Baihar was followed by Paraswada having high share of WF(green)CP (112.90 million m3/yr) and WF(blue)CP (75.24 million m3/yr) WF.
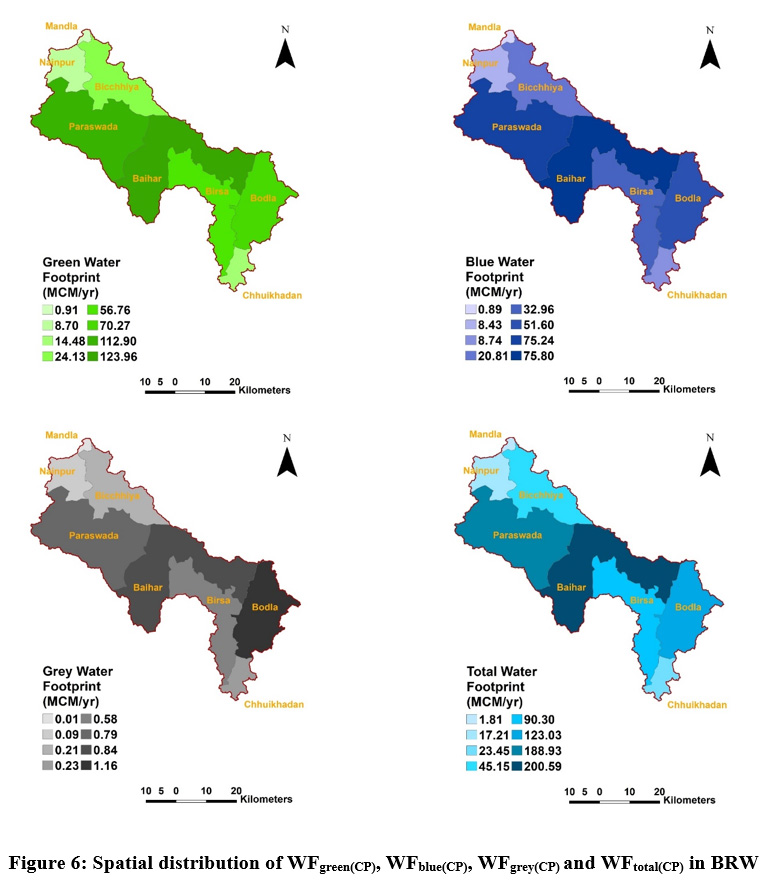 |
Figure 6: Spatial distribution of WFgreen(CP), WFblue(CP), WFgrey(CP) and WFtotal(CP) in BRW Click here to view Figure |
The least values of WF(green)CP and WF(blue)CP was preoccupied by Chhuikhadan (WF(green)CP – 8.70 million m3/yr, WF(blue)CP – 8.43 million m/yr and Mandla block (WF(green)CP – 0.91 million m3/yr, WF(blue)CP – 0.89 million m3/yr). In case of WFgrey(CP), Bodla possessed highest values (1.16 million m3/yr) because of the higher chemical application rates of nitrogenous fertilizer. It was followed by Baihar (0.84 million m3/yr) and Paraswada (0.79 million m3 /yr).
The spatial distribution of WFtotal(CP) showed a similar pattern to the WF(green)CP and WF(blue)CP, having maximum WF(total)CP in Baihar (200.59 million m3/yr) followed by Paraswada (188.93 million m3/yr) and Bodla (123.03 million m3/yr). The block with least WF(total)CP was Mandla (1.81 million m3/yr).
Discussion
The WF of the crops of BRW was different from the national average WF of crops as portrayed by Kampman.27 The WF of rice was 82 % more than national average WF whereas for wheat it was 283 % higher.27 The WF of maize showed least deviation from national average WF of maize with 11.55 % increment. The WF of soybean was 13.2% lower than the average WF of soybean for India.
The values of WFgreen, WFblue and WFgrey of crops grown in BRW when compared with a global study as revealed by Mekonnen and Hoekstra32 gave a good correlation coefficient for rice (0.89). However moderate and poor negative correlation coefficient was obtained for wheat (-.034), maize (-.057) and soybean (-.047). The negative correlation coefficient were due to the high WF values for the crops of BRW.
The WF of agriculture in BRW (690.37 million m3/yr) was much lower than the other studies undertaken at basin or catchment level as evaluated by Miguel et al.,21 for Duero river basin (9473 million m3/yr), Mekonnen and Hoekstra32 for Ganges (408 Gm3/yr), Indus (253 Gm3/yr), Krishna (118 Gm3/yr), Zhuo et al.,40 for Yellow river basin (12.4 billion m3/yr), Martinez-Paz et al.,25 for Segura river basin (4403 million m3/yr, 2874 million m3/yr), Zeng et al.,23 for Heihe river basin (1768 million m3/yr).
Indian study as conducted by Sambhaji et al.,6 gave a moderate negative correlation coefficient (-0.54) for WF of maize, rice and wheat in BRW when compared with Gomti river basin whereas it gave a moderate positive correlation coefficient (0.51) for WF when compared with Betwa river basin. However the WF for Gomti (12196 million m3/yr) and Betwa (8855 million m3/yr) river basin was very much higher due to larger cropped area under each crop.
The WF of rice in BRW (7848 m3/ton) was noticeably higher than the WF of rice (3018 m3/ton) as computed in Gomti river basin whereas the WF of rice for BRW was lower in contrast to WF of rice as calculated for Betwa (8209 m3/ton) river basin. For maize, the WF (2886 m3/ton) in BRW was in the middle of the WF of maize as calculated for both the river basins (Gomti – 4555 m3/ton and Betwa – 3430 m3/ton). A similar trend was represented by groundnut (4086 m3/ton) for BRW which was midst of the WF values of the two river basins (Gomti - 6399 m3/ton, Betwa – 5718 m3/ton).
The WF of wheat in BRW (5417 m3/ton) was much greater than the values of WF for Gomti (1586 m3/ton) and Betwa (3252 m3/ton) river basin. The WF of soybean for BRW (3060 m3/ton) was less than half of the WF of soybean as mathematically obtained for Betwa (6493 m3/ton) river basin.
Large variations of WF of crops in BRW with the WF of crops for Gomti and Betwa river basin was due to lower crop yields in BRW. Farmers residing in BRW are small and marginal farmers owing very small and fragmented farm lands. They generally practice farming as a source of livelihood. BRW being a tribal area triggers lack of awareness, risk bearing capacities, farmer’s voluntary participation in upgraded and efficient agriculture practices with poor soil fertility due to soil erosion in the watershed which often leads to lower crop yields. Adequate rainfall due to abundant forests37 in BRW indicates high values of WFgreen and WFgreen(CP) in BRW. Though crop yields can be increased by assimilation of improved agriculture practices such as crop residue mulching, plastic mulching for good agriculture production in the watershed. Beside management practices, proper irrigation practices can be advantageous for getting higher crop yields. By enhancing crop yields, the WF of crops can be reduced to a much great extent.
It is observed that using drip or subsurface irrigation systems with synthetic mulching, with the inclusion of different environments for crops can help in consumptive WF reduction of 28 % with full irrigation and 29% for deficit irrigation.41 There are numerous uncertainties in WF assessment of agriculture in BRW. At introductory stage, it is due to the input data available for the models. Various numeral assumptions were made in the study which can be discussed as follows:
- The meteorological data was obtained from global weather data for SWAT, which gave best estimated values of meteorological parameters. Although meteorological parameters database was on daily basis with no lack of data, these data could have a significant effect on WF assessment.
- Due to lack of local available data, the crop parameters adopted for the study was consulted from FAO Irrigation and Drainage paper no. 5638 which gave the values of crop coefficients strictly based on nation level.
- The assumption of taking leaching runoff fraction as 10% was adopted as no framework model was available to suit the local conditions of BRW for assessing WFgrey.
- The developmental blocks lying in the watershed was a part of administrative boundary of the district. Lack of crop classification map of the watershed lead to the assumption of adopting second proportionate values of crop production statistics of crops for BRW absolutely based on area.
Conclusion
Over the period 2000 – 2013, the WF of agriculture in BRW was 690.37 million m3/yr with maximum share of WFgreen (59.74 %) preceded by WFblue and WFgrey (39.69 %, 0.56 %). The WF of rice was 7848 m3/ton, preceded by gram (5782 m3/ton), wheat (5417 m3/ton), arhar (4909 m3/ton), groundnut (4086 m3/ton), jowar (3739 m3/ton), soybean (3060 m3/ton) and maize (2886 m3/ton). The study was undertaken on the basis of crop evapotranspiration (ETC) evaluated by adopting CWR option of CROPWAT model. However the irrigation scheduling option can also be used which will present the analysis on non-optimal condition specifying the actual irrigation in time. A more intense approach of using remote sensing by preparing crop classification map of the area can also help in achieving more detailed study of the WF in BRW by incorporating other crops grown on marginal scale in the watershed.Acknowledgements
This research did not receive any specific grant from funding agencies in the public, commercial or not-for-profit sectors.
References
- Oki, T. and Kanae, S. 2006. Global hydrological cycles and world water resources, Science, 313, 1068-1072, DOI:10.1126/science.1128845.
- Postel, S. L., Daily, G. C., and Ehrlich, P. R.,1996. Human appropriation of renewable fresh water, Science, 271, 5250, 785–788, DOI:10.1126/science.271.5250.785.
- Vorosmarty, C. J., Green, P., Salisbury, J., and Lammers, R. B. 2000. Global water resources: vulnerability from climate change and population growth, Science, 289, 284–288, DOi:10.1126/science.289.5477.284, 2000.
- Vorosmarty, C. J., McIntyre, P., Gessner, M. O., Dudgeon, D., Prusevich, A., Green, P., Glidden, S., Bunn, S. E., Sullivan, C. A., and Liermann, C. R. 2010. Global threats to human water security and river biodiversity, Nature, 467, 555–561.
- Mali SS, Singh DK, Sarangi A and Parihar SS. 2018. Assessing water footprints and virtual water flows in Gomti river basin of India. Current Science 115 (4): 721 – 728.
- Sambhaji, M. S. (2014). Crop Water Footprint Assessment for Sustainable Agriculture in Selected Sub-Basins of River Ganga (Doctoral Dissertation, Division of Agricultural Engineering Indian Agricultural Research Institute New Delhi).
- Gleick, P.H. (Ed.), 1993. Oxford University Press, Oxford, UK.
- Postel, S.L., 2000. Entering an era of water scarcity: the challenges ahead. EcolAppl. 10 (4), 941–948.
- WWAP, 2009. The United Nations World Water Development Report 3: Water in a Changing World, World Water Assessment Programme. UNESCO Publishing, Paris/Earthscan, London.
- Mekonnen, M.M., Hoekstra, A.Y., 2010. A global and high-resolution assessment of the green, blue and grey water footprint of wheat. Hydrol. Earth Syst. Sci. 14,1259–1276.
- Yang, H., Reichert, P., Abbaspour, K. C., and Zehnder, A. J. B.2003. A water resources threshold and its implications for food security, Environ. Sci. Technol., 37, 3048–3054.
- Shiklomanov, I.A., 2000. Appraisal and assessment of world water resources.Water Int. 25 (1), 11–32.
- Molden, D., Oweis, T. Y., Pasquale, S., Kijne, J. W., Hanjra, M. A., Bindraban, P. S., & Hachum, A. 2007. Pathways for increasing agricultural water productivity (No. 612-2016-40552).
- Hoekstra AY (ed.). 2003. Virtual water trade: Proceedings of the International Expert Meeting on Virtual Water Trade, Value of Water Research Report Series No.12. UNESCO-IHE, Delft, Netherlands
- Hoekstra, A.Y., Chapagain, A.K., 2008. Globalization of Water: Sharing the Planet’s Freshwater Resources. Blackwell Publishing, Oxford, UK.
- Ababaei, R., Etadali H.R., 2016. Water footprint assessment of main cereals in Iran. Agricultural Water Management.
- Patle, D., & Awasthi, M. K. (2019). Past Two Decadal Groundwater Level Study in Tikamgarh District of Bundelkhand. Journal of the Geological Society of India, 94(4), 416-418.
- Hoekstra AY, Chapagain AK, Aldaya MM, Mekonnen MM. 2011. The water footprint assessment manual: setting the global standard. Earthscan, London
- Van Oel, P.R. and Hoekstra, A.Y. 2010. The green and blue water footprint of paper products. Value of Water Research Report Series, 46.
- Chapagain, A.K. and Hoekstra, A.Y. 2007. The water footprint of coffee and tea consumption in the Netherlands. Ecological economics, 64(1), pp.109-118.
- Mekonnen, M.M. and Hoekstra, A.Y. 2012. A global assessment of the water footprint of farm animal products. Ecosystems, 15(3), pp.401-415.
- Miguel, Á.D., Kallache, M. and García-Calvo, E. 2015. The water footprint of agriculture in Duero River Basin. Sustainability, 7(6), pp.6759-6780.
- Dumont, A., Salmoral, G. and Llamas, M.R. 2013. The water footprint of a river basin with a special focus on groundwater: The case of Guadalquivir basin (Spain). Water Resources and Industry, 1, pp.60-76.
- Zeng, Z., Liu, J., Koeneman, P.H., Zarate, E. and Hoekstra, A.Y. 2012. Assessing water footprint at river basin level: a case study for the Heihe River Basin in northwest China. Hydrology and Earth System Sciences, 16(8), pp.2771-2781.
- D’Ambrosio, E., Gentile, F., & De Girolamo, A. M. (2019). Assessing the sustainability in water use at the basin scale through water footprint indicators. Journal of Cleaner Production, 118847.
- Paz M., J.M., Gomariz-Castillo, F. and Pellicer-Martínez, F. 2018. Appraisal of the water footprint of irrigated agriculture in a semi-arid area: The Segura River Basin. PloS one, 13(11), p.e0206852
- Zhao, R., He, H. and Zhang, N. 2015. Regional water footprint assessment: A case study of Leshan City. Sustainability, 7(12), pp.16532-16547.
- Kampman, D.A. 2007. The water footprint of India: a study on water use in relation to the consumption of agricultural goods in the Indian states (Master's thesis, University of Twente).
- Ahmed, S.M. and Ribbe, L. 2011. Analysis of water footprints of rainfed and irrigated crops in Sudan. Journal of Natural Resources and Development, 1(1), p.9.
- Ge, L., Xie, G., Zhang, C., Li, S., Qi, Y., Cao, S. and He, T. 2011. An evaluation of China’s water footprint. Water Resources Management, 25(10), pp.2633-2647.
- Arabi, A., Alizadeh, A., Rajaee, Y.V., Jam, K. and Niknia, N. 2012. Agricultural water foot print and virtual water budget in Iran related to the consumption of crop products by conserving irrigation efficiency. Journal of Water Resource and Protection, 4(5), p.318.
- Chapagain, A.K. and Hoekstra, A.Y. 2011. The blue, green and grey water footprint of rice from production and consumption perspectives. Ecological Economics, 70(4), pp.749-758.
- Mekonnen, M.M. and Hoekstra, A.Y. 2011. The green, blue and grey water footprint of crops and derived crop products. Hydrology and Earth System Sciences, 15(5), pp.1577-1600.
- Zhang, Z., Yang, H. and Shi, M. 2011. Analyses of water footprint of Beijing in an interregional input–output framework. Ecological Economics, 70(12), pp.2494-2502.
- UNEP. 2011. Water footprint and corporate water accounting for resource efficiency, United Nations Environment Programme, Paris, available at: http://www.waterfootprint.org/Reports/UNEP-2011.pdf
- Kumar, K G. 2016. Determination of water foot prints for irrigated and rainfed areas of Kinnerasani basin (masters dissertation, Professor Jayashankar Telangana State Agricultural University Rajendranagar, Hyderabad).
- Tiwari, J. 2017. Integration of Universal Soil Loss Equation With wat for soil Erosion Assessment: A Case Study of Banjar River Watershed (Masters dissertation, JNKVV, Jabalpur).
- Smith, M. 1992. CROPWAT: A computer program for irrigation planning and management (No. 46). Food & Agriculture Org.
- Allen, R.G., Pereira, L.S., Raes, D. and Smith, M. 1998. Crop evapotranspiration-Guidelines for computing crop water requirements-FAO Irrigation and drainage paper 56. Fao, Rome, 300(9).
- Zhuo, L., Mekonnen, M. M., Hoekstra, A. Y., & Wada, Y. (2016). Inter-and intra-annual variation of water footprint of crops and blue water scarcity in the Yellow River basin (1961–2009). Advances in water resources, 87, 29-41.
- Chukalla, A. D., Krol, M. S., & Hoekstra, A. Y. (2015). Green and blue water footprint reduction in irrigated agriculture: effect of irrigation techniques, irrigation strategies and mulching. Hydrology and earth system sciences, 19(12), 4877-4891.


