Evaluation of the Efficiency and Quality of the Water of the Al-Hartha Water Treatment Plant in Basra City
Ahmed Sadiq Al Chalabi1
*

http://dx.doi.org/10.12944/CWE.15.1.11
This study was conducted on the Al-Hartha Water Treatment Plant (HWTP), the largest water treatment plant in the city of Basra, during the period from December 2017 to March 2018. This study gives a description of the units and components of the HWTP, and aimed to evaluate the efficiency of the plant by calculating the efficiency of its sedimentation, filtration and sterilisation basins. Additionally, it aimed to examine its water quality by examining the physical and chemical characteristics of the raw water and treated water at this plant and then comparing the findings with the World Health Organisation (WHO) and Iraqi standard limitations.
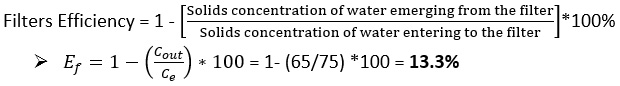
The results of this study showed that the efficiency of the sedimentation basins is 57%, while the efficiency of the filtration basins is 13.3%, and the sterilisation efficiency ranges from 27 to 50%. The laboratory results for the treated water quality have shown that the turbidity is equal to 12.8 NTU, electrical conductivity (EC) is equal to 7750 µs/cm, the total salt concentration of the total dissolved solids (TDS) is equal to 5200 mg/l, and the concentration of the total suspended solids (TSS) is equal to 65 mg/l of the water outside from the HWTP. All these water quality results are higher than the WHO and Iraqi standard limitations, except the pH value of 6.95, which is within the permissible limits.
Copy the following to cite this article:
Al Chalabi A. S. Evaluation of the Efficiency and Quality of the Water of the Al-Hartha Water Treatment Plant in Basra City. Curr World Environ 2020; 15(1).
DOI:http://dx.doi.org/10.12944/CWE.15.1.11Copy the following to cite this URL:
Al Chalabi A. S. Evaluation of the Efficiency and Quality of the Water of the Al-Hartha Water Treatment Plant in Basra City. Curr World Environ 2020; 15(1). Available from: https://bit.ly/2JFuuV9
Download article (pdf)
Citation Manager
Publish History

Introduction
Basra is the largest city in southern Iraq and the third-largest city in Iraq in terms of area and population density, with a population of about 2.5 million according to estimates in 2014. It is the administrative and political Centre of the province of Basra, which is the economic capital of Iraq, and also Iraq's main port. It is located in the far south of Iraq on the west bank of the Shatt Al-Arab River. The Shatt Al-Arab consists of the confluence of the Tigris and Euphrates rivers. The two rivers in the region (Kermat Ali) meet at the northern entrance of the city of Basra, 375 km south of Baghdad. It is about 190 km long and is located in the Arabian Gulf on the edge of Fao City, the highest point in southern Iraq.1 The aim of this study is to assess the quality of drinking water and the efficiency of the HWTP in Basra, because the Shatt al-Arab River is the main and only source of water in Basra. Safe drinking water is a basic requirement for good health, and it is also a fundamental human right. Fresh water is already a limited resource in many parts of the world, and, in the next century, it will become even more limited due to increasing populations, urbanization and climate change.2 Water quality depends on its physical, chemical, and biological properties. Water contains impurities in addition to dissolved solids, and these impurities are often removed or reduced to certain limits to make the water drinkable. The percentage of impurities depends on the purpose for which the water is used.3,4 Drinking water must be healthy and clean, and therefore it is necessary to determine the concentration of impurities allowed in it. It must be free of contaminants and not cause damage, disease or pain, as well as taste good and be free of odors.5 It must also meet certain criteria required by health organizations, including the World Health Organization (WHO).6,7 These standards are general and not absolute and may vary depending on local conditions and the cost of treatment. The process of water purification is carried out using sedimentation and filtration units to remove the outstanding impurities. In Iraq, in general, most of the drinking water purification plants contain a sand filter. After sedimentation and filtration, chlorination is the final stage in the process.8,9
The purification of drinking water plays an important role in eliminating many bacteria. Water is a fast way for many diseases and parasites to spread, as well as being an important part of the life cycle of some causes of disease, as confirmed by WHO reports that state that 80% of human injuries in developing countries have to do with water pollution.10,11,12Interest in assessing the efficiency of treatment plants should not be limited to traditional characteristics related only to domestic use, but should also include attention to toxic chemicals that are human pathogens.7,13 The quality or low efficiency of any treatment plant can be due to two reasons: first, issues with the processes performed in these stations and their ability to carry out the purification and sterilization of water; and second, the performance of the people working in these plants.14
This research was based on the study of a set of physical and chemical properties; values for turbidity, pH, total dissolved solids (TDS), electrical conductivity (EC), total suspended solids (TSS), and magnesium, nitrate and sulphate were examined. These values were compared with Iraqi standards and WHO specifications to evaluate the performance and efficiency of the HWTP, which is one of the largest stations for processing drinking water in the city of Basra and was designed with a production capacity of 5000 m3/h.
A study was previously conducted on the Gas Al-Shamal Company water treatment plant. The study aimed to evaluate the efficiency of the plant by testing the physical and chemical characteristics of its raw water and treated water, and then comparing the results with the characteristics of Iraqi drinking water standards. The study showed that the plant was efficient for turbidity and TSS removal. The results appeared to show that the values for TDS, total hardness (TH), EC, chloride (Cl), and sulphates were within the limits of Iraqi drinking water standards for raw and treated water. The results also show that the (pH) values were not within suitable bounds in terms of flocculation materials. The fluoride values of raw and treated water were low and within the standards.15 Another study was conducted at the Al-Qubbah project for water purification plant to study its efficiency and then make proposals to help improve it. Accordingly, the research team conducting this study in drinking water purification plant in nautical, that the study showed that the plant is working efficiently and that the operating system is under development.16 Another study was conducted in Baghdad at the Al-Wahda water treatment plant, which consists of two projects for the treatment of water. The old project was completed in 1942, and the new project was completed in 1959. Its capacity is 75000 m3/day. This study aims to evaluate the performance of the Al-Wahda water treatment plant by measuring the removal efficiency of sedimentation and filtration basins in the new project and noting the problems experienced by the station.17 Another study, conducted to assessment of two drinking water treatment plants in Baghdad City, Iraq from December 2016 to July 2017. Three sites for each plant were selected which represent the sedimentation basin, filtration basin and final stages after chlorination. Seventeen physicochemical parameters of water quality were analyzed in this assessment. The results showed variation in drinking water quality parameter values in both treatment plants. Moreover, the presence of numbers of bacteria greater than permissible limit, indicating a deficiency in the purification process.18
Materials and Methods
Research Area
The study area is located between latitude 30°38'53.71" N and longitude 47°44'51.98" E, as shown in Figure 1. Hartha city is located in the north of Basra province, on the eastern bank of the Shatt Al-Arab River. In the north, it is bordered by the Qurna district, and in the south, it is bordered by the centre of Basra province. The Shatt Al-Arab River is one of the largest fluvial systems in the world. It originates from the confluence of the Tigris and Euphrates rivers at kermat-Ali (about 70 km north of Basra governorate) and it also constitutes a delta before it finally spills into the Arabian Gulf near Fao city (about 90 km south of Basra city).1,19 The census of Hartha City shows there were 80,875 residents in 2009. The geographical area is 418 km2. The Unified Basra Water Project is one of the biggest projects in the town of Hartha for the distribution of drinking water. The foundation stone for the project was laid in 1973, and the project was executed and run from 1976. Water treatment at the plant follows traditional methods, and the plant has a projected total capacity of 5,000 cubic metres. The water source for the plant is the Shatt Al-Arab River, and the project supplies the city centre and several neighbourhoods.
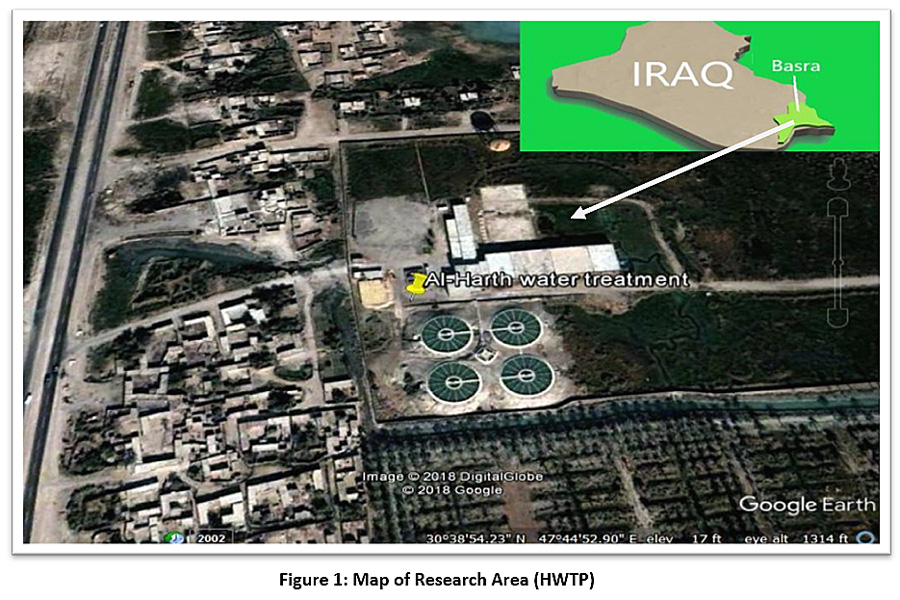 |
Figure 1: Map of Research Area (HWTP) Click here to view Figure |
Parts of the Plant:
The HWTP consists of several stages, as shown in illustration 2:
- Inlet: this is the first part of the station, through which the water enters the plant directly from the Shatt Al-Arab River. The inlet contains a secondary part, during which alum is added for the purpose of sterilisation.
- Added Alum: alum is added in proportion to the water turbidity: 100–150 kg of alum for every 25 cubic metres of water if the turbidity is 20 PPM, but if turbidity ratio increases to 60 PPM, 300 kg of alum is added.
- Sedimentation basins: the station has four sedimentation basins of the same size and shape: the height of each basin is 9 metres, the diameter of each one is 30 m, and the base is 15m. The capacity of each basin is 1,000 cubic metres. The basins are cleaned either by using submersibles, manual cleaning with small skimmers by workers, or mechanical cleaning, according to the project maintenance schedule. They are supposed to be cleaned every six months but are cleaned each period according to when this is possible.
- Basins for alum fermentation: the presence of alum fermentation tanks at the station is necessary for ensuring the outstanding sediment is deposited in the bottom of the basin and then discarded. Each basin has a capacity of 27 cubic metres, and alum is added in proportion to the water turbidity.
- Filters: the plant contains 20 filters. It is necessary to wash the filters on a regular basis to get more water purity and less turbidity. The filters are washed ten times each day; each filter takes 30 minutes for a total of five hours of filter washing per day. The sand filter in Hartha plant was switched off ten years ago (2004-2014), and this also has a role in influencing the efficiency of the station.
- Filtration network: concrete filters are used. These grids exist within the filter. One filter contains a filtering network of 80 tubes, meaning one side contains 20 tubes. Its function inside the filter is to compress the air to move the pores of the sand, so that the air comes out from the small holes on the sides along the tube, and thus the sand is broken and moved through small holes. The large holes have a diameter of 7mm to get out with the air, and the distance between the holes and the other 30m is the clean water coming out.
- Special channel after the basins: there is a special channel for water passing through the sterilisation basins and filters that leads to the overflow.
- Overflow: a small canal at the end of the station through which the excess water leaves the station.
- Pumps: the station contains 12 pumps: six of them go to the centre of Basra, three to the city of Hartha and three to wash the filters (reverse pumping).
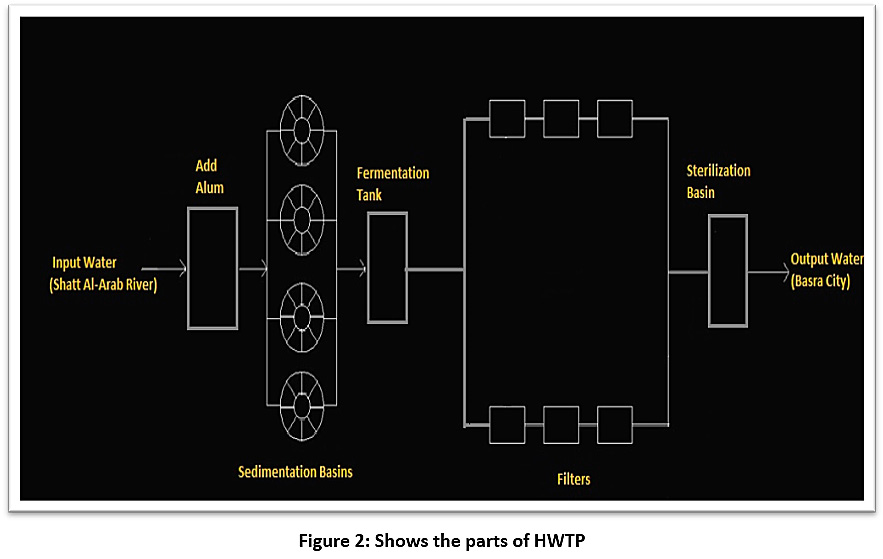 |
Figure 2: Shows the parts of HWTP Click here to view Figure |
Collection of Samples
The water samples for the chemical and physical examination were collected in plastic bottles made of polyethene material with a capacity of 500 ml, during the period from December 2017 to March 2018. The samples were collected from each stage of purification at the plant, from raw water (river water) to water from the station (tap water). Samples were taken from the sedimentation basin before adding alum at different depths (1.5, 3, 4.5, 6, 7.5m) and at a certain time (at 8:00 am). This was assumed to be the zero hour. Then, alum was added to the water, and the samples were taken from the same depths at different times: one, two and three hours from the virtual zero hour. Samples were collected in December at 15-17 ° C, January at 14-16 ° C, February at 15-17 ° C and March at 17-20 ° C for laboratory testing in dark plastic bottles, at a rate of three samples each month, with three replicates for each sample. Standard sampling methods were used. The samples were preserved, analysed, and tested using equipment and materials manufactured by international companies.20 pH and TDS were measured using a pH meter (EXTECH - EC500), turbidity was measured with a turbidity meter (Turbi Direct - Lovibond), EC was measured using an electrical conductivity meter (WTW - Cond 3110), TSS was measured using the Gravimetric method (SMEWW5520D), and magnesium, sulphates and nitrates were measured using a spectrophotometer (BIOTECH - UV-2601).
Efficiency of Sedimentation Basins
The deposition theory was adopted to explain the efficiency of the general sedimentation basin, which states that when a particle is placed in a liquid that is less than its density, it accelerates to a normal speed and thus equals the weight of the submerged body with the friction force, leading to deposition.21 From the theoretical side, deposition velocity, which depends on the diameter of the spherical granule, can be calculated using Stokes’ law. On the practical side, it is difficult to determine the size, weight and shape of spherical particles. Therefore, the degree of sedimentation is calculated as follows:
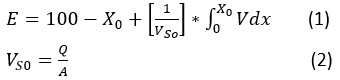
After obtaining the concentration of the suspended material for raw water (C0), samples were taken from the sedimentation column device during a certain time and the concentration of the suspended substance was calculated (C1, C2, …..., Cn) at different depths of the sedimentation basin (H1, H2, …..., Hn) (see Figure 3). Therefore, the particles with a precipitation velocity greater than (V1=H1/T1) are deposited after sampling, and the rest of the particles have a velocity lower than V1. As such, the percentage of particulate matter (X1) whose sedimentation velocity is less than V1 can be found from the equation (X1=C1/C0). By re-sampling for different periods of time, a diagram of the characteristics of the suspended material can be drawn (see Figure 4).21,22 The removal efficiency of the sedimentation basin is calculated as shown in this equation:
Where:
Q: flow rate input to the sedimentation basin.
A: a cross-sectional area of the sedimentation basin.
VS0: represents the settling velocity (mm/sec).
X0: is a value on the curve corresponding to speed (VS0).
The integration limit in the equation (1) represents the shaded area of the chart in Figure 4, which can be calculated using the Simpson theory or the Newton-Raphson theorem or by approximation of the graph.21,22
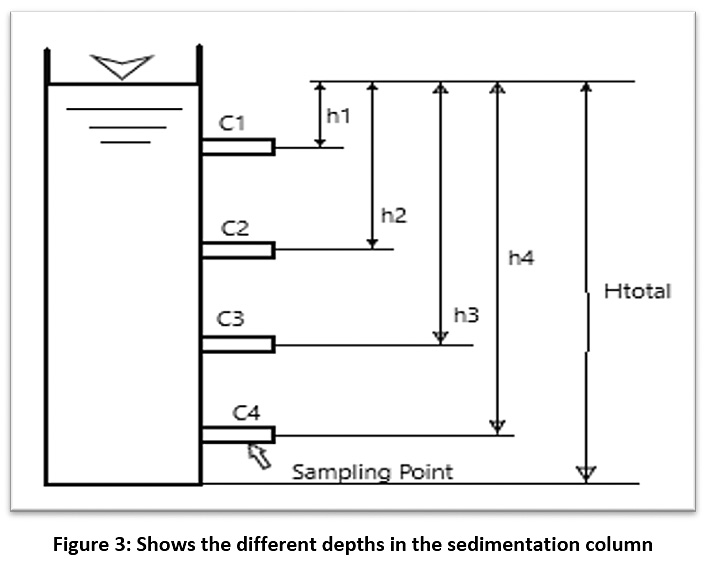 |
Figure 3: Shows the different depths in the sedimentation column Click here to view Figure |
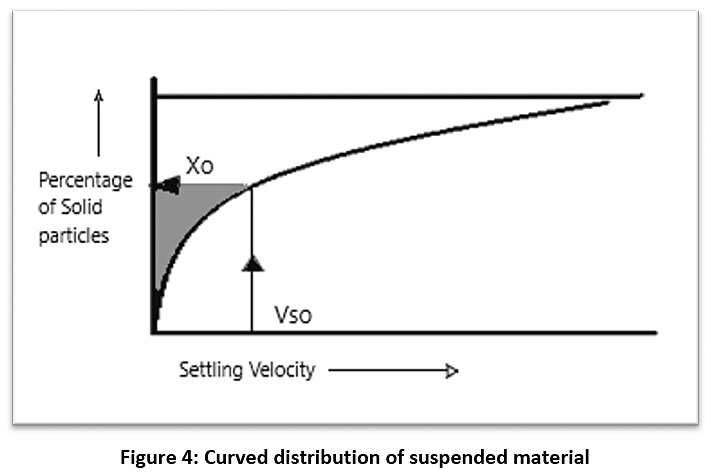 |
Figure 4: Curved distribution of suspended material Click here to view Figure |
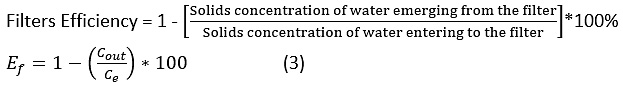
Efficiency of the Filters
The filters used in the plant are quicksand filters. The pores of the top filtration layer (in which the sand is of a rough quality) are of a large type, facilitating the permeability of the granules and impurities into the filter. Thus, the filtration efficiency increases the ability to eliminate impurities, which facilitates the filtration of water with high turbidity.
The efficiency of the sterilisation process (disinfection) of water
When estimating the efficiency of the water sterilisation process, it is known that filtration does not work efficiently to remove bacteria and small-scale viruses that are smaller than one micron. Thus, quicksand filters do not produce good water in terms of reducing bacteria. As such, the addition of chlorine is required to remove the bacteria.21 The degree of germicide depends on the number of germs originally identified. Therefore, the efficiency of the cleansing is provided as a percentage of the number of germs that have been killed from the number of germs already present. The killing of germs depends on several interrelated factors: for example, the efficiency of the disinfectant to penetrate the living cells, the quantity of the disinfectant and the number and type of germs. US water standards state that water is safe to drink if it contains a total number of bacteria less than 100 microbes per ml estimated in the manner of dishes on the environment of agar, while the WHO recommends no more than 50 cells in 100 ml.

Results
Sedimentation Efficiency
The samples from the sedimentation basin at different depths and at different times and the concentration of the solids remaining suspended in each sample are shown in Table 1. After that, the velocity and percentage of removal of suspended materials are calculated, as shown in Table 2.
Table 1: TSS concentration of sediment basin samples
|
Depth (m) |
TSS (mg/l) |
|||
|
Settling Time (hr) |
||||
|
0 |
1 |
2 |
3 |
|
|
1.5 |
145 |
71 |
81 |
91 |
|
3 |
145 |
55 |
61 |
66 |
|
4.5 |
145 |
47 |
42 |
46 |
|
6 |
145 |
31 |
36 |
39 |
|
7.5 |
145 |
21 |
27 |
33 |
Table 2: Shows the velocity and calculates the percentage of removal of suspended solids
|
Depth (mm) |
Time (sec) |
Velocity (mm/sec) |
Removal solids |
Removal percent (%) |
|
1500 |
3600 |
0.417 |
0.49 |
51 |
|
1500 |
7200 |
0.208 |
0.55 |
45 |
|
1500 |
10800 |
0.139 |
0.62 |
38 |
|
3000 |
3600 |
0.833 |
0.38 |
62 |
|
3000 |
7200 |
0.417 |
0.42 |
58 |
|
3000 |
10800 |
0.278 |
0.45 |
55 |
|
4500 |
3600 |
1.25 |
0.32 |
68 |
|
4500 |
7200 |
0.625 |
0.29 |
71 |
|
4500 |
10800 |
0.417 |
0.32 |
68 |
|
6000 |
3600 |
1.667 |
0.21 |
79 |
|
6000 |
7200 |
0.833 |
0.25 |
75 |
|
6000 |
10800 |
0.556 |
0.27 |
73 |
|
7500 |
3600 |
2.083 |
0.14 |
86 |
|
7500 |
7200 |
1.042 |
0.18 |
82 |
|
7500 |
10800 |
0.694 |
0.22 |
78 |
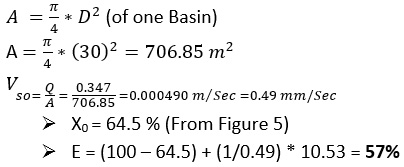
(one basin) = Total flow rate / No. Sedimentation Basin
Q = 5000/4= 1250 m3/hr
Q = 0.347 m3/sec
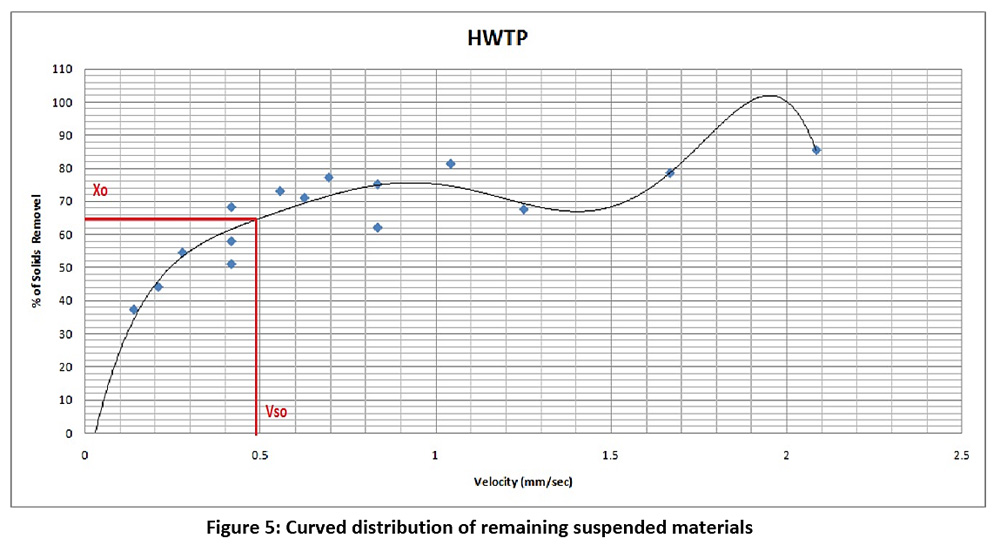 |
Figure 5: Curved distribution of remaining suspended materials Click here to view Figure |
Efficiency of Filters
To calculate the efficiency of the filters, we use Equation 3 as follows:
Efficiency of Sterilisation
To calculate the efficiency of the sterilization basin, we use Equation 4 as follows:
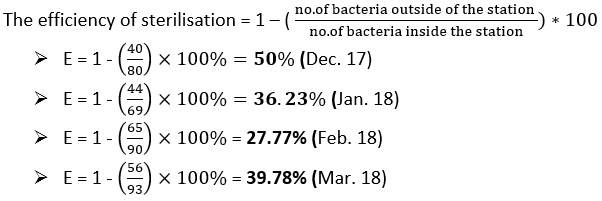
Figure 6 represents the bacteria preparation for raw water, water entering the filters and treated water during the study period. We find the numbers of bacteria in all cases large numbers, which means that the process of adding chlorine in the sterilization basin is not done correctly so we find that the efficiency of the sterilization basin is very low ranging between 27-50%.
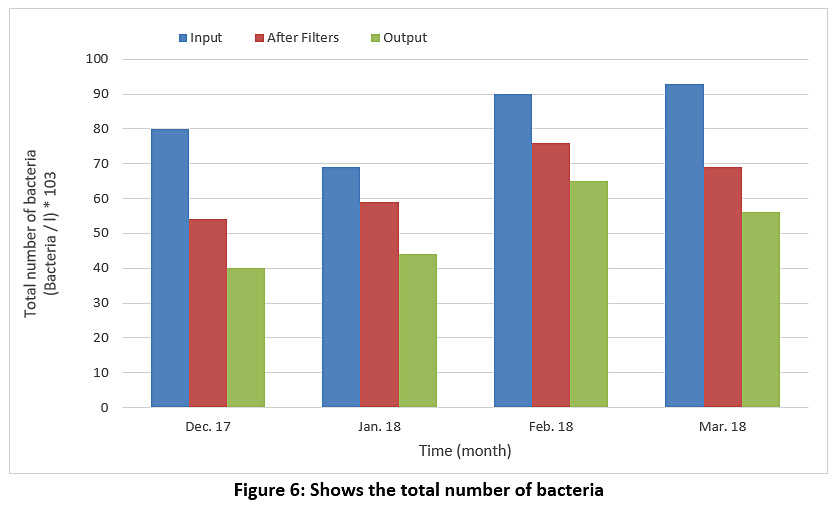 |
Figure 6: Shows the total number of bacteria Click here to view Figure |
Water Quality
Below are the laboratory results for the river water (Shatt Al-Arab river), drinking water (treatment), and the values for physical, chemical and bacteriological water quality assessment.
Figure 7 represents the pH values. The pH value of the raw water is 6.9, while the pH value of the treated water is 6.95. We note that the pH levels are almost constant and are within the allowable limit in Iraq and according to the WHO (see Table 3), noting that the pH degree is affected by the addition of alum and chlorine to the water.
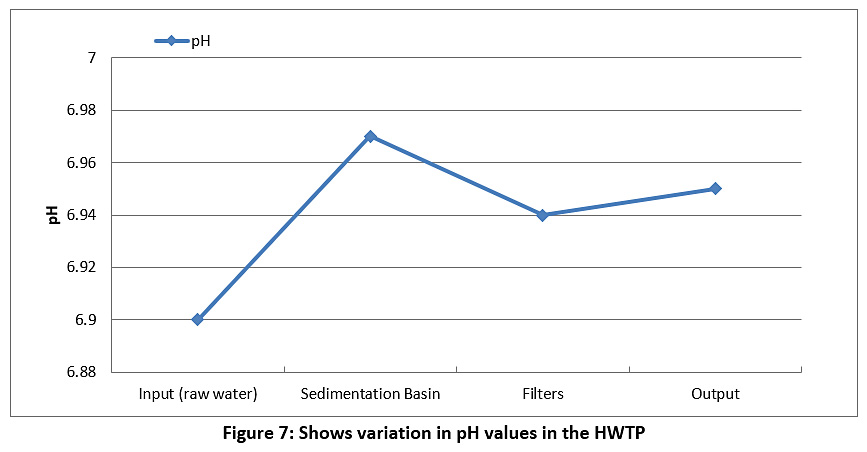 |
Figure 7: Shows variation in pH values in the HWTP Click here to view Figure |
Figure 8 represents the turbidity of the raw water and treated water during the study period. The turbidity value for the raw water is 54.5 NTU, and this value decreased during the passage through the plant until it reached 12.8 NTU for the treated water. However, the value of turbidity was higher than the permissible limits for Iraq and the WHO (see Table 3).
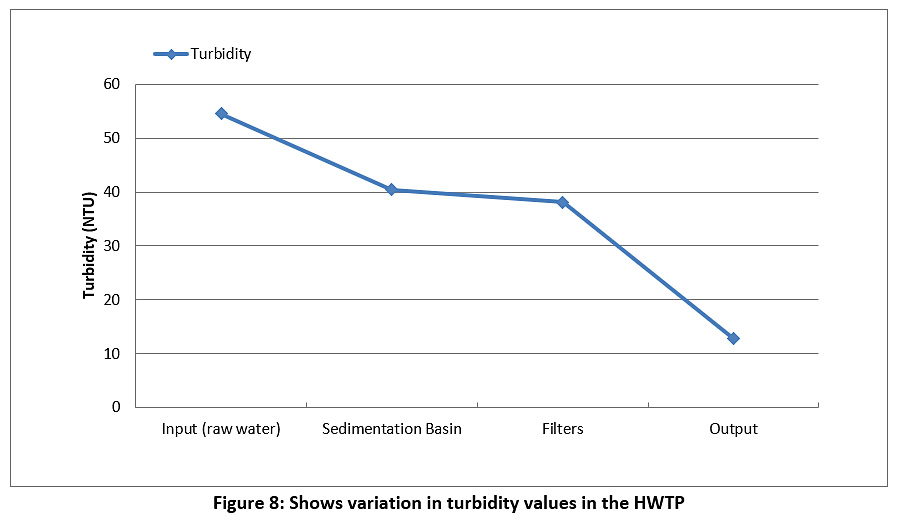 |
Figure 8: Shows variation in turbidity values in the HWTP Click here to view Figure |
Figure 9 represents the TDS of the raw water and treated water during the study period. The TDS of the raw water and treated water are higher than the permissible limits of the Iraqi standard and the WHO (less than 500 mg/l) see Table 3. We conclude from this that the TDS values are directly proportional to the turbidity of water coming from the river.
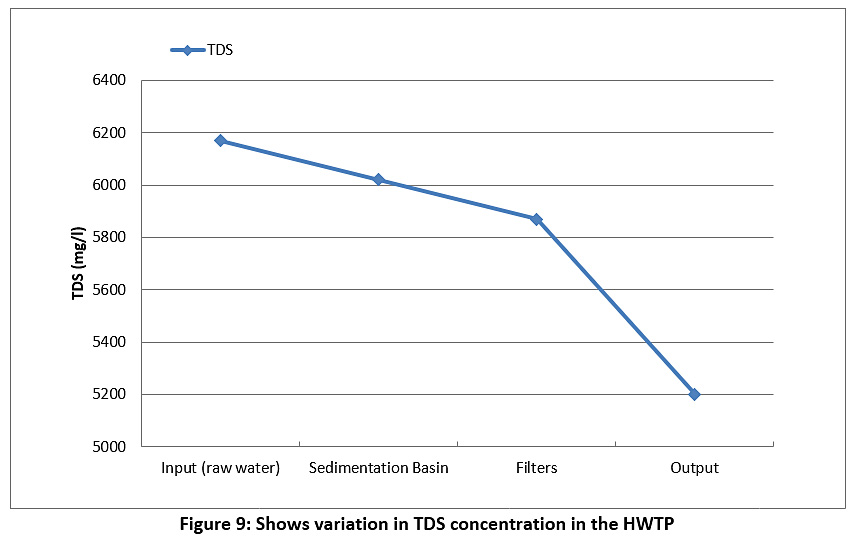 |
Figure 9: Shows variation in TDS concentration in the HWTP Click here to view Figure |
Figure 10 represents the EC of the raw water and treated water during the study period. The EC of the raw water and treated water are higher than the permissible limits of the Iraqi standard and the WHO (less than 1000 µS/cm) see Table 3.
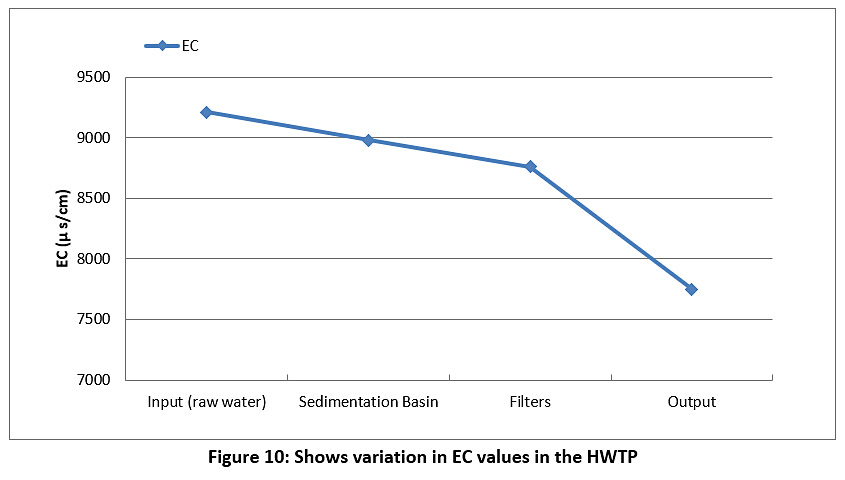 |
Figure 10: Shows variation in EC values in the HWTP Click here to view Figure |
Figure 11 represents the TSS of the raw water and treated water during the study period. The TSS value for the raw water was 145 mg/l, and this value began to decrease during passage through the plant until it reached 65 mg/l for treated water. However, the TSS value was higher than the permissible limits for Iraq and the WHO (see Table 3).
Figure 12 represents the concentrations of magnesium, nitrate and sulphate during the study period. The raw water, treated water and the calculation of the removal ratio were measured. The concentration of magnesium for the raw water was 145 mg/l, while for the treated water it was 34 mg/l; the concentration of nitrate for the raw water was 3.4 mg/l, while for the treated water it was 3.1 mg/l; the concentration of sulphate for the raw water was 375 mg/l, while for the treated water it was 368 mg/l. All of these values are less than the permissible limits for Iraq and the WHO (see Table 3).
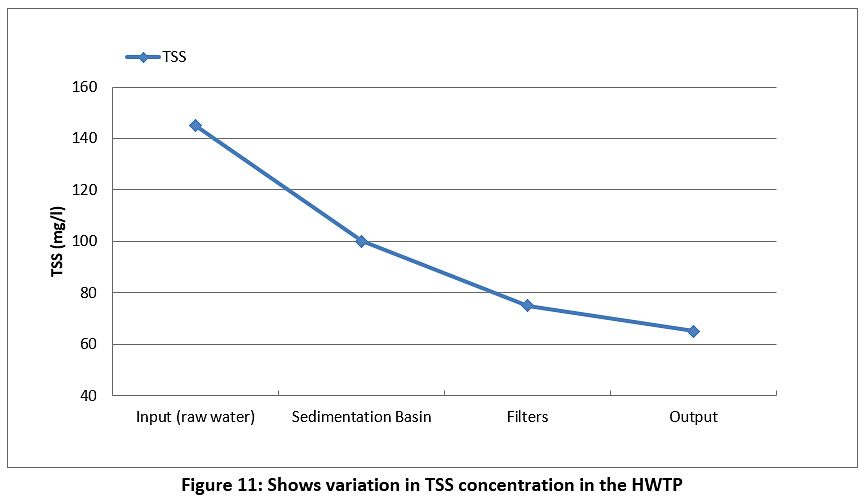 |
Figure 11: Shows variation in TSS concentration in the HWTP Click here to view Figure |
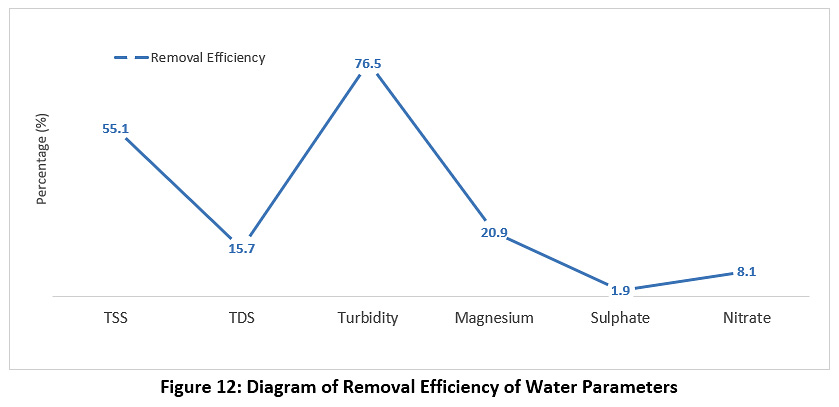 |
Figure 12: Diagram of Removal Efficiency of Water Parameters Click here to view Figure |
Table 3: The Identification of Drinking Water according to WHO and Iraqi Standards6
|
Material |
WHO |
Iraqi Standard |
Water treated by HWTP |
Units |
|
pH |
6.5 - 8.5 |
6.5 - 8.6 |
6.95 |
--- |
|
Turbidity |
5 |
5 |
12.8 |
NTU |
|
TDS |
500 - 1000 |
1500 |
5200 |
mg/l |
|
EC |
1000 |
1000 |
7750 |
µs/cm |
|
TSS |
0 |
0 |
65 |
mg/l |
|
Magnesium |
150 |
150 |
34 |
mg/l |
|
Sulphate |
200 - 400 |
400 |
368 |
mg/l |
|
Nitrate |
50 |
50 |
3.1 |
mg/l |
Discussion
The results show that the treated water has the same properties as the raw water; in other words, the station units under study do not show the expected efficiency for the removal of pollutants. This confirms that the different station units do not perform well. Based on this fact, the station looks like a mere series of water passage units. The quality of the treated water did not change from the water entering the station. The efficiency of the sedimentation basins was 57%, which is very low. It was assumed that the removal efficiency of the sedimentation basins would be between 70-90%, yet it was 57% according to the column sedimentation experiment. This is due to the maintenance of the different units not being performed regularly, as if maintenance is carried out, this requires the station to be stopped. Some breakdowns were also observed, such as scrubbers stopping in the sedimentation basins. The poor performance is also due to the failure to adjust the dose of alum solution added to the rapid mixing basin at a rate of 4 g/m3 and not to be added when the turbidity is less than or equal to 5 NTU or adding the alum solution in the morning operation only. Therefore, water enters the filter unit loaded with high concentrations of suspended pollutants, leading to a decrease in the efficiency of the filters. Additional to this, the filter medium (sand) has not been changed for the last three years, and the washing of filters was not regulated. In addition, it can be seen that the process for killing bacteria is not working in the sterilisation basins, as the water coming out of the filters has a high total number of bacteria (see Figure 6), and therefore the efficiency of the sterilisation basins is very low, ranging from 27 to 50%, when it should be between 90 to 100%. The different units of the station do not perform well. Thus, the overall efficiency of the plant when removing suspended materials is 55.1% (see Figure 12), which is very low, as it is supposed to remove 70-90% of the suspended material in the sediment basins alone.
In addition, the process for adding chemicals is not performed effectively because of the lack of accurate understanding of the mechanism of coagulation and flocculation and a lack of knowledge on the importance of chemical coagulation. This is likely to increase the resistance to the filtration of suspended solids; in other words, the filters have less ability to remove and retain suspended solids. Other problems include the lack of long-term maintenance of the ventilation and sedimentation basins, where lichens were observed floating in sedimentation basins.
Conclusions
It is well known that the purpose of any water treatment plant is to produce healthy water that is safe to drink, palatable and suitable for domestic use, such as for cooking and preparing food. In this study, it was found, by calculating the efficiency of the sedimentation, filtration and sterilisation basins, and the quality of water coming out of the plant (treatment), and comparing this with the WHO and Iraqi standard limitations, that the HWTP does not efficiently treat the water.
Recommendations
- General technical maintenance for all stages of the plant and maintain it from time to time so that the period does not exceed a month at the latest, and ensure the validity of alum and chlorine supplied to the plant and clean the sedimentation basins.
- Providing the plant with a laboratory for physical, chemical and biological tests, and conducting tests of water at all stages of treatment on a daily basis to ensure water production in accordance with international health standards. As well as providing the station with a device to determine the alum dose (Jar Test) to determine the alum doses assessed and the degree of turbidity of the river water.
- Measurement of concentrations of other water quality parameters not measured in this paper e.g. copper, chemical oxygen demand (COD), as well as total organic carbon concentration (TOC).
- Replace the sand of the filter units so that the granular gradient of the sand grains diameters, uniformity coefficient and layer thickness are according to the standard design parameters.
- Researchers recommend bacteriological tests for water.
Authors are highly thankful to Southern Technical University, Basra Engineering Technical College and the Department of Environmental and Pollution Engineering for providing necessary facilities and help during the study.
Funding
The author(s) received no financial support for the research, authorship, and/or publication of this article.
Conflict of Interest
The authors do not have any conflict of interest.
References
- Hamdan, A.N.A. The Assessment of the quality of water treatment plants effluent of Basrah city for Irrigation. Wasit Journal of Engineering Science, 2016; 4(2): 36-52.
- Jackson, R.B., Carpenter, S.R., Dahm, C.N., Mcknight, D.M., Naiman, R.J., Postel, S.L. and Running S.W. Water in a changing world. Ecological Society of America, 2001; 9(1): 1-16.
- Allayla, M. N. Water Liquefaction Engineering Designs. Al-Musel, Iraq: Directorate of Books House for Printing and Publishing, 1980.
- Alamiri, N. J., Ali, I. M. and Almayah, M. A. Assessment of the Quality of Drinking water and the Efficiency of some Purification Plants in the Basrah Governorate. Journal of Biological Chemistry and Environmental Sciences, 2015; 10(1): 316-330.
- Mahmood, T. A. Environmental Science and Technology. Al-Musel University, Iraq: Directorate of Books House for Printing and Publishing, 1988.
- WHO, World Health Organization. Guidelines for Drinking Water Quality. WHO library Geneva, Switzerland: World Health Organization, 2011.
- WHO, World Health Organization. World Health Assembly. WHO library Geneva, Switzerland: World Health Organization, 1986.
- Abdul-Rahman, E.A., Mulood, A.A. and Whran, M.S. Assessment of the quality of drinking water and the efficiency of the water purification plant in Falluja. Iraqi Journal of Civil Engineering, 2009; 6(1): 27-38.
- Ramel, M. M. Evaluating the drinking water quality supplied by the large treatment plant in Ramadi city. Al-Qadisiyah Journal for Engineering Sciences, 2010; 3(2): 33-56.
- khalf, S. H. Aquatic Microbiology. Al-Musel Unversity, Iraq: Directorate of Books House for Printing and Publishing, 1987.
- Aremu, M., Olaofe, O. and Ikokoh, P. a. Physicochemical Characteristics of stream, well and Borehole water sources in Eggon, Nasarawa state. Chemical Society of Nigeria, 2011; 36(1): 131-136.
- Peavy, H.S., Donald, R.R. and Tchobanoglous, G. Environmental Engineering, fourth edition. Mc Graw Hill, 1985.
- El-Khordagui, H. K. and Mancy, K. H. Formation of trihalomethanes during disinfection of drinking water. Egypt: proc. International symp. On management of Industrial wastewater in developing nations, 1981.
- Al Khaldi, S.K., Al Zafiri, M.E. and Hamza, H.A. (2010). Evaluation of the efficiency of some drinking water treatment plants in Najaf / Iraq. Journal of University of Babylon, 2010; 18(2): 34 - 49.
- Saleh, R.A., Edaan, I.G. and Abdul Wahed, A.K. Evaluation the efficiency of gas Al-Shamal water treatment plant. Diyala Journal of Engineering Sciences, 2015; 8(1): 1-12.
- Shaheen, K. Evaluation study for water treatment in Mosul liquefied water station, Al - Qubbah project. Al Techani Journal, 2004; 17(3): 365-381.
- Al Sadeq, M.H., Ibraheem, D.A., Ahmed, O.M. and Abdul Wahd, S.A. Assessing the efficiency and quality of Al Wahda water treatment plant. 2016, Baghdad: Iraqi Ministry of Environment, p.p 57-66, series no. 18.
- Hassan, Fikrar M., Mahmood, Ansam R. Evaluate the Efficiency of Drinking water treatment plants in Baghdad City - Iraq. Journal of Applied and Environmental Microbiology, 2018; 6(1) : 1-9.
- Wesal, F. H., Iqbal F. H. and Jasim, A.H. The effect of industrial effluents polluting water near their discharging in Basrah Governorate /Iraq. Journal of Basrah Researches sciences, 2011; 37(1): 42-53.
- APHA. Standard Methods for the Examination of Water and Wastewater, twentieth edition. Washington, D. C., USA: American Public Health Association, 1998.
- Ahmed, E.A. Environmental Engineering, fifth edition. Engineering college, Sultan Qaboos University, Oman: Al-Mustakbal company, pp. 261-289, 1995.
- Steel, E.W. and Mcghee, T.J. Water Supply and Sewerage. New Yourk, U.S.A.: McGraw Hill Education Europe, pp. 234-267, 1979.


