A Study of Availability and Utilization of Water Resources in Punjab
B S Sidhu 1
*
 , Rakesh Sharda 2
and Sandeep Singh 1
, Rakesh Sharda 2
and Sandeep Singh 1
1
Department of Civil Engineering,
Chandigarh University,
Gharaun SAS Nagar,
Punjab,
India
2
Department of Soil and Water Engineering,
PAU,
Ludhiana,
Punjab
India
http://dx.doi.org/10.12944/CWE.15.3.18
While water is renewable, only a finite amount of it is available. Rapid urbanization, industrial development, and growth in food demand contribute to the shortage of freshwater in many countries. The limited availability of surface water and its uneven distribution in time and space has increased the dependence on groundwater (GW) in Punjab. Its irrigation development is characterized by excessive extraction of GW to meet the crop water requirements for ensuring the country’s self-reliance in food. GW development guided by populist political pronouncements has contributed to serious environmental and ecological concerns. The paper, using the GW resource estimation methodology-2015, assesses the net annual replenish able GW availability (21.58 billion cubic meters) and GW extraction (35.78 billion cubic meters), and thus a stage of GW extraction of 166%. It analyses the impact of continuous GW mining on the long-term behaviour of water table. Considering the declining availability of surface water under climate change, it is a high time to study the emerging GW scenario more scientifically and prescribe a policy framework for the future.
Copy the following to cite this article:
Sidhu B. S, Sharda R, Singh S. A Study of Availability and Utilization of Water Resources in Punjab. Curr World Environ 2020;15(3). DOI:http://dx.doi.org/10.12944/CWE.15.3.18
Copy the following to cite this URL:
Sidhu B. S, Sharda R, Singh S. A Study of Availability and Utilization of Water Resources in Punjab. Curr World Environ 2020;15(3). Available From : https://bit.ly/33tXglZ
Download article (pdf)
Citation Manager
Publish History

Introduction
Water plays a crucial role in the creation of everything we produce. While it is renewable, there is only a finite amount of it, and there are no substitutes. The competition for this finite and vulnerable resource is continuously expanding, and so is the demand for it. Today the potential water scarcity, mainly population-driven, is the concern of everyone due to increasing water demands and their consequent effect on our food and energy production. Climate change can alter and shift the shape of the entire probability distribution of hydrologic events in the future and thereby the demand for water1.
The present unsustainable and inequitable use of water in many countries is fraught with enormously grave physical and social consequences2. For optimal use of water, it is imperative to adopt integrated water resources management (IWRM), "the coordinated development and management of water, land and related resources, to maximize the resultant economic and social welfare in an equitable manner, without compromising the sustainability of vital ecosystems."3
Due to the introduction of canal and tubewell irrigation, coupled with other agricultural production boosting management practices, Punjab became the granary of India and witnessed an all-round development during the last 50 years. The most important historical antecedent of the current situation of agriculture in the state is the 'Green Revolution.' In the face of a serious national food deficit, the state posted an unprecedented rise in wheat productivity, doubling the production in a short span of three years (1966-67 to 1968-69). Several features of the state's agriculture, including high cropping intensity (204%), more than 99% irrigated area, and 100% adoption of high yielding varieties of crops reveal an intensive agricultural system4. Productivity has risen as a result of continuous genetic up-gradation and matching refinements in crop production-protection technology. The productivity levels of about 11.5 t/ha (5173 kg/ha for wheat and 6531 kg/ha for non-basmati paddy) in 2018-194 are among the highest in the world. Production of 18% wheat and12% rice of the country from 1.53% of its geographical area or in absolute terms, about 190 lakh MT of paddy and 180 lakh MT of wheat in 2018-194 speaks high of State agriculture. The new technologies have also made space for a non-traditional crop like rice and created an input-intensive model of agriculture whose ill effects have also built up over time. The monoculture of the rice-wheat cropping system is contributing to the degradation of natural resources, i.e., air (pollution due to stubble burning), soil (depleting fertility), and water (declining water table).
Known as a land of five rivers, Punjab forms a part of the Indus River basin, one of the most prolific groundwater reservoirs on this planet. After partition, as per Indus Water Treaty, the waters of the river Ravi, Sutlej, and Beas were allocated to India5. The available river water was further apportioned at the time of the division of Punjab during 1966 when a new state of Haryana was carved out. As per Section 78 of the Reorganization Act of 1966, Haryana, as a successor state, got the right to receive and to utilize water available from Bhakra Nangal and Beas projects. Punjab received about 14.4 BCM of surface water from these rivers during 2017. Some surface water is available downstream Bhakra Dam during monsoon in Swan and Sarsa and Chakki rivers. There are 14 minor dams with a storage capacity of 32.34 MCM, located in the kandi area6. The average annual rainfall for 2000-17 has been worked out about 445mm7 and the variation is represented in Figure 1. This average rainfall ensures an average water availability of 22.6 BCM.
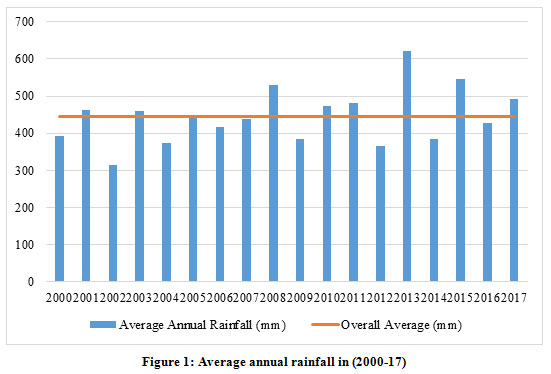 |
Figure 1: Average annual rainfall in (2000-17) |
Groundwater is the most important source of water to meet the demand of different sectors of the economy. The groundwater level in the state varies from almost near-surface in waterlogged areas in the southwest to about 60 meters below ground level (mbgl). in the Kandi belt. In other parts of the state, the water table varies from approximately 3 to 40 mbgl, and it slopes towards the southwest. The quality of groundwater varies significantly, and the variation is more marked in the southwest zone. Shallow tubewells are the most common groundwater structures which tap granular horizons available at shallow depths and generally yield between 12 and 20 liters per second. These have an annual draft varying from 0.3 to 3 ham and are capable of commanding 1 to 3 hectares of land per tubewell. The number of tubewells in the state has gone up from 0.19 million1980 to 1.47 million in 2017-184. Due to the availability of free power, nearly 73 percent of the net sown area is irrigated by tubewells4. The salient issue which demands urgent attention is groundwater depletion, which is evident from continued water table decline due to continuous increase in area under paddy as well as the number of tubewells.
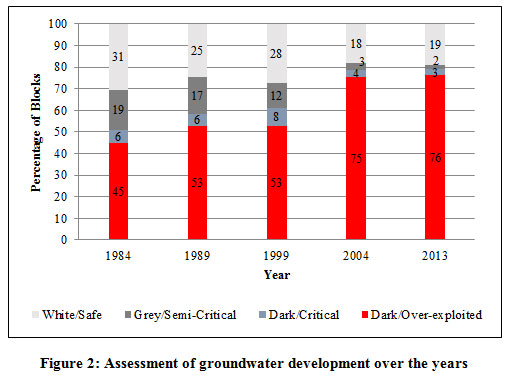 |
Figure 2: Assessment of groundwater development over the years |
The block-wise assessment of the availability of groundwater in the state is carried out almost once in every four years, and based on the quantity of groundwater extracted; an assessment unit is termed as (a) Safe if the stage of groundwater extraction is less than 70%; (b) Semi-Critical if it is > 70%and ≤90%; (c) Critical if it is > 90%and ≤100%; and (d) Over Exploited if it is more than 100%. The unabated groundwater extraction over the years has contributed to an increase in the number of overexploited blocks from 45% in 1984 to 76% in 20137 as depicted in Figure 2. The increase in the percentage of over-exploited blocks in the state (Figure 2) also indicates the increase in the extent of the area with high groundwater extraction. As the availability of surface water is limited to the allocation under various agreements, groundwater extraction has been on the rise due to the continuous growth of demand for irrigation water for crop production and other sectors of the economy.
Thus, a precise quantitative assessment of the available water resources, both surface water and GW, and their current status of utilization is necessary for their sustainable development and management. The Groundwater Estimation Committee in 2015 (GEC-15)8 suggested some changes in estimation methodology and the important suggestions are to (a) demarcate aquifer geometry on an appropriate scale for delineating the groundwater assessment units; (b) assess GW resource to a depth of 300 m in alluvial areas till the completion of aquifer mapping; (c) estimate the replenishable and in-storage GW resource for both unconfined and confined aquifers; (d) use refined norms for rainfall infiltration factor, specific yield, return flow from irrigation, and recharge due to canals; (e) use GW level trends only for validation of the estimates; (f) add a quality flag to the assessment unit for salinity, arsenic, and fluoride content; and (g) estimate GW resource once in three years in view of the rapid changes in groundwater extraction.
The present study attempts to assess water resources availability based on GEC-15 methodology in Punjab and estimate the current level of their utilization so as to plan their sustainable usage in domestic, industrial, and agricultural sectors because it is of utmost importance to make efficient and optimal use of available water resources to maintain the dynamic equilibrium of the groundwater reservoir over time.
Study Area
The Punjab, which is one of the North-Western States of India, covers an area of 50,362 km2 and falls between latitude 29º30' N to 32º32' N and longitude 73º55' E to 76º50'E (Figure 3). Administratively, the state comprises 22 districts, 145 development blocks, and 12376 villages, which are all connected by metaled roads, and all the houses in villages have electricity4. The contour lines (Figure 3) indicate that the slope of the plain is towards the South and South West, which seldom exceeds 0.4 m/km. The state has a thin mountainous belt in the north-east, a flat alluvial plain in the middle, and stable dunes at some places in the southwest. Thus, it can be safely divided into three distinct physiographic zones, namely, the Sub-mountainous zone, Central zone, and South-western zone, whose salient features are given in Table 1. These zones were formulated by Punjab Agricultural University, Ludhiana based on cropping pattern, rainfall, soil texture, soil quality, underground water, temperature, humidity 9.
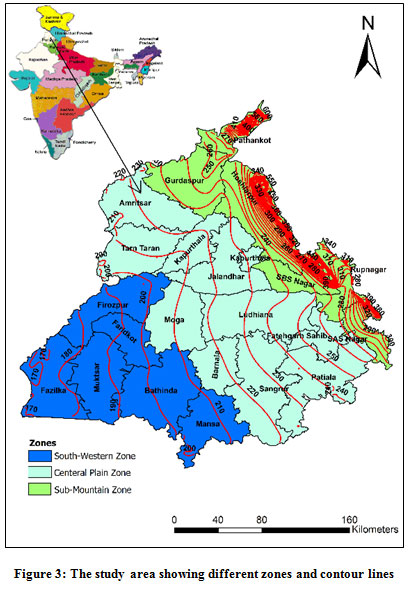 |
Figure 3: The study area showing different zones and contour lines Click here to view figure |
Table 1: Characteristics of different zones of Punjab
|
Zone |
Area (000 ha) |
Soil Type |
Rainfall (mm) |
Districts |
Remarks |
|
Sub-mountainous Zone |
1063 |
Clay, Clay loam |
1150 |
Gurdaspur, Pathankot, Rupnagar, Hoshiarpur, SBS Nagar, SAS Nagar |
Sub-humid Zone |
|
Central Plain Zone |
2481 |
Loam |
650 |
Amritsar, Barnala, Moga, Fatehgarh Sahib, Jalandhar, Kapurthala, Patiala, Sangrur Tarntaran, Ludhiana, |
Semi-arid zone |
|
South-Western Zone |
1492 |
Sandy loam, loamy sand |
375 |
Bathinda, Ferozpur, Fazilka, Faridkot, Mukatsar, Mansa |
Arid zone |
Geologically, the sub-mountainous areas consist of piedmont deposits comprising Kandi and Sirowal. The Kandi is a 10 to 15 km wide belt in the southwest of hills, which is underlain by an admixture of various grades of boulders to clays, at places in different proportions. It is followed by Sirowal, which generally comprises of finer sediments with the occurrence of gravel beds occasionally. This zone subtly merges with the alluvial plain, which comprises of sand, silt, and clays mixed with kankar at some places. In the Sirowal zone, the aquifers consist of saturated sand, gravel, or boulder beds. In the alluvial plain, sandy zones of varying grade occur, forming a vast groundwater reservoir whose hydraulic conductivity varies from 10 m/day and 90 m/day and specific yield from 0.08 and 0.17. For other parts of the state, the range for hydraulic conductivity is 4 m/day to 25 m/day and a specific yield from 0.05 to 0.16 9.
Materials and Method
Data and Its Sources
For carrying out a groundwater estimation of the state, the daily rainfall data, minimum and maximum temperature, relative humidity, and bright sunshine hours for weather stations located within the study area were collected from the Indian Meteorological Department and Punjab Agricultural University, Ludhiana (PAU). The consumptive water and irrigation requirements of various crops were used from various research experiments conducted by PAU. Data for monthly releases into the canals and their distributaries and monthly days of running were collected from the Bhakra Beas Management Board and Department of Water Resources, Punjab. The information about the lined and unlined length of different canal reaches and distributaries was collected from Irrigation Branch to work out the seepage losses from the canal system. The area of water spread and the number of ponds and tanks block-wise was collected from the Department of Rural Development and Panchayats, Punjab. The land use and cropping pattern data, data of observation wells and their locations along with water levels for June and October, and the unit draft of different groundwater structures based on sample surveys were collected from the Department of Agriculture and Farmers Welfare, Punjab. Data regarding the storage coefficient and transmissivity were compiled from various studies, and pump tests carried out by CGWB and other organizations in the state.
Table 2: Various factors adopted for estimation of groundwater resources in Punjab
|
Parameter |
Norm adopted for groundwater estimation |
||||
|
Specific yield |
12% |
||||
|
Rainfall infiltration |
22% |
||||
|
Canal seepage |
for un-lined canals: 17.5 ha m/day/million m2 for lined canals: 3.5 ha m/day/million m2 |
||||
|
Seepage from tanks and ponds |
1.4 mm / day |
||||
|
Seepage from structures constructed for water conservation |
40% of yearly gross storage; half each during monsoon and non-monsoon period |
||||
|
Domestic draft |
@ 100 lpd and also includes demand for the next 25 years. A groundwater dependency factor of 0.8 is considered for the estimation of the total requirement. |
||||
|
Natural Discharge |
5% while using the water table fluctuation method and 10% in case of the rainfall infiltration factor method |
||||
|
Annual draft of tubewells |
Electric (ham) |
Diesel (ham) |
|||
|
Amritsar,TarnTaran Gurdaspur, Pathankot |
2.0 - 2.9 |
1.2 - 2.0 |
|||
|
Jalandhar, Kapurthala |
2.0 - 4.0 |
0.8 - 1.7 |
|||
|
SBS Nagar, Hoshiarpur |
1.0 - 3.0 |
0.8 - 1.0 |
|||
|
Rupnagar, SAS Nagar |
1.0 - 3.3 |
0.7 - 1.4 |
|||
|
Patiala,FGSahib,Sangrur, Barnala, Mansa |
2.4 - 4.3 |
0.8 - 2.8 |
|||
|
Ludhiana, Moga, Bhatinda |
2.4 - 3.9 |
1.2 - 2.2 |
|||
|
Ferozepur, Fazilka, Faridkot |
2.6 - 3.5 |
1.2 - 2.5 |
|||
|
Muktsar |
2.2 |
1.5 |
|||
|
Irrigation return flow |
Ground Water |
Surface water |
|||
|
Rice field |
Non-Rice field |
Rice field |
Non-Rice field |
||
|
<=10 |
45.0 |
25.0 |
50.0 |
30.0 |
|
|
13 |
40.0 |
21.0 |
45.0 |
26.0 |
|
|
16 |
35.0 |
17.0 |
40.0 |
22.0 |
|
|
19 |
30.0 |
13.0 |
35.0 |
18.0 |
|
|
22 |
25.0 |
97.7 |
30.0 |
14.0 |
|
|
>=25 |
20.0 |
5.00 |
25.0 |
10.0 |
|
Estimation Norms
The GEC-15 has recommended to estimate the GW recharge, both by specific yield and water level fluctuation methods as these approaches relate the behaviour of GW levels to GW input and output components. Water level data for the pre- and post-monsoon seasons for four years has been considered for estimation of the water balance of each assessment unit. Groundwater resources have been estimated by adopting various factors given in Table 2.
Methodology
As the aquifer geometry is yet to be mapped properly, the revised methodology suggested by GEC-15 has been used for aquifer-wise assessment of both the dynamic and in-storage GW quantity up to a depth of 300 m. ​​​​​​​
Assessment of dynamic GW resource
The water balance equation for an assessment unit is as follows:
Change in Storage = Inflow – Outflow (for an aquifer) ...Eq. (1)
∆S = RRF + RSTR + RC + RSWI + RGWI + RTP + RWCS ±VF ±LF–E–T–B–GE ...Eq. (2)
Where ∆S is the change in storage, RRF the recharge from rainfall, RSTR the recharge from streams and channels, Rc the recharge due to seepage from canals, RSWI the recharge due to return flow from surface water irrigation, RGWI the recharge due to return flow from groundwater irrigation, RTP the recharge due to deep percolation from tanks and ponds, RWCS the recharge due to seepage from water conservation structures, VF the vertical flow across the aquifer system, LF the through-flow (lateral flow along with the aquifer system), E the evaporation, T the transpiration, B the base flow, and GE the groundwater draft or extraction. However, for the present study, the methodology suggested by GEC-15 has been adopted which assumes that
- The Lateral Flow (LF) along the aquifer system has not been considered due to the non-availability of such estimates in the absence of proper mapping of aquifer geometry.
- Across the boundary of the assessment unit, the inflow and outflow are assumed to balance each other the aquifers encountered are mostly unconfined and the GW in the state has an almost uniform gradient.
- Baseflow and Stream recharge have also not been considered for want of authentic data of stream gauge stations and absence of reliable numerical modeling and Analytical solutions.
- Vertical Flow from hydraulically connected aquifers has also been ignored for the time being as the aquifer geometry and other parameters are not known at present.
- Evaporation loss for areas with a water level depth of more than 1.0 mbgl. has been taken as zero as water loss from such aquifers due to capillary rise is negligible. Transpiration varies from place to place depending on the type of soil and vegetation but as recommended by GEC-15, it has to be considered as zero in areas with depth to water table more than 3.5 mbgl.
Following these assumptions, equation 3 can be simplified as
∆S = RRF + RSTR + RC + RSWI + RGWI + RTP + RWCS – GE ...Eq. (3)
The monsoon season groundwater recharge can be estimated based on the water level fluctuations (WLF) method and by rainfall infiltration factor (RIF) method. The RIF method has been used to estimate the rainfall recharge during the non-monsoon period, only when the rainfall during the non-monsoon season has been more than 10% of average annual rainfall. The recharge from other sources viz. seepage from canals, return-flow from surface and groundwater irrigation, deep percolation from ponds and tanks, and seepage from water conservation structures have been worked out. Since the data for natural discharge for the assessment units are not available, an allocation for unaccountable natural discharges @ 10% of annual recharge has been made. Balance 90% has been taken as Annual Extractable Groundwater Resources (EGR).​​​​​​​
Estimation of GW Draft
As recommended by GEC-15, the Unit Draft Method has been used for the assessment of a draft of groundwater structures. The Season-wise unit draft of a sample of groundwater irrigation structures in 22 assessment units in the state was measured in the field. The average unit draft for each type of structure was worked out keeping in view the prevailing cropping pattern, and season-wise, groundwater extraction has been assessed by multiplication of average unit draft with the number of structures of each type. For estimation of domestic consumption, water consumption per capita, expressed in liters per capita per day (lpcd), has been multiplied with the population of the assessment unit and fraction of domestic supply load on groundwater (Lg). The industrial use has been worked out by multiplication of unit draft of each type of groundwater structure used for industrial purposes with their number.​​​​​​​
Computation of Stage of GW Extraction
The current groundwater use for domestic, industrial, irrigation, and other purposes is the gross groundwater draft. The stage of groundwater extraction has been estimated as follows:

​Assessment of potential GW Resource
The groundwater available up to 5 mbgl in areas with shallow groundwater levels or in waterlogged areas is also a potential resource available for development, in addition to the gross annual recharge, Potential additional resource in such areas has been computed as follows:
Potential groundwater resource = (5-D)*A*SY ...Eq. (5)
Where D is the depth to water table (mbgl) in shallow aquifers in the pre-monsoon period, A the area of the assessment unit with the shallow water table, and SY the aquifers' specific yield.​​​​​​​
Estimation of In-storage GW Resource
As per GEC-2015 recommendation for soft-rock areas, in-storage groundwater resources or static groundwater resources of aquifers up to 300 m have been estimated as under:
SGWR = (Z2 - Z1)*S*A ...Eq. (6)
Where SGWR is the Static Groundwater Resource in the aquifer, Z1 the pre-monsoon water level, Z2 depth to the unconfined aquifer bottom, SY the specific yield of the shallow water table zone, and A the area of the unit for assessment.
Results and Discussion
Estimation of Net GW Availability
The assessment of groundwater resources of Punjab has been done as per the GEC-15 methodology for all the districts have been calculated and indicated in Annexure-1. The Average Normal Recharge from rainfall and other sources for 138 development blocks for the year 2017 has been worked out and compiled to get district-wise and zone-wise GW availability and is given in Annexure-1. The Net Annual GW availability for the state has been assessed as e 21, 58,498 Ham (21.58 BCM). ​​​​​​​
Assessment of Dynamic GW Resource
The GW use for 138 development blocks for the year 2017 has been worked out based on GEC-15 methodology and compiled to get district-wise and zone-wise GW availability and is given in Annexure-II. The total GW extraction for all purposes has been worked out to be 35,78,236 Ham (35.78 BCM). The current total groundwater extraction for all purposes has been observed to be maximum in Sangrur district as 3,68,502 Ham and minimum in Pathankot district as 18,742 Ham. It can be observed that there is no scope for the development of groundwater in the state for future irrigation except some in Safe, Semi-critical, critical, and in waterlogged areas where it has been assessed as 1,17,000 Ham (1.17 BCM).​​​​​​​
Stage of GW Extraction
The district-wise stage of groundwater extraction has been computed as per equation (4) and given in Annexure-II. The overall stage of groundwater extraction for the state is 166%. It ranges from 74% to 260 % in Muktsar and Sangrur districts, respectively. The zone-wise analysis indicates that in the central zone, i.e., the rice belt of the state, the stage of development is more than 200%. The cumulative groundwater extraction in the south-western zone (123%) is almost the same as that of the northern zone (119%) because of low rainfall and shift of area from cotton to paddy despite more surface water availability and marginal quality of groundwater. Due to the increasing area under paddy, the farmers are installing more and more shallow tubewells to skim the fresh groundwater layer floating over brackish water, formed due to return flow from irrigation.
The perusal of district-wise availability and extraction of GW(Annexure-II) indicates that only Bhatinda and Muktsar districts have a favourable net groundwater availability for future irrigation development. Out of 138 assessment units (development blocks) covered, only 22 can be categorized as 'Safe.' Of the remaining, 5 are 'Semi-Critical,' 2 'Critical,' and 109 'Over-Exploited.' The current unabated groundwater extraction has contributed to an increase in the number of overexploited blocks from 45% in 1984 (Figure-2) to 79% during 2017 in the last three decades.​​​​​​​
Potential GW Resource
There is an area of about 5477 km2 in the south-western districts of the state, which has a water table depth less than 5 mbgl. The potential GW resource for these areas has been worked out using equation (5), which indicates an additional potential of 8705 ha-m for GW recharge, with maximum potential in the Muktsar district. ​​​​​​​
In-storage GW Resource
As per the data collected under the National Project on Aquifer Management (NAQUIM) scheme, the aquifer maps have been prepared up to 300 m depth to identify and delineate existing aquifers. The in-storage groundwater resources of these aquifers have been estimated as recommended by GEC-2015 using equation (6) and in-storage groundwater Resources for Aquifer I (up to 100m depth) is 171.53 BCM, Aquifer II (100-200m depth) is 75.83 BCM and Aquifer III (up to 300m depth) is 51.76 BCM. The gross in-storage GW resource of all the aquifers up to the depth of 300 m works out to be 299.12 BCM.​​​​​​​
Utilization of Available Water Resources
Total groundwater withdrawal in the state is 35.78 BCM, out of which 1.22 BCM is for domestic and industrial use, and 34.56 BCM is for meeting crop water requirements. The net annual replenishable groundwater availability is 21.58 BCM, thereby leaving an annual groundwater deficit of 14.71 BCM.As the availability of surface water is limited to the allocation under various agreements, groundwater extraction has been on the rise due to the continuous growth of demand of domestic and industrial sectors and irrigation water for crop production. The total water requirement for irrigation, as per State Irrigation Plan (SIP)6 has been estimated as 62.6 BCM (Annexure-III) and including the water demand of 2.3 BCM for domestic and other purposes as per SIP [10], the annual water use of about 65 BCM has been assessed. The total available water resources including groundwater draft of 34.56 BCM are 60.56 BCM of (surface water from the dams across three rivers 14.41 BCM, the surface water available downstream of dams 4.01 BCM, the surface water from rainfall 6.78 BCM (~30% of about 445 mm rainfall), and the treated water from Sewage Treatment Plants 0.8 BCM). A gap of 4.5 BCM between demand and availability is left unexplained which is probably met due to better utilization of rainwater as (i) during the rainy season, the major crop of the state is paddy which occupies about 3 million ha (75%) of the cropped area and most of the rainwater is retained in the rice fields; and (ii) winter rains, being of low intensity, cause minimal runoff.
The current scenario of groundwater depletion has developed over time due to a significant shift in the cropping pattern towards paddy from low water consuming crops irrespective of the soil conditions. Further, the increase in net irrigated area (almost 100 percent in 2017) and the cropping intensity (204 percent), coupled with free power for agriculture, have led to an increase in groundwater irrigation, and thereby an increase in groundwater extraction over the years. The decline in average annual rainfall (445 mm during 2000-17 as compared to a long-term average of 606 mm during 1970–1999), and its distribution (from storms of short duration and high intensity which generate more runoff as compared to long duration and low-intensity storms earlier which induced more percolation), are resulting in decreased natural recharge and increased water table decline. Consequently, the farmers are drilling deeper in desperation, and investment in the maintenance of irrigation infrastructure is increasing, and they are getting into the debt trap.​​​​​​​
Long-Term Behaviour of Water Table
The state government enacted the 'Punjab Preservation of Sub-soil Water Act' in 200910, after an encouraging response by farmers to an 'Ordinance' of similar name issued in 2008, which prohibited the transplanting of paddy before a notified date. Major regulatory interventions in 2008 and 2014 under the Act were notification of prohibiting transplanting of rice before 10th June and 15th June, respectively to reduce unproductive evaporation. To assess the impact of this Act in water use in rice production, water footprint assessment for rice has been worked out as per methodology laid out in 'the Water Footprint Assessment Manual' 11 for two intervals of eight years each before and after implementation of the Act, i.e. 2000-2007 and 2010-2017. 'Green water footprint', which describes the amount of water used from precipitation, and 'blue water footprint', which depicts the surface and groundwater use for irrigation, have been worked out using CROPWAT 8.0 software12. The weather parameters for Ludhiana (30° 55' N, 75° 54' E) were collected from Punjab Agricultural University, Ludhiana and the area of rice transplanted on different dates in different years from the Department of Agriculture and Farmers Welfare. For this study, the soil type has been taken as sandy loam as this class dominates central Punjab, the main rice-growing area in the state. The average water footprints for rice production are given in Table. The reduction in the blue water footprint for rice production from 1833 liter/kg during 2000-07 to 1522 liter/kg during 2010-17 (Table 3) indicates that the use of surface and groundwater for irrigation has come down by 311 liters/kg or 906 m3/ha. These results corroborate the outcome of earlier studies on the subject13 14.
Though it helped in reducing the rate of depletion of the water table, it is still declining, and the area under higher depth to the water table is increasing. A comparison of depth to water level maps for the years 1990 and 2017 (Figure-3) brings out that the area having a water level of more than 10 m deep was 20% in 1990 and has increased to more than 70% in 2017 (Table 4).
Table 3: The consumptive water footprint of rice in Punjab
|
Description |
Units |
Period |
|
|
2000-07 |
2010-17 |
||
|
Average effective rainfall |
m3/ha |
2897 |
3146 |
|
Av. crop evapo-transpiration |
m3/ha |
6839 |
6054 |
|
Average area under rice |
'000' ha |
2596 |
2916 |
|
The average productivity of rice |
kg/ha |
3743 |
3983 |
|
Green Water Footprint |
litres/kg |
774 |
795 |
|
Blue Water Footprint |
litres/kg |
1833 |
1522 |
|
Consumptive Water Footprint |
litres/kg |
2607 |
2317 |
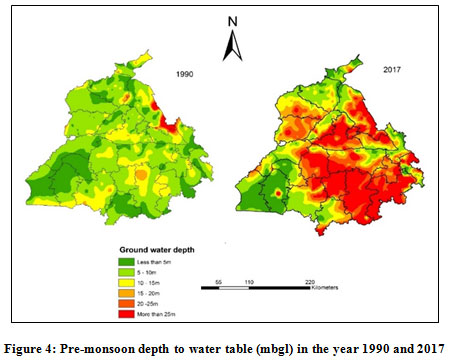 |
Figure 4: Pre-monsoon depth to water table (mbgl) in the year 1990 and 2017 Click here to view figure |
Table 4: Area under different groundwater depth in Punjab
|
Groundwater depth |
June 1990 |
June 2017 |
|
Less than 5m |
11531 |
5911 |
|
5 to 10m |
28242 |
8917 |
|
10 to 15m |
9163 |
7524 |
|
15 to 20m |
793 |
7496 |
|
More than 20m |
633 |
20513 |
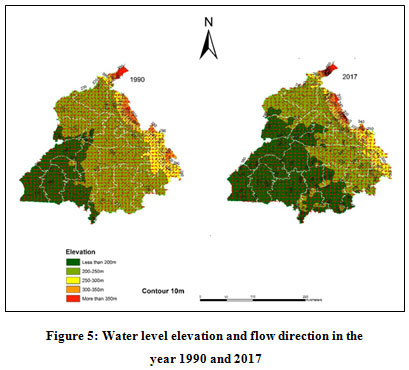 |
Figure 5: Water level elevation and flow direction in the year 1990 and 2017 Click here to view figure |
Depleting groundwater trends have led to the designation of the majority of blocks in the state, i.e.,79% as overexploited in 2017 as compared to 45%in 1984. At present, more than 40% area of the state has a depth to the water table higher than 20m. The slope of the water level has been following the natural slope from the north and northeast to the west and southwest. The Water level elevation in meters above mean sea level (mamsl) and flow direction in the years 1990 and 2017 have been plotted in Figure-3 which indicates the development of GW depression cones in areas with high over-exploitation. The consequent change in the hydraulic gradient is increasing with time and has started reversing the direction of groundwater flow (Figure 5) and the chances of a flow of brackish groundwater from southwest to the central zone are also increasing.
Conclusion and Recommendations
The analysis of the present status of availability of water resources in the state and their utilization indicates that the availability is far lower than the demand, and over-dependence on groundwater is contributing to its excessive use. The stage of groundwater extraction is 166% in the state and is even more than 200% in some districts. There is a continuous decline of the water table in the state in general and in the central zone in particular, i.e., in areas underlain with fresh groundwater, which are the ‘food bowl’ of the country. The number of over-exploited blocks in 2017 has further increased as compared to the last assessment in 2013 from 105 to 109 and area Consequently, the area of the state having depth to water table more than 15 m has increased from negligible (3%) in 1990 to more than half the state (55%) in 2017. So, for optimal use of available water supplies in the state, the narrative must change from 'more crop per drop' to 'better nutrition per drop' to 'more jobs per drop,' and to 'better environment per drop' 1. To efficiently manage the water resources of Punjab, suitable measures both for the augmentation of the available water supplies and the reduction in demand using water-saving technologies will have to be taken. To ensure the long-term sustainability of water resources in Punjab, it is recommended to:
- Diversify at least 15% of the paddy area to less water consuming alternate Kharif crops like cotton, maize, groundnut. As paddy is a major summer crop of the state, proper irrigation The water resources in the state of Punjab can be managed by saving irrigation water using water-saving techniques and by augmenting the GW resources through artificial recharge techniques. scheduling, use of alternate wetting and drying irrigation, change in crop calendar by shifting the transplanting to the third week of June. An increase in dike height in fields for maximum rainfall conservation in paddy can also contribute to reducing the crop water demand. Emphasis should be given on growing basmati and short-duration varieties of paddy, which have a lower water requirement.
- Propagate efficient water use management in all sectors of the economy. Water-saving technologies for improving irrigation efficiency, including lining canals, distributaries, minors, and watercourses, need to be promoted. The conveyance losses in field channels can also be avoided by using underground pipeline systems. The application efficiency of irrigation water can be increased by the selection of an appropriate irrigation method depending on soil type and crop. The replacement of flood irrigation with furrow irrigation or furrow irrigated raised bed planting, adoption of minimum tillage techniques, selection of optimum plot size depending upon stream size, field slope, and soil type, use of precision laser land leveling, and adoption of sprinkler and drip irrigation systems hold a high promise to improve efficiency and reduce water demand for agriculture.
- Adopt techniques for augmenting groundwater recharge on a large scale. For this purpose, the Kandi area, which experiences an average annual rainfall of 1,000 mm or more, should be used to recharge groundwater by constructing water harvesting structures on natural streams. The possibilities of improving aquifer recharge with surplus rainwater during the season through spreading should be explored. The existing surface drainage network can also be used to substantially increase the groundwater recharge by the construction of a series of check structures or recharge shafts for using surface runoff due to rainfall. Rooftop rainwater harvesting should also be tapped for the artificial recharge of aquifers in rural and urban areas. A program to renovate village ponds to provide irrigation to the nearby fields will also help in reducing the groundwater withdrawals.
- Groundwater resource estimation based on GEC-15 should be reviewed considering the hydrogeological intricacies and the groundwater dynamics usually occurring in the field. The micro-level assessments based on detailed field estimations of various recharge and discharge parameters must follow such quantification. Over-exploited and critical areas and areas with quality problems should be taken up as a priority. Further, various components of water balance equation like baseflow, evaporation, and evapotranspiration, outflow, and inflow through the assessment boundary, which have been ignored due to the non-availability of data at present, should be evaluated during the micro-level assessment to make a holistic assessment of water balance of the assessment unit. The diversity in geomorphology, hydrogeology, and agro-climatic conditions existing at the macro level should be addressed by refining the norms of various recharge parameters based on the outcome of the studies on recharge estimation using isotope studies, soil moisture budgeting, water balance studies, and mathematical modeling.
- For realistic estimation of water resources, efforts should be made to strengthen the database about rainfall, groundwater levels, canal discharge, and baseflow through intensive monitoring and pilot studies on the parameters like specific yield, canal seepage, rainfall infiltration, and return flow from irrigation.
- In the areas with high over-exploitation viz. Sangrur, Barnala, Moga, and Jullundur districts, where the water level decline does not match the groundwater extraction, exploratory drilling to delineate the multi-layered aquifer systems and pump tests to determine their sustainable yield should be carried out. There effect of the reversal of flow direction on the availability and quality of groundwater in these areas should be studied.
The state has already taken some initiatives, like regulation of paddy transplanting, promotion of crop diversification; augmentation of groundwater recharge; promotion of micro-irrigation and underground pipeline systems by providing capital subsidy; and capacity building of various stakeholders. Nevertheless, the 'business as usual' state of agricultural water management in Punjab continues to be a cause of serious concern and the policymakers should re-look, rethink, and potentially try to achieve a paradigm shift in groundwater withdrawal and water management policies for sustainable water utilization in future.
References
- Cosgrove W. J., and Loucks D. P. Water management: Current and future challenges and research directions. Water Resources Research, 2015; 51(6) 4823-4839.
CrossRef - United Nations World Water Assessment Programme (UN WWAP), The United Nations World Water Development, in Water in a Changing World, 2009, Rep. 3, Earthscan, London, U. K, pp. 380.
- Global Water Partnership (GWP) (2000), Integrated water resources management, Tech. Advis. Comm. Background Pap. 4, Global Water Partnership, Stockholm.
- Economic and Statistical Organization. Statistical Abstracts of Punjab. Various Issues-1970, 1992, 2013,2019. Government of Punjab.
- Ali Raza Kalair, Naeem Abas, Qadeer Ul Hasan, Esmat Kalair, Anam Kalair, Nasrullah Khan, 2019. Water, energy and food nexus of Indus Water Treaty: Water governance, Water-Energy Nexus, Volume 2, Issue 1, 2019, Pages 10- 24. doi.org/10.1016/j.wen.2019.04.001.
CrossRef - "State Irrigation Plan Punjab". Department of Agriculture and Farmers Welfare, Government of Punjab, 2017, pp72. Available at https://pmksy.gov.in/mis/rptDIPDocConsolidate.aspx
- Ground Water Resources of Punjab State (as on 31st March,2017). Central Ground Water Board (NWR), and Water Resources and Environment Directorate, Punjab, 2018. pp104
- Groundwater Resource Estimation Methodology - 2015. Report of the Ground Water Resource Estimation Committee (GEC-2015), Ministry of Water Resources, River Development & Ganga Rejuvenation, Government of India, New Delhi, October 2017, 137 p.
- Department of Soil and Water Engineering. Optimization of Ground Water Utilization. A Compilation of Research Conducted Under AICRP Optimization of Ground Water Utilization Through Wells and Pumps During 1982–1992; Punjab Agricultural University: Ludhiana, 1993
- The Punjab Preservation of Sub-Soil Water Act, 2009. Punjab Act No. 6 of 2009. Available online: http://agripb.gov.in/abt_deptt/pdf/Pb%20preservation%20of%20Subsoil%20Act,2009.pdf (accessed on 28 October, 2020)
- Hoekstra A.Y., Chapagain A.K., Aldaya M.M., Mekonnen M.M.2011. The Water Footprint Assessment Manual: Setting the Global Standard (Earthscan, London), 2011.
- Allen R.G., Pereira L.S., Raes D. and Smith M. (1998). Crop evapotranspiration: Guidelines for computing crop water requirements, FAO Irrigation and Drainage Paper 56, FAO, Rome, Italy.
- Singh, K. Act to save groundwater in Punjab: Its impact on the water table, electricity subsidy, and environment. Agri. Economics Research Review, 2009, 22, 365–386.
- Sharma, Bharat R.; Ambili, G. K.; Sidhu, B. S. 2010. The Punjab Preservation of Subsoil Water Act: a regulatory mechanism for saving groundwater. In Rao, M. S.; Khobragade, S.; Kumar, B.; Singh, R. D. (Eds.). Proceedings of the Workshop on Water Availability and Management in Punjab (WAMIP-2010), Chandigarh, India, 13-15 December 2010. Roorkee, India: National Institute of Hydrology. pp.405-414.
Annexure 1: Groundwater Resource Potential (Ha-M) Of Punjab
|
District |
Geographical Area (ha.) |
Recharge from rainfall (ham) |
Recharge from other sources (ham) |
Total annual Ground Water Rech arge |
Provision for Natural Disch arge |
Net Annual Ground Water Avail ability |
||
|
monsoon season |
non-monsoon season |
monsoon season |
non-monsoon season |
|||||
|
Northern Zone |
||||||||
|
Gurdaspur |
254450 |
39037 |
10704 |
95339 |
27671 |
172752 |
16656 |
156096 |
|
Pathankot |
96860 |
11576 |
4284 |
8792 |
6588 |
31239 |
2774 |
28465 |
|
Rupnagar |
137040 |
16966 |
4271 |
13808 |
10034 |
45079 |
4508 |
40571 |
|
SAS Nagar |
118900 |
17874 |
4256 |
4133 |
2135 |
28397 |
2565 |
25832 |
|
Hoshiarpur |
333140 |
45197 |
12141 |
25468 |
12164 |
94970 |
9039 |
85931 |
|
SBS Nagar |
132540 |
20468 |
4891 |
29886 |
15062 |
70307 |
7031 |
63276 |
|
Total |
1072930 |
151118 |
40547 |
177426 |
73654 |
442744 |
42573 |
400171 |
|
Central Zone |
||||||||
|
Amritsar |
240330 |
30913 |
8132 |
88382 |
44165 |
171592 |
17159 |
154433 |
|
Barnala |
135170 |
11860 |
2292 |
36439 |
13764 |
64354 |
6435 |
57919 |
|
FG Sahib |
111670 |
15746 |
3590 |
32822 |
9543 |
61700 |
6170 |
55530 |
|
Jalandhar |
263350 |
35349 |
8193 |
62313 |
24553 |
130408 |
13041 |
117367 |
|
Kapurthala |
161810 |
21157 |
5780 |
41574 |
9414 |
77924 |
7792 |
70131 |
|
Ludhiana |
358690 |
47046 |
9962 |
114523 |
43907 |
215438 |
21544 |
193894 |
|
Patiala |
330270 |
42501 |
9144 |
72475 |
28317 |
152437 |
15244 |
137193 |
|
Moga |
217220 |
21395 |
4251 |
76758 |
17244 |
119648 |
11965 |
107683 |
|
Sangrur |
373730 |
39220 |
8858 |
81155 |
30866 |
160098 |
16010 |
144088 |
|
Tarn taran |
258340 |
26388 |
7100 |
75249 |
31360 |
140097 |
14010 |
126087 |
|
Total |
2450580 |
291575 |
67302 |
681690 |
253133 |
1293696 |
129370 |
1164325 |
|
South-Western Zone |
||||||||
|
Bathinda |
354720 |
23526 |
5103 |
65212 |
59573 |
153414 |
12316 |
141098 |
|
Faridkot |
141860 |
12240 |
2202 |
38380 |
14399 |
67220 |
6722 |
60498 |
|
Fazilka |
290190 |
19944 |
3258 |
45812 |
33674 |
102689 |
10269 |
92420 |
|
Ferozepur |
254000 |
19819 |
5254 |
88613 |
23749 |
137436 |
13744 |
123692 |
|
Mansa |
207090 |
17519 |
3536 |
56290 |
36871 |
114216 |
11422 |
102794 |
|
Muktsar |
265610 |
18478 |
3814 |
29432 |
29943 |
81666 |
8167 |
73499 |
|
Total |
1513470 |
111526 |
23167 |
323739 |
198209 |
656641 |
62640 |
594001 |
|
State |
5036980 |
554219 |
131014 |
1182854 |
524992 |
2393079 |
234581 |
2158498 |
Annexure 2: Dynamic Groundwater Resources of Punjab State
|
District |
Geogra phical Area (ha.) |
Net Annual Ground Water Availability (ham) |
Existing Groundwater Draft (ham) |
Provision for Ind& Domes water supply for 25 years (ham) |
Stage of Groundwater Development (%) |
||
|
Domestic and Industrial |
Irrigation |
Total |
|||||
|
Northern Zone |
|
|
|
|
|
|
|
|
Gurdaspur |
254450 |
156096 |
202477 |
7064 |
209541 |
9321 |
134 |
|
Pathankot |
96860 |
28465 |
18742 |
2900 |
21642 |
3838 |
76 |
|
Rupnagar |
137040 |
40571 |
44000 |
3625 |
47626 |
4575 |
117 |
|
SAS Nagar |
118900 |
25832 |
23693 |
7177 |
30869 |
8547 |
119 |
|
Hoshiarpur |
333140 |
85931 |
84890 |
7231 |
92120 |
9442 |
107 |
|
SBS Nagar |
132540 |
63276 |
71053 |
2402 |
73455 |
3256 |
116 |
|
Total |
1072930 |
400171 |
444855 |
30399 |
475253 |
38979 |
119 |
|
Central Zone |
|
|
|
|
|
|
|
|
Amritsar |
240330 |
154433 |
217950 |
10014 |
227964 |
13655 |
148 |
|
Barnala |
135170 |
57919 |
119753 |
2340 |
122093 |
3217 |
211 |
|
FG Sahib |
111670 |
55530 |
112087 |
3162 |
115250 |
4032 |
208 |
|
Jalandhar |
263350 |
117367 |
268433 |
12264 |
280697 |
16714 |
239 |
|
Kapurthala |
161810 |
70131 |
151500 |
5419 |
156919 |
6555 |
224 |
|
Ludhiana |
358690 |
193894 |
338377 |
16330 |
354707 |
21176 |
183 |
|
Patiala |
330270 |
137193 |
290319 |
7139 |
297458 |
9768 |
217 |
|
Moga |
217220 |
107683 |
243450 |
3651 |
247101 |
5020 |
229 |
|
Sangrur |
373730 |
144088 |
368502 |
6129 |
374631 |
8427 |
260 |
|
Tarn Taran |
258340 |
126087 |
188607 |
4187 |
192794 |
5743 |
153 |
|
Total |
2450580 |
1164325 |
2298978 |
70635 |
2369614 |
94307 |
204 |
|
South-Western Zone |
|
|
|
|
|
||
|
Bathinda |
354720 |
141098 |
132149 |
5484 |
137633 |
7528 |
98 |
|
Faridkot |
141860 |
60498 |
96432 |
4746 |
101179 |
5656 |
167 |
|
Fazilka |
290190 |
92420 |
87076 |
4611 |
91687 |
6280 |
99 |
|
Ferozepur |
254000 |
123692 |
199650 |
3176 |
202825 |
4185 |
164 |
|
Mansa |
207090 |
102794 |
145381 |
16 |
145397 |
16 |
141 |
|
Muktsar |
265610 |
73499 |
51944 |
2705 |
54649 |
2705 |
74 |
|
Total |
1513470 |
594001 |
712632 |
20738 |
733370 |
26370 |
123 |
|
State |
5036980 |
2158498 |
3456464 |
121772 |
3578236 |
159655 |
166 |
Annexure 3: Surface Water Availability and Irrigation Requirement of Punjab
|
District |
Surface water availability (ha-m) |
Crop evapotranspiration (ET) (MCM) |
Irrigation requirement (MCM) |
||||
|
Kharif |
Rabi |
Total |
Kharif |
Rabi |
Total |
||
|
Northern Zone |
|
|
|
|
|
|
|
|
Gurdaspur |
385.4 |
1420.40 |
924.27 |
2344.67 |
2275.80 |
897.20 |
3173.00 |
|
Pathankot |
87.51 |
320.57 |
184.79 |
505.36 |
429.37 |
182.26 |
611.63 |
|
Rupnagar |
463.6 |
360.01 |
249.33 |
609.34 |
604.95 |
248.44 |
853.39 |
|
S.A.S Nagar |
-- |
452.53 |
227.74 |
680.27 |
625.12 |
227.76 |
852.88 |
|
Hoshiarpur |
583.6 |
1398.53 |
675.06 |
2073.59 |
1660.89 |
724.10 |
2385.00 |
|
S.B.S Nagar |
97.25 |
544.42 |
386.15 |
930.57 |
1034.27 |
372.85 |
1407.12 |
|
Total |
1617.36 |
4496.46 |
2647.34 |
7143.80 |
6630.40 |
2652.61 |
9283.02 |
|
Central Zone |
|
|
|
|
|
||
|
Amritsar |
654.78 |
1181.62 |
884.27 |
2065.89 |
2163.28 |
865.84 |
3029.12 |
|
Barnala |
265.94 |
761.22 |
492.12 |
1253.34 |
1799.77 |
485.86 |
2285.63 |
|
Fateh G Sahib |
286.94 |
649.53 |
380.00 |
1029.53 |
1450.85 |
374.40 |
1825.25 |
|
Jalandhar |
48.00 |
1596.47 |
768.43 |
2364.90 |
2723.12 |
757.17 |
3480.30 |
|
Kapurthala |
8.00 |
887.62 |
610.68 |
1498.30 |
1715.10 |
584.30 |
2299.40 |
|
Ludhiana |
521.73 |
1899.63 |
1205.56 |
3105.19 |
3766.61 |
1188.27 |
4954.88 |
|
Patiala |
605.48 |
1649.25 |
1052.35 |
2701.60 |
3800.65 |
1037.99 |
4838.64 |
|
Moga |
550.2 |
1248.53 |
789.33 |
2037.86 |
2517.54 |
777.86 |
3295.40 |
|
Sangrur |
943.21 |
2048.28 |
1293.61 |
3341.89 |
4029.79 |
1274.62 |
5304.41 |
|
Tarn Taran |
670.56 |
1150.33 |
844.91 |
1995.24 |
2227.09 |
831.17 |
3058.26 |
|
Total |
4554.84 |
13072.48 |
8321.26 |
21393.74 |
26193.80 |
8177.48 |
34371.29 |
|
South-Western Zone |
|
|
|
|
|
||
|
Bathinda |
1392.5 |
1764.73 |
1178.39 |
2943.12 |
2584.83 |
1156.69 |
3741.50 |
|
Faridkot |
451.06 |
761.05 |
471.82 |
1232.87 |
1739.16 |
471.00 |
2210.16 |
|
Fazilka |
2359.71 |
1594.84 |
1081.51 |
2676.35 |
2288.83 |
1075.11 |
3363.95 |
|
Ferozepur |
1120.4 |
1289.28 |
817.75 |
2107.03 |
3016.52 |
819.84 |
3836.36 |
|
Mansa |
720.51 |
1112.12 |
764.53 |
1876.65 |
1704.98 |
743.74 |
2448.72 |
|
Muktsar |
2194.65 |
1385.98 |
926.08 |
2312.06 |
2446.17 |
907.21 |
3353.38 |
|
Total |
8238.83 |
7908.00 |
5240.08 |
13148.08 |
13780.49 |
5173.59 |
18954.07 |
|
State |
14411.03 |
25476.94 |
16208.68 |
41685.62 |
46604.69 |
16003.68 |
62608.38 |


