Water and Soil Quality of Coffee Plantations in the Western Ghats Region, Chikkamagaluru District, Karnataka, India
Lingayya Raghavendra1,2
and Melally Giddegowda Venkatesha1
*

http://dx.doi.org/10.12944/CWE.15.3.14
Copy the following to cite this article:
Raghavendra L, Venkatesha M. G. Water and Soil Quality of Coffee Plantations in the Western Ghats Region, Chikkamagaluru District, Karnataka, India. Curr World Environ 2020;15(3). DOI:http://dx.doi.org/10.12944/CWE.15.3.14
Copy the following to cite this URL:
Raghavendra L, Venkatesha M. G. Water and Soil Quality of Coffee Plantations in the Western Ghats Region, Chikkamagaluru District, Karnataka, India. Curr World Environ 2020;15(3). Available From: https://bit.ly/3nEtMtJ
Download article (pdf) Citation Manager Publish History

Introduction
Water and soil qualities are the two main factors in agriculture activities that play a significant role in agronomy growth and yield.1 Studies on ecology and agronomy are focused on the water and soil as they are significant in maintaining human health and ecosystem.2 Without access to quality water and soil, it is impossible to make sustainable agriculture and life.3 Contamination arising from agricultural activities results in water and soil pollution. 4 Increased food demands for the growing population and food production have been met by an amalgamation of wide yielding crop varieties that depend on pesticides fertilizers, which increase the pollution load in the concerned area. Unhygienic handling of farm animals and excessive pesticides and fertilizers, causing soil and water contamination, are some of the main concerns regarding water and soil quality degradation. 5, 6
Soil fulfils basic agriculture requirements by providing organic matter, reduced erosion, well water infiltration, more water-holding capacity, less subsoil compaction, and less leaching of agrochemicals to groundwater.7 Soil ecosystem provides a range of services to human beings, but over-exploitation of soil can be controlled by adopting evaluated fertilizer and pesticide usage; practicing advanced soil management would help protect the soil from pollution and quality deterioration.8 Soil fitness is soil's capacity to function as a dynamic living system within the ecosystem and land-use boundaries to sustain plant and animal productivity, maintain or improve water and air quality, and uphold plant and animal health. To maintain the soil's quality by agricultural activities are present days of utmost significant concern of humankind.4 Soil health is essential in effective agriculture; good quality soil provides an environment for optimum substratum for plant growth that enhances crop health and throughput.9 In modern agriculture practices, alterations in soil quality mainly depend on the use of chemical fertilizers and pesticides on “un-conventionally” managed farms that can lead to polluted runoff that has detrimental effects on the ecosystem's organisms.10 Assessment of the soil's quality in the same agricultural activities being followed for several years will provide useful scientific data about soil quality and management. In the non-conventional way of agriculture, modern soil management methods will alter a farm's nutrient stability in terms of both its yield and its overall sustainability.11
As per the advanced agriculture practices, the chance of water contamination by agricultural activities is not ruled out.4 Quality of water is an essential resource for agriculture and industrial commitments and vital ecological existence; viable progress would not be possible without its abundant quantity and quality.12 Even though water is the basic essential requirement for agriculture, contamination is also seen in the same activities because of excess use and agrochemicals' mismanagement.4 Excess runoff of fertilizers and pesticides widely used in crop growing is a major cause of water contamination. Even though this kind of contamination is termed as a non-point pollution source, remediation and abatement of such contaminations are very difficult; therefore, prevention and sustainable management practice are needed. This study was the most concern as the coffee crop grows in an ecologically sensitive Western Ghats area by adopting modern agricultural practices. The Western Ghats is one of the world's biodiversity hotspots, and several endemic plants and animals exist in the region.13 Coffee contributes significantly to sustain the region's unique biodiversity; it is accountable for the socio-economic progress in the isolated hill region of the Western Ghats in the Karnataka state of India. The tendency of converting thick forest of this area into coffee plantation directly depends on the global demand for the coffee market, and it was 10% more from 1991 to 2002.14 Therefore, the main goal of the study was to assess the water and soil quality of perennial coffee plantations in the ecologically sensitive Western Ghats region of Karnataka, India.
Materials and Methods
Sampling Area
The arabica coffee plantations were selected within a 50km2 from Chikkamagaluru town (Karnataka). Chikkamagluru region climate falls under the category of the tropical wet area with an annual average temperature range of 15o-25oC, relative humidity 70- 80 %, and annual rainfall range 1600-2500 mm. About 80% of the rainfall is between May and September. Study areas were moderately sloped with an elevation range of 1000-1500m above sea level. Sampling areas represent the northern, southern, and western hilly regions of Chikkamagaluru town. Eastern part of the Chikkamaglauru town is a low land area. In each direction, the study area represented with one sampling location, i.e. a) L1(13°19'25.06"N 075°39'51.7"E) b) L2 (13°21'10.4"N 075°41'45.0"E ) c) L3 (13°14'47.5"N 075°44'42.7"E ) and d) L4 (13°26'14.6"N 075°36'48.4"E ) (Fig. 1 and Table 1). A sampling of soil and water was carried out from December 2017 to February 2018. Each sampling location included 7-9 random sampling points covering the distance of a 4-7 kilometer radius of an area of 50-100 hectares. In soil sampling, each sampling point contained seven samples from a higher elevation to lower slope in the zigzag stretch of an approximate distance of 10 meters between the samplings as followed by Prakash.15 Soil to the depth of 15-20cm from the upper soil layer was collected using stainless steel auger and stored in aluminium foil. Small plants and debris collected in samplings were discarded. Totally 224 soil samples were collected from the four locations. collected soil samples were stored separately in thermocool box at 2-4oC until transported within 6-8 hours to the laboratory. In the laboratory, soil samples were air-dried at room temperature (22-25oC ) and pounded to form powder using a pestle and mortar and then sieved through < 2 mm sieve and stored at 4oC in the freezer until analysis as followed by Fatoki.16 Around the selected soil sampling points depending on the availability of water sources, i.e., bore wells, open wells, lakes, and ponds, one litter of water sample was collected in plastic bottles (for physicochemical analysis) and 100 ml sample (acidified for metal analysis) separately and brought to the laboratory within 6-8 hours and stored at 4oC in the freezer until further analysis. Altogether, 66 water samples were collected from the four sampling locations.
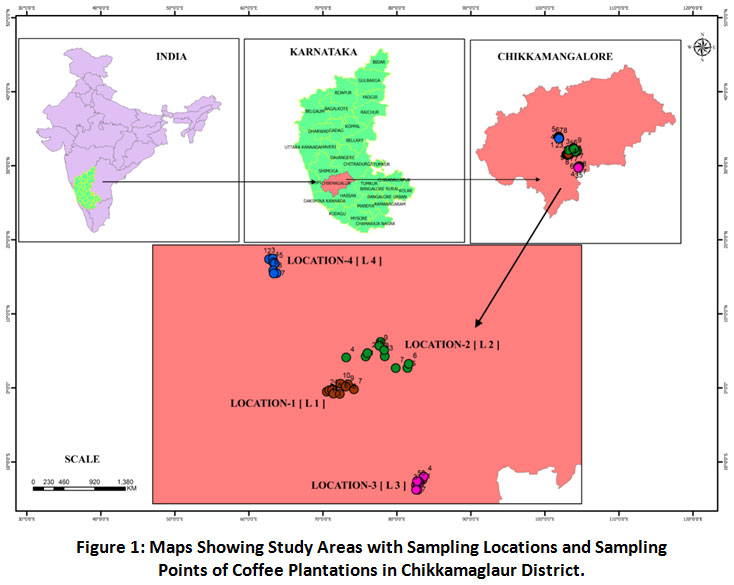 |
Figure 1: Maps Showing Study Areas with Sampling Locations and Sampling Points of Coffee Plantations in Chikkamaglaur District. Click here to view figure |
Table 1: Details of Sampling Locations of Coffee Plantations in Chikkamagaluru District
|
Sl. No |
Sampling location |
Latitude & longitude |
Status of locations |
|
1 |
Location-1 |
13°19’25.06” N 075°39’51.7” E |
Well maintained arabica coffee plantation without any intercrop, with the humid condition and hilly area. 1201 meter elevation from sea level |
|
2 |
Location-2 |
13°21’10.4” N 075°41’45.0” E |
Well maintained arabica coffee plantation, with banana and orange as intercrop, the humid condition, and less steep area. with elevation1222 meter |
|
3 |
Location -3 |
13°14’47.5” N 075°44’42.7” E |
Well maintained arabica coffee plantation, with pepper as intercrop, moderately humid, gentle slope area with elevation 1051 meter |
|
4 |
Location-4 |
13°26’14.6” N 075°36’48.4” E |
Well maintained arabica coffee plantation with pepper and areca as intercrop, hilly humid area, elevation above sea level 1006 meter. |
Analysis
Ultrapure water acquired from the Millipore water system was used throughout the work. All chemicals, reagents, and buffers were analytical grade, Merck (Darmstadt, Germany) and were checked for possible trace metal contamination. Where required, standard solutions were prepared by diluting 1000 ppm certified standard solutions, Merck (Darmstadt, Germany). For ICP-MS N5 high purity argon gas was used.
Water
A total of 66 water samples were analysed for pH, dissolved oxygen (DO), conductivity, total dissolved solids (TDS), total hardness, sulphate, chloride, total alkalinity, chemical oxygen demand (COD), nitrate, phosphate as P, magnesium, copper, lead, zinc, nickel, iron, cadmium, manganese, and chromium by using standard procedures.17
Soil
The physical and chemical soil properties of 224 samples were analysed using standard laboratory methods. The soil pH and electrical conductivity (EC) were measured using ultrapure water 5:1 volume/mass proportion.18 Moisture content was determined by using the gravimetric method.19 Organic carbon, available phosphorus content, nitrogen, and available potassium were determined by Jackson's methods18. Metals, i.e., copper, lead, zinc, chromium, nickel, manganese, cadmium, and iron, were analysed by following the method of Rashed 20 with little modifications with inductive coupled plasma-mass spectroscopy (Perkin Elmer Nexion 300X model).
Data Analysis
A set of the quantitative data obtained from the chemical analysis was processed by statistical computation using Microsoft Excel 2010, R, and PAST version 3.2. The quality of water and soil of the area depends on one another variable, deciding factors of the water and soil quality. Descriptive statistics of the water and soil variables are explained in table 2 and 3 by observing these data in little kurtosis nature; normalization of data for further analysis is recommended.21 The data normalization was done by converting the data into the log p1 form using the R statistical tool. These minimize the variables and eliminate the influence of different units of measurements and reduce the data dimensionless. To ascertain the relationship and influence of water and soil samples' physicochemical variables, Principal Component Analysis (PCA) (PAST version 3.2) statistical tool was applied to normalized data. The PCA tool was applied to assess the statistical correlation among different components to predict the status of water and soil samples.
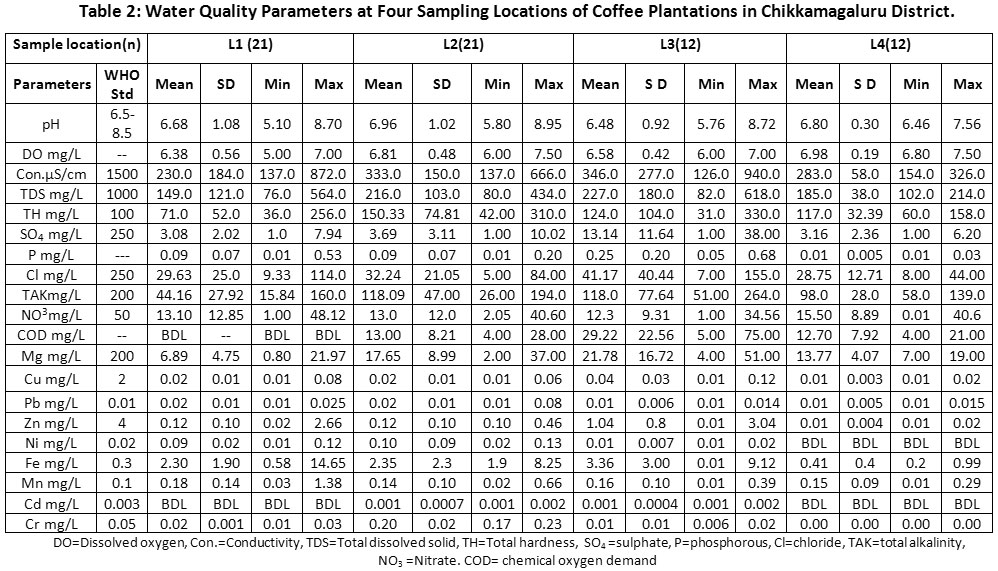 |
Table 2: Water Quality Parameters at Four Sampling Locations of Coffee Plantations in Chikkamagaluru District. Click here to view Table |
 |
Table 3: Soil Quality Parameters at Four Sampling Locations of Coffee Plantations in Chikkamagaluru District. Click here to view Table |
Results and Discussion
Water
Water quality affected by agricultural activities as a cause of pollution has been well studied.22, 23, 24 The water quality mainly depends on the physicochemical properties of the water, minerals, and microbes. However, the major role of the water quality is decided by the physicochemical properties of the water, which is influenced by nature.25, 26, 27 Total dissolved solids and electric conductivity of all water samples were within the range of 82-618 mg/L and 126-940 µSm/cm against WHO standards of 1000mg and 1500µSm/cm respectively (Table 2). The major ions, chloride, nitrate, sulphate, magnesium, and phosphorous, were considered well within the limit compared with concentrations of several surface water bodies globally.28 An increasing value of total hardness and total dissolved solids in the range of 31 - 330 mg/L and 82 - 618mg/L shows the water quality in the depletion trend. The presence of phosphate as P in all the sampling locations with a range of 0.01 - 0.68 mg/L was a strong indication of agricultural leachate contamination because of more phosphorous-based fertilizers.29 Toxic metals like nickel, cadmium, manganese, and chromium were detected in water samples. However, when compared to WHO water standard, a few samples showed a concentration of more than desirable limits (Table 2). Dissolved oxygen showed a good quality of water in the range of 5.0-7.50 mg/L. However, a few samples showed a chemical oxygen demand value of 4.0 to 29.22 mg/L range.
PCA statistical techniques were applied to the variety of environmental data analysis to predict the quality and cause of the depletion factor in water bodies.22, 30, 31 PCA explains the information on all the critical parameters and outcomes of whole laboratory data by diagonalization of the correlation matrix.32 Table 4 shows the water samples' PCA results, including the loadings of each principal component (PC). In PCA, eigenvalues are used to decide the number of PC. A scree plot (Fig 2) for the 66 water samples in four locations showed a noticeable change in slope after the fifth eigenvalue.33 The first five PCs, which explained the variance of 68.43% of 5 eigenvalues, were used for further analysis. To explain the contribution of chemical variables, the loadings' absolute value was measured like a PC. Each variable's maximum influence was underlined; it explains the influence and contribution of four locations with parameters. PC 1 explained 27.64% of the variance and was contributed by conductivity, sulphate, calcium, magnesium, chloride, total dissolved solids, total hardness, alkalinity, and magnesium, with strong positive loadings and deciding factors of the water quality in the sampling locations. PC 2 explains 12.63 % of the variance by phosphorous, nitrate, and copper positively and pH, dissolved oxygen negatively. PC 3 11.32 % of the variance includes lead, zinc, nickel, iron, and manganese. PC 4 contributes 10.11 % of total alkalinity, lead, nickel, and chromium positively and zinc negatively. PC 5 (6.72 %) is contributed by nitrate and nickel positively, and copper and cadmium negatively. PC 1 and PC 4 explain the water's hydrochemical characters, which directly depend on the sampling location's water quality depending on the area's geological aspects. Third, fourth and fifth PC contributed by phosphorous, nitrate, and metals, i.e., lead, zinc, nickel, and copper. These prominences in the water were due to agricultural activities leading to depletion of water quality. Incidentally, in our study locations, phosphorous, nitrate, and copper were being used as fertilizers/pesticides in the coffee plantations. Biplot (Fig 3) explains the correlation between PC1 and PC2 for analysed sample data of four study area locations. The sample belongs to the location-1 (L1 Diamond symbol ) shows the most prominent clusters on the left side of the PC1, whereas the location-4 (L4 round filled) are commonly clustered the positive side of the PC axis. The other two sampling location-2 (L2 star) and location-3(L3 triangle) were dispersed in the PCs' space without showing the prominent cluster because of the hydrochemical variation of these two locations' values with the first two locations. Biplot explains the major contributions of the water quality were total dissolved solids, chloride, sulphate, nitrate, and phosphorous with little contribution from metals, i.e., zinc and manganese in the positive part of the component, indicating the main effect of these parameters on the quality of the water in four locations. Especially phosphorous, nitrate and copper supports the view of excessive usage of fertilizer and pesticides in the study areas.
Table 4: PC Loading Score Value of Water Samples of Four Locations of Coffee Plantations.
|
PC 1 |
PC 2 |
PC 3 |
PC 4 |
PC 5 |
|
|
pH |
-0.27151 |
-0.65243 |
0.22995 |
-0.22742 |
0.19416 |
|
Dissolved Oxygen |
-0.02777 |
-0.78896 |
0.17289 |
-0.26214 |
0.084351 |
|
Conductivity |
0.95638 |
0.049052 |
0.016658 |
-0.01119 |
0.052353 |
|
Total dissolved solids |
0.94684 |
0.074417 |
0.00488 |
-0.02067 |
0.055059 |
|
Total Hardness sample |
0.95933 |
-0.09035 |
0.003491 |
0.065406 |
0.050148 |
|
Sulphate as SO4 |
0.47852 |
0.15532 |
-0.18833 |
0.00811 |
-0.22038 |
|
Dissolved Phosphate as P |
0.31458 |
0.52814 |
-0.27191 |
-0.07467 |
-0.05948 |
|
Chloride as Cl |
0.84593 |
0.26157 |
0.009223 |
-0.16569 |
0.24254 |
|
Total alkalinity sample |
0.83198 |
-0.38288 |
0.015057 |
0.066478 |
-0.16117 |
|
Nitrate |
0.021887 |
0.46805 |
-0.29628 |
0.25439 |
0.47041 |
|
Chemical Oxygen Demand. |
-0.14197 |
0.19644 |
0.12678 |
-0.51688 |
-0.17475 |
|
Magnesium |
0.8489 |
-0.20724 |
0.01465 |
0.001887 |
-0.13809 |
|
Copper as Cu |
-0.06624 |
0.40813 |
0.3335 |
0.066704 |
-0.44329 |
|
Lead as Pb |
0.063298 |
-0.00345 |
0.47757 |
0.71989 |
-0.22472 |
|
Zinc as Zn |
0.048602 |
0.30881 |
0.48272 |
-0.41119 |
0.25686 |
|
Nickel as Ni |
-0.17062 |
0.28189 |
0.44696 |
0.49742 |
0.52201 |
|
Iron as Fe |
-0.03333 |
0.23476 |
0.78909 |
-0.04861 |
-0.00579 |
|
Manganese as Mn mg/L |
0.31536 |
0.13766 |
0.67733 |
-0.48627 |
0.006237 |
|
Cadmium as |
-0.02004 |
-0.00731 |
0.25216 |
0.38444 |
-0.47083 |
|
Total Chromium as Cr |
0.3243 |
-0.47721 |
0.22547 |
0.44883 |
0.27691 |
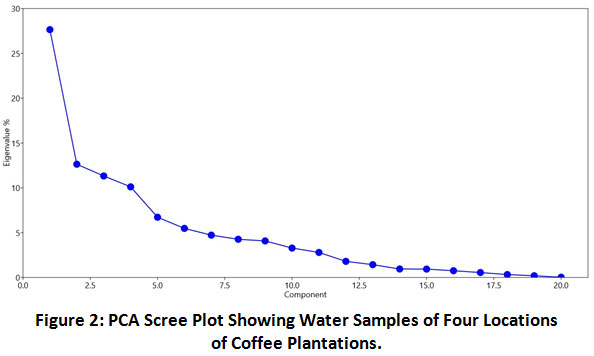 |
Figure 2: PCA Scree Plot Showing Water Samples of Four Locations of Coffee Plantations. Click here to view figure |
 |
Figure 3: PCA Bi-Plot of Water Samples of Four Locations of Coffee Plantations. Click here to view figure |
Previous studies showed that the water quality variations in water sources were mainly related to inorganic nutrients and heavy metals by agricultural wastewater 34. Water quality variations result in potential impacts on the aquatic ecosystem 35. This study could be used as necessary information by decision-makers and farmers to take proper action in this regard. It is clear from the results of the water quality of the study area that there was a depletion trend of phosphorous, nitrate, iron, chromium, and chemical oxygen demand in the water. Further studies in detail are necessary to minimize water quality degradation by agriculture activities.
Soil
Table 3 explains the descriptive statistics of 224 soil samples of four locations for 16 parameters (variables). In all the locations, the soil's pH was in the range of 4.58 - 7.3, which is the more liable pH condition for the growing coffee plants.36 Soil conductivity explains the total interrelationship between all the physical and chemical parameters of the soil.37 The conductivity ranges from 103.2 to 661 µS/cm, which is the required range of soil conductivity for agriculture.36 Moisture content in the soil plays a deciding role in mineralizing the plant essential nitrogen element.38 In this study, even though few samples show the lower moisture content, the entire sample locations fall in the range of 1.37 – 28.25 percentage of moisture content. It is essential to evaluate and maintain the soil organic carbon for sustainable agriculture and maximum yield.39 Even though coffee plantations are under the shelter of big tree canopies; our data confirm the lower organic carbon level. It ranged from 0.12 to 0.83%, which falls under the low level in agriculture requirement for coffee.40 The soil fertility mainly depends on macronutrients (nitrogen, phosphorous, and potassium) availability in the soil. 39 The requirement of macronutrients in the soil is involved in some biochemical reactions controlled by the ecological process. However, extra loadings of fertilizers may cause an imbalance of the same. Our study confirmed the availability of macronutrient in the range of 0.01- 0.08% of nitrogen, 0.01 - 0.04 mg/g phosphorous and 0.27 – 6.00 mg/g potassium against recommended range40 of 0.069-0.138% of nitrogen ,0.0025-0.006 mg/g phosphorous and 0.034-0.069 mg/g of potassium respectively. The major part of the environment consists of nitrogen and carbon as main constituents for plant growth. However, the transformation of these nutrients for the plant requirement involves many ecological reactions.41 The concentration of copper, lead, zinc, nickel, manganese, cadmium, iron, and chromium is given in Table 3. Copper, zinc, manganese, and iron are considered micronutrients for plant growth. 39, 42 As per CCRI40 , micronutrients and their critical limit are copper (0.0002 mg/g), iron(0.0025-0.0045 mg/g), manganese(0.015-0.10 mg/g) and zinc(0.0006 mg/g). In our study copper (0.01-1.23 mg/g), iron (0.01-212.2 mg/g), manganese (0.01-13.64 mg/g), and zinc (0.01-0.16 mg/g) shows the respective values. In this study, all the samples shows a high copper concentration in the higher range (0.01-1.23 mg/g) due to the more application of copper sulphate as a fungicide against coffee leaf rust. Iron content was at a very high level (0.01-212.2 mg/g) may be the result of many ecological and soil management activities majorly due to topsoil erosion.43
PCA showed a noticeable change of slope after the fourth eigenvalue.33 (Fig-4). PCA explains 89.86 % of the total variance of the data set in four principal components. PC 1 describes 71.01% of the variance with high negative loadings of pH, conductivity, and moisture, supporting a high positive loading of heavy metals, i.e., copper, lead, zinc, nickel, manganese, cadmium, and chromium inversely. PC 2 explains 8.50% of the total organic carbon, nitrogen, and iron variance with positive loadings (Table5). Principal components 3 and 4 describe 6.69 % and 3.64%, respectively. The significance of different sampling locations and the variables (parameters) are well explained among each other by the PCA analysis bi-plot (Figs-5). The sample belongs to the location-1 (L1 Diamond symbol ), location-3 (L3 Triangle), and location-4 (L4 Round filled) are grouped with the left side of the principal component 1 because of the almost similar score value of variables except for metal ion contents. Location-2 samples (L2 star) show a little dispersed clustering in the bi-plot's negative side because of its lower concentration variable compared to other locations. Three locations showed single dispersed grouping in the negative side of the PCAs because of the similar concentration of variables, which supports the view that partial separation in the biplot confirms each location's characters.44 Table 5 explains the PCA analysis of the loading score against each component. Almost the first three components that have the eigenvalue >1 play the sample properties' major role. PC1 metal is in a prominent place in the bi-plot. It decides the quality of soil except for iron, which has the maximum value. Being on the positive area of the component sample location, these parameters emphasize the prominence in the quality of the soil. PC1 negative value of the pH supports the metals' concentration on the positive side of the components. Along with these metals, phosphorous's total dominant appearance may result from excessive fertilizer used in agricultural practices. In agriculture, chemical fertilizer, i.e., NPK (Nitrogen, Phosphorous, and Potassium) mixture has been used in an estimated volume. Incidentally, in the bi-plot, both potassium and nitrogen show the negative lodgings, and another side of the components phosphorous shows positive loadings indicating to maintain the optimum level of these macronutrients in soil. PC2 explains the total organic carbon, nitrogen, and iron in the positive loadings reveal the study locations have some particular variables that play a major role in the soil constituents by their concentrations.
Table 5: PC Loading Score Value of Soil Samples of Four Locations of Coffee Plantations.
|
PC 1 |
PC 2 |
PC 3 |
PC 4 |
|
|
pH |
-0.97421 |
-0.00234 |
0.034526 |
0.079976 |
|
Conductivity |
-0.97394 |
-0.03579 |
0.035348 |
0.078669 |
|
Moisture content |
-0.90287 |
0.14035 |
0.20504 |
0.018093 |
|
TOC |
-0.7072 |
0.52387 |
-0.25699 |
-0.02912 |
|
Nitrogen |
-0.32797 |
0.74951 |
-0.48716 |
0.008334 |
|
C/N ratio |
-0.96779 |
-0.07265 |
0.11802 |
0.072354 |
|
Dissolved Phosphate as P |
0.76581 |
0.2506 |
-0.06337 |
0.45997 |
|
Potassium |
-0.75698 |
-0.23146 |
0.037462 |
0.4657 |
|
Copper as Cu |
0.82102 |
0.20813 |
0.21836 |
0.28748 |
|
Lead as Pb |
0.89368 |
0.029195 |
-0.03312 |
0.18303 |
|
Zinc as Zn |
0.96064 |
0.096044 |
-0.00711 |
-0.06712 |
|
Nickel as Ni |
0.91833 |
-0.04972 |
-0.14571 |
-0.06755 |
|
Iron as Fe |
0.23076 |
0.54534 |
0.75821 |
-0.09595 |
|
Manganese as Mn |
0.9011 |
0.092809 |
0.16769 |
-0.02189 |
|
Cadmium as Cd |
0.9414 |
-0.12925 |
-0.14953 |
0.01495 |
|
Total Chromium as Cr |
0.97702 |
-0.0644 |
-0.09372 |
-0.02251 |
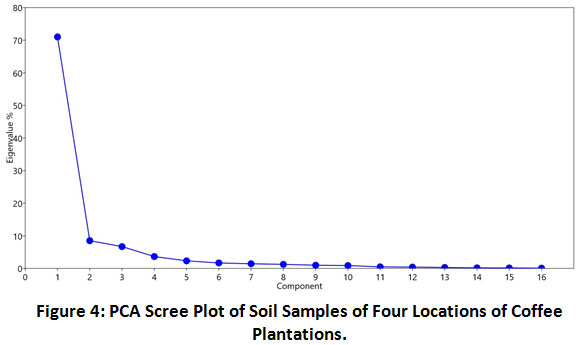 |
Figure 4: PCA Scree Plot of Soil Samples of Four Locations of Coffe Plantations. Click here to view figure |
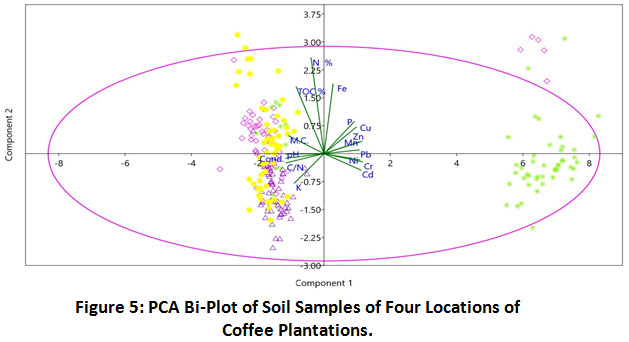 |
Figure 5: PCA Bi-Plot of Soil Samples of Four Locations of Coffee Plantations. Click here to view figure |
Inorganic fertilizer usage in excess will result in the degradation of soil health 45. Soil metal pollution is observed by geogenic and anthropogenic processes 46. Anthropogenic activities mainly cause soil pollution by agricultural practices, which was observed in our study, as many metal contents were in high quantity. Soil quality results showed a lower level of organic carbon, which plays an essential role in plant health. High-level of heavy metals and macronutrient concentration in the soil indicate the little management strategies of fertilizer applications, which affect the plantation yield and health. Hence, a detailed study in future on the soil quality of coffee plantation is highly recommended.
Conclusion
The water and soil quality of the four coffee plantation locations mainly depended on some critical variables, i.e., pH, phosphorous, nitrate, and potassium. In our study, both in water and soil, PCA analysis confirm the clustering and water quality and soil samples much depend on phosphate and metal ions. Metal ions and pH concentration relation in the soil is substantially proved by PCA analysis. This study confirms the depletion or contamination trend of water and soil of the four locations of the coffee plantations. Hence, the continuously growing crop in the same area requires the utmost care for the soil and water management.
Acknowledgement
The first author expresses his gratitude to the Karnataka State Pollution Control Board for deputation with financial and laboratory support to pursue doctoral degree at Bangalore University.
Conflict of Interest
The authors do not have any conflict of interest.
References
- Mati, B. M. (2006). Overview of water and soil nutrient management under smallholder rain-fed agriculture in East Africa (Vol. 105). IWMI.
- Horrigan, L., Lawrence, R. S., & Walker, P. (2002). How sustainable agriculture can address the environmental and human health harms of industrial agriculture. Environmental health perspectives, 110(5), 445-456.
CrossRef - Thierfelder, C., & Wall, P. C. (2009). Effects of conservation agriculture techniques on infiltration and soil water content in Zambia and Zimbabwe. Soil and tillage research, 105(2), 217-227.
CrossRef - Novotny, V. (1999). Diffuse pollution from agriculture—a worldwide outlook. Water Science and Technology, 39(3), 1-13.
CrossRef - Hooda, P. S., Edwards, A. C., Anderson, H. A., & Miller, A. (2000). A review of water quality concerns in livestock farming areas. Science of the total environment, 250(1-3), 143-167.
CrossRef - Vega, M., Pardo, R., Barrado, E., & Debán, L. (1998). Assessment of seasonal and polluting effects on the quality of river water by exploratory data analysis. Water research, 32(12), 3581-3592.
CrossRef - De la Rosa, D., & Sobral, R. (2008). Soil quality and methods for its assessment. In Land use and soil resources (pp. 167-200). Springer, Dordrecht.
CrossRef - Bhardwaj, A. K., Srivastava, S., Dagar, J. C., Yadav, R. K., & Sharma, D. K. (2016). Removing bottlenecks in fertilizing salt-affected soils for agricultural production. In Innovative Saline Agriculture (pp. 145-160). Springer, New Delhi.
CrossRef - Baldwin, K. R. (2013). Soil quality considerations for organic farmers. The organic production publication series. Center for Environmental Farming Systems, North Carolina, State University. http://www. cefs. ncsu. edu/resources/organicproductionguide/soilqualityfinaljan09. pdf. Accessed, 23.
- Castillo, L. E., Martínez, E., Ruepert, C., Savage, C., Gilek, M., Pinnock, M., & Solis, E. (2006). Water quality and macroinvertebrate community response following pesticide applications in a banana plantation, Limon, Costa Rica. Science of the Total Environment, 367(1), 418-432.
CrossRef - Tully, K. L., & Lawrence, D. (2011). Closing the loop: nutrient balances in organic and conventional coffee agroforests. Journal of sustainable agriculture, 35(6), 671-695.
CrossRef - Lu, Y., Song, S., Wang, R., Liu, Z., Meng, J., Sweetman, A. J., ... & Wang, T. (2015). Impacts of soil and water pollution on food safety and health risks in China. Environment international, 77, 5-15.
CrossRef - World Wide Fund Retrieved from July 03, 2019 fromhttps://www.wwfindia.org/about_wwf/critical_regions/western_ghats2/about_the_western_ghats/
- Ambinakudige, S., & Choi, J. (2009). Global coffee market influence on landâ€use and landâ€cover change in the Western Ghats Of India. Land degradation & development, 20(3), 327-335.
CrossRef - Prakash, O., Suar, M., Raina, V., Dogra, C., Pal, R., & Lal, R. (2004). Residues of hexachlorocyclohexane isomers in soil and water samples from Delhi and adjoining areas. Current Science, 73-77.
- Fatoki, O. S., & Awofolu, R. O. (2003). Methods for selective determination of persistent organochlorine pesticide residues in water and sediments by capillary gas chromatography and electron-capture detection. Journal of Chromatography A, 983(1-2), 225-236.
CrossRef - APHA. (2017). Standard Methods for the Examination of Water and Wastewater 23ed. APHA American Public Health Association.
- Jackson, M. L. (1973). Soil chemical analysis Prentice Hall of India Ltd. New Delhi, 219-221.
- Gregorich, E. G., & Carter, M. R. (2007). Soil sampling and methods of analysis. CRC press.
- Rashed, M. N. (2010). Monitoring of contaminated toxic and heavy metals, from mine tailings through age accumulation, in soil and some wild plants at Southeast Egypt. Journal of Hazardous Materials, 178(1-3), 739-746.
CrossRef - Simeonov, V., Simeonova, P., & Tzimou-Tsitouridou, R. (2004). Chemometric quelity assessment of surface waters: two case studies. Chemia i Inżynieria Ekologiczna, 11(6), 449-469.
- Helena, B., Pardo, R., Vega, M., Barrado, E., Fernandez, J. M., & Fernandez, L. (2000). Temporal evolution of groundwater composition in an alluvial aquifer (Pisuerga River, Spain) by principal component analysis. Water research, 34(3), 807-816.
CrossRef - Kazi, T. G., Arain, M. B., Jamali, M. K., Jalbani, N., Afridi, H. I., Sarfraz, R. A., ... & Shah, A. Q. (2009). Assessment of water quality of polluted lake using multivariate statistical techniques: A case study. Ecotoxicology and environmental safety, 72(2), 301-309.
CrossRef - Ouyang, Y., Nkedi-Kizza, P., Wu, Q. T., Shinde, D., & Huang, C. H. (2006). Assessment of seasonal variations in surface water quality. Water research, 40(20), 3800-3810.
CrossRef - Carter, J. T., Rice, E. W., Buchberger, S. G., & Lee, Y. (2000). Relationships between levels of heterotrophic bacteria and water quality parameters in a drinking water distribution system. Water Research, 34(5), 1495-1502.
CrossRef - Tong, S. T., & Chen, W. (2002). Modeling the relationship between land use and surface water quality. Journal of environmental management, 66(4), 377-393.
CrossRef - Noges, T. (2009). Relationships between morphometry, geographic location and water quality parameters of European lakes. Hydrobiologia, 633(1), 33-43.
CrossRef - Brabec, E., Schulte, S., & Richards, P. L. (2002). Impervious surfaces and water quality: a review of current literature and its implications for watershed planning. Journal of planning literature, 16(4), 499-514.
CrossRef - Breeuwsma, A., Reijerink, J. G. A., & Schoumans, O. F. (1995). Impact of manure on accumulation and leaching of phosphate in areas of intensive livestock farming. In Animal waste and the land-water interface (pp. 239-249). Lewis.
- Shine, J. P., Ika, R. V., & Ford, T. E. (1995). Multivariate statistical examination of spatial and temporal patterns of heavy metal contamination in New Bedford Harbor marine sediments. Environmental science & technology, 29(7), 1781-1788.
CrossRef - Tauler, R., Barcelo, D., & Thurman, E. M. (2000). Multivariate correlation between concentrations of selected herbicides and derivatives in outflows from selected US Midwestern reservoirs. Environmental Science & Technology, 34(16), 3307-3314.
CrossRef - Tiouiouine, A., Yameogo, S., Valles, V., Barbiero, L., Dassonville, F., Moulin, M., ... & Kacimi, I. (2020). Dimension Reduction and Analysis of a 10-Year Physicochemical and Biological Water Database Applied to Water Resources Intended for Human Consumption in the Provence-Alpes-Côte d’Azur Region, France. Water, 12(2), 525.
CrossRef - Cattell, R. B., & Jaspers, J. (1967). A general plasmode (No. 30-10-5-2) for factor analytic exercises and research. Multivariate Behavioral Research Monographs.
- Abdel-Satar, A. M., Ali, M. H., & Goher, M. E. (2017). Indices of water quality and metal pollution of Nile River, Egypt. The Egyptian Journal of Aquatic Research, 43(1), 21-29.
CrossRef - Diamantini, E., Lutz, S. R., Mallucci, S., Majone, B., Merz, R., & Bellin, A. (2018). Driver detection of water quality trends in three large European river basins. Science of the Total Environment, 612, 49-62.
CrossRef - Arshad, M. A., & Martin, S. (2002). Identifying critical limits for soil quality indicators in agro-ecosystems. Agriculture, Ecosystems & Environment, 88(2), 153-160.
CrossRef - Lund, E. D., Christy, C. D., & Drummond, P. E. (1999). Practical applications of soil electrical conductivity mapping. Precision agriculture, 99, 771-779.
- Knoepp, J. D., & Swank, W. T. (2002). Using soil temperature and moisture to predict forest soil nitrogen mineralization. Biology and Fertility of Soils, 36(3), 177-182.
CrossRef - Campbell, C. A. (1978). Soil organic carbon, nitrogen and fertility. In Developments in soil science (Vol. 8, pp. 173-271). Elsevier.
CrossRef - CCRI. (2017) Coffee Guide. Central Coffee Research Institute, Coffee Research Station, Chikmagalur
- Batjes, N. H. (1996). Total carbon and nitrogen in the soils of the world. European journal of soil science, 47(2), 151-163.
CrossRef - Harmsen, K., & Vlek, P. L. G. (1985). The chemistry of micronutrients in soil. In Micronutrients in tropical food crop production (pp. 1-42). Springer, Dordrecht.
CrossRef - Hill, J., Megier, J., & Mehl, W. (1995). Land degradation, soil erosion and desertification monitoring in Mediterranean ecosystems. Remote Sensing Reviews, 12(1-2), 107-130.
CrossRef - Carlosena, A., Andrade, J. M., & Prada, D. (1998). Searching for heavy metals grouping roadside soils as a function of motorized traffic influence. Talanta, 47(3), 753-767.
CrossRef - Parihar, C. M., Singh, A. K., Jat, S. L., Dey, A., Nayak, H. S., Mandal, B. N., ... & Yadav, O. P. (2020). Soil quality and carbon sequestration under conservation agriculture with balanced nutrition in intensive cereal-based system. Soil and Tillage Research, 202, 104653.
CrossRef - Arslan, S. (2017). Assessment of groundwater and soil quality for agricultural purposes in Kopruoren basin, Kutahya, Turkey. Journal of African Earth Sciences, 131, 1-13.
CrossRef


