Ground Water Quality Assessment of Marble Mining Areas in Rajsamand District, Rajasthan, India
Kamod Kanwar Rathore
 and Suraj Kumar Singh
*
and Suraj Kumar Singh
*
http://dx.doi.org/10.12944/CWE.16.2.20
Copy the following to cite this article:
Rathore K. K, Singh S. K. Ground Water Quality Assessment of Marble Mining Areas in Rajsamand District, Rajasthan, India. Curr World Environ 2021;16(2). DOI:http://dx.doi.org/10.12944/CWE.16.2.20
Copy the following to cite this URL:
Rathore K. K, Singh S. K. Ground Water Quality Assessment of Marble Mining Areas in Rajsamand District, Rajasthan, India. Curr World Environ 2021;16(2). Available From : https://bit.ly/3e0iw8t
Download article (pdf)
Citation Manager
Publish History

Introduction
Excavation of the mineral carried out by the two major ways that is sub surface mining (Open cast) and underground mining method. In both of the methods ground water play an important role because, due to mining geological pattern of the rocks changes that leads to change in hydrology of the particular region and ultimately it leads to water pollution or change in water quality & quantity. There is no question mark that ground water is the important source for survival of agriculture, human health, energy as well as for the ecosystem on entire planate. The stress on ground water scarcity, decline of water quality is being increased due to overexploitation and mismanagement of the generated waste water and solid waste in industrial area. Reported that prolonged mining activities have degrade water quality and decrease recharging capacity of the area1cited that drinking water must be free from microorganisms and should have appropriate chemical concentrations imbalance in both of the properties cause health impacts2
In this article the objective of the study is to identify the changes and extent of contamination in ground water quality in and around the mining activities of the of the study area. The study area is facing serious threat on ground water quality degradation as the entire district have ample number of small-scale mining unit running in unsystematic manner. Water samples were collected from nearby areas of mining unit and as per the samples collected and analysed the overall water quality of the entire district is suitable for drinking purpose only after adequate treatment. As per the ground water atlas book 2013 all 7 blocks of Rajsamand district falls in over exploited zone it will cause serious water scarcity in near future.
Study Area
The Rajasamand district is situated in southern part of the Rajasthan. It shares the North boundary withAjmer and East with Bhilwara districts, South by Udaipur, in west it is bounded by Pali. It stretches between 230 31’ 49.64 to 240 30’ 16.57 North latitude and 740 13’ 19.93 to 740 58’ 59.58 East Longitude the general elevation between 500 to 625 m above mean sea level.
 |
Figure 1: Location Map of the Rajsamand District. Click here to view Figure |
Material and Method
Samples for ground water were collected from open well, tube well, hand pump for physio-chemical analysis during post monsoon-2019. During sampling of the representative water samples IS:3025 standard method was followedand collected samples were transported to the GMEC International laboratory and analysed as per standard methods for variousphysio-chemical parameters like- Electrical Conductivity, pH, Total Alkalinity, Total Dissolved Solids, Sodium, Potassium, Calcium, Magnesium, Chloride, Sulphate, Carbonate, Bicarbonate, Nitrate, Fluoride, Total Hardness.
Result and Discussion
Total 70 Samples were Collected from different blocks (Amet, Bhim, Deogarh, Khamnor, Kumbhalgarh, Railmagra, Rajsamand) for the analysis of basic parameters like Electrical Conductivity, pH, Total Alkalinity, Total Dissolved Solids, Sodium, Potassium, Calcium, Magnesium, Chloride, Sulphate, Carbonate, Bicarbonate, Nitrate, Fluoride, and Total Hardness. Result given in table no 1, all the parameters are manifested in mg/l, pH has no Unit and electrical conductivity (EC) given in Micro Siemens per centimetre.
Table 1: Physico-Chemical Characterization of Ground Water.
|
Parameters |
Unit |
Amet |
Bhim |
Deogarh |
||||||||||
|
Minim-al |
Maxima-l |
Mean |
Minima-l |
Maxim-al |
Mean |
Minima-l |
Maxim-al |
Mean |
||||||
|
Conductivity |
µS/cm |
580 |
4100 |
2340 |
500 |
9600 |
5050 |
360 |
3350 |
1855 |
||||
|
pH |
N/A |
7.6 |
8.6 |
8.10 |
7.9 |
8.9 |
8.40 |
7.9 |
9 |
8.45 |
||||
|
TDS |
mg/l |
313 |
2300 |
1307 |
286 |
5463 |
2875 |
179 |
1896 |
1038 |
||||
|
TH |
mg/l |
130 |
1195 |
663 |
130 |
2260 |
1195 |
95 |
625 |
360 |
||||
|
Na+1 |
mg/l |
49 |
469 |
259 |
43 |
1139 |
591 |
32 |
467 |
249.5 |
||||
|
K+1 |
mg/l |
4 |
196 |
100.00 |
7 |
74 |
40.50 |
4 |
383 |
193.50 |
||||
|
Ca+2 |
mg/l |
22 |
178 |
100 |
36 |
381 |
209 |
16 |
132 |
74 |
||||
|
Mg+2 |
mg/l |
11 |
182 |
97 |
10 |
319 |
165 |
13 |
72 |
43 |
||||
|
Cl-1 |
mg/l |
89 |
979 |
534 |
53 |
3085 |
1569 |
14 |
723 |
369 |
||||
|
SO4-2 |
mg/l |
10 |
432 |
221 |
19 |
394 |
207 |
5 |
303 |
154 |
||||
|
CO3-2 |
mg/l |
0 |
30 |
15.0 |
0 |
99 |
49.5 |
0 |
120 |
60.0 |
||||
|
HCO3-1 |
mg/l |
183 |
464 |
324 |
73 |
415 |
244 |
159 |
543 |
351 |
||||
|
NO3-1 |
mg/l |
0 |
129 |
64.5 |
10 |
112 |
61 |
6 |
175 |
90.5 |
||||
|
F |
mg/l |
0.82 |
2.98 |
1.90 |
0.42 |
3.94 |
2.18 |
0.2 |
5.65 |
2.93 |
||||
|
Parameters |
Unit |
Khamnor |
Kumbhalgarh |
Railmagra |
||||||||||
|
Minim-al |
Maxim-al |
Mea-n |
Minim-al |
Maximal |
Mean |
Minimal |
Maximal |
Mean |
||||||
|
EC |
µS/cm |
520 |
7080 |
3800 |
620 |
5650 |
3135 |
1080 |
8000 |
4540 |
||||
|
pH |
N/A |
7.6 |
8.4 |
8.00 |
7.8 |
8.4 |
8.10 |
7.7 |
9 |
8.35 |
||||
|
TDS |
mg/l |
275 |
3946 |
2111 |
317 |
3084 |
1701 |
555 |
4845 |
2700 |
||||
|
TH |
mg/l |
120 |
1905 |
1013 |
70 |
1580 |
825 |
185 |
1340 |
763 |
||||
|
Na+1 |
mg/l |
58 |
731 |
394.5 |
40 |
559 |
299.5 |
90 |
1316 |
703 |
||||
|
K+1 |
mg/l |
0 |
121 |
60.50 |
4 |
31 |
17.50 |
5 |
90 |
47.50 |
||||
|
Ca+2 |
mg/l |
16 |
405 |
211 |
6 |
136 |
71 |
20 |
224 |
122 |
||||
|
Mg+2 |
mg/l |
19 |
218 |
119 |
13 |
302 |
158 |
27 |
207 |
117 |
||||
|
Cl-1 |
mg/l |
78 |
2184 |
1131 |
64 |
1652 |
858 |
71 |
1744 |
908 |
||||
|
SO4-2 |
mg/l |
10 |
298 |
154 |
0 |
250 |
125 |
48 |
1249 |
649 |
||||
|
CO3-2 |
mg/l |
0 |
15 |
7.5 |
0 |
24 |
12.0 |
0 |
78 |
39.0 |
||||
|
HCO3-1 |
mg/l |
116 |
384 |
250 |
134 |
391 |
263 |
177 |
586 |
382 |
||||
|
NO3-1 |
mg/l |
4 |
149 |
76.5 |
0 |
63 |
31.5 |
25 |
175 |
99.5 |
||||
|
F |
mg/l |
0.36 |
1.52 |
0.94 |
0.3 |
4.61 |
2.46 |
0.67 |
3.76 |
2.22 |
||||
|
Parameters |
Unit |
Rajsamand |
||||||||||||
|
Minimal |
Maximal |
Mean |
||||||||||||
|
EC |
µS/cm |
1470 |
7000 |
4235 |
||||||||||
|
pH |
N/A |
7.6 |
8.8 |
8.20 |
||||||||||
|
TDS |
mg/l |
805 |
4083 |
2444 |
||||||||||
|
TH |
mg/l |
225 |
1550 |
888 |
||||||||||
|
Na+1 |
mg/l |
69 |
888 |
478.5 |
||||||||||
|
K+1 |
mg/l |
6 |
360 |
183.00 |
||||||||||
|
Ca+2 |
mg/l |
18 |
220 |
119 |
||||||||||
|
Mg+2 |
mg/l |
44 |
243 |
144 |
||||||||||
|
Cl-1 |
mg/l |
170 |
1773 |
972 |
||||||||||
|
SO4-2 |
mg/l |
62 |
1239 |
651 |
||||||||||
|
CO3-2 |
mg/l |
0 |
120 |
60.0 |
||||||||||
|
HCO3-1 |
mg/l |
153 |
683 |
418 |
||||||||||
|
NO3-1 |
mg/l |
0 |
218 |
109 |
||||||||||
|
F |
mg/l |
0.06 |
2.61 |
1.34 |
||||||||||
The results were compared with drinking water standards for the parameters like - Conductivity, pH, , Dissolved Solids-Total, Total Alkalinity Sodium, Potassium, Calcium, Magnesium, Chloride, Sulphate, Carbonate, Bicarbonate, Nitrate, Fluoride, and Total Hardness describe in table 2.
Table 2: Comparison of Ground Water Quality Data with Drinking Water Standard.
|
Sr. No. |
water Quality parameters and unit |
WHO International Standards 2017 guidelines |
BIS-10500:2012 |
Sample Range in Study Area |
||
|
Desirable Limit |
Maximum Permissible Limit |
Desirable Limit |
Maximum Permissible Limit |
|||
|
|
EC (µS/mg) |
1400 |
- |
- |
- |
360-9600 |
|
|
pH |
6.5 |
8.5 |
6.5 |
8.5 |
07.6- 9.0 |
|
|
TDS (mg/l) |
500 |
1000 |
500 |
2000 |
179 -5463 |
|
|
TH (mg/l) |
100 |
500 |
200 |
600 |
70-2260 |
|
|
Na+1 (mg/l) |
- |
200 |
- |
- |
32-1316 |
|
|
K+1 (mg/l) |
- |
12 |
- |
- |
00-383 |
|
|
Ca+2 (mg/l) |
75 |
200 |
75 |
200 |
6.0 - 405 |
|
|
Mg+2 (mg/l) |
50 |
150 |
30 |
100 |
10.0 -319 |
|
|
Cl-1 (mg/l) |
200 |
600 |
250 |
100 |
14-3085 |
|
|
SO4-2 (mg/l) |
200 |
400 |
200 |
400 |
62-1249 |
|
|
CO3-2 (mg/l) |
- |
- |
- |
- |
00-120 |
|
|
HCO3-1 (mg/l) |
- |
- |
- |
- |
73-683 |
|
|
NO3-1 (mg/l) |
- |
50 |
45 |
No Relaxations |
00-218 |
|
|
F (mg/l) |
0.5 |
1.0 |
1.0 |
1,5 |
0.82-5.65 |
Electrical Conductivity
As per the result obtained value of conductivity ranges minimum- 360 µS/cm (Anjana village of Deogarh tehsil) maximum -9600 µS/cm in Jujupura village of Bhimtehsil. Almost 90% of the samples exceeds the desirable limit of WHO drinking water standards. Higher concentration of acid, base and salts will be the result as higher EC3.Higher values of EC also indicate presence of dissolved inorganic substances in ionized form at higher level4.
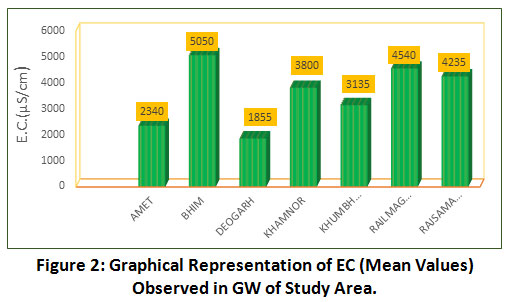 |
Figure 2: Graphical Representation of EC (Mean Values) Observed in GW of Study Area. Click here to view Figure |
pH
As per result of collected samples the pH value ranges between 7.6 pH atPasaoond Village ofRajsamandtehsil to 9.0 pH at Kuraj Village in Railmagaratehsil standard limit of pH for drinking water is 6.5 to 8.5 (BIS 10500 -2012). 90% of the water samples are well under the prescribed limit of drinking water specification except 10% of sampling station shows higher pH values. There is no direct impact of higher pH on human health but it regulates all the biological activities in the water however “higher pH values reduce the disinfection potential of the chlorine5.
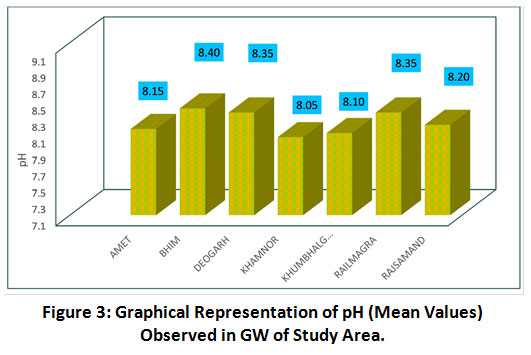 |
Figure 3: Graphical Representation of pH (Mean Values) Observed in GW of Study Area. Click here to view Figure |
Total Dissolved Solid (TDS)
As shown in table-1 values of the TDS ranges between 179 mg/l at Anjanavillage samplingstation to 5463 mg/l at Jujupurasampling station with the average value of 1410 mg/l, more than 90% of the sample results found beyond the desirable limit only few sampling station were found well within the desirable limit 6 reported that highervalues of TDS in ground water is due to leaching of salt from soil. As we earlier discussed unsystematic dumping cause leaching of mineral in ground water which leads to increase in dissolved solid in ground water of the nearby vicinity. Higher values of TDS (more than 1500 PPM) cause gastrointestinal irritation7. Earlier reported that the mean amount of TDS in groundwater samples that have been exposed to marble industrial wastes was much higher in comparison to control sample group and results compared with previous studies and found that the ground water is contaminated by marble industry waste products8.
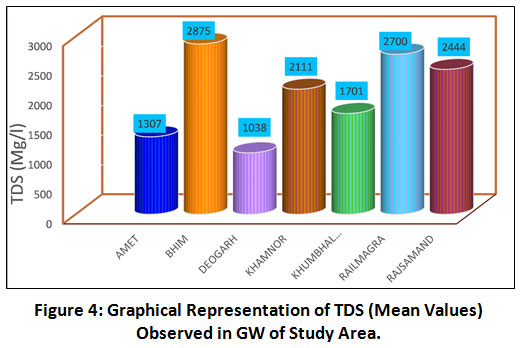 |
Figure 4: Graphical Representation of TDS (Mean Values) Observed in GW of Study Area. Click here to view Figure |
Total Hardness
From the analysis results it is found that total hardness ranges between -70 mg/l to 1905 mg/l, only 18% of the sample are below the desirable limit of BIS drinking water specification rest 78 of the samples were beyond the desirable limit that is 300 to 600 mg/l for drinking water and 70% water samples are below the permissible limit at boundary line. Higher values of soluble salt of Ca, Mg, carbonate and bicarbonate ions along with chloride and sulphate governs the water quality and make it unsuitable for drinking as well as potable use due to hard nature it may be temporary hardness or permanent hardness it depends on bonding of anions with Ca and Mg the ill impact of total hardness is stone formation in kidney and heart diseases9.
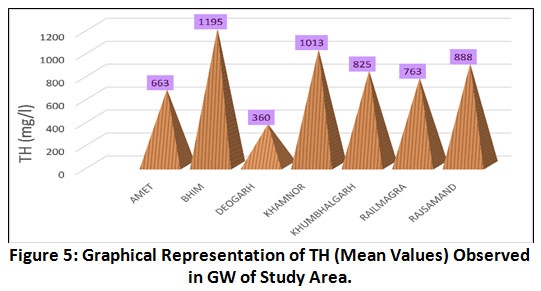 |
Figure 5: Graphical Representation of TH (Mean Values) Observed in GW of Study Area. Click here to view Figure |
Sodium (Na+1)
As we know in the order of element abundance Sodium is on sixth number and generally it found soluble form in natural water. Natural source of sodium in water is rocks and soils, Large amounts of sodium in combination with chloride give a salty taste. High concentration of sodium in water makes unsuitable for irrigation and sodium salts also responsible for foaming in steam boilers10 .The result obtained in the study area as describe in table 1 concentration of sodium in ground water samples found in the range of 32 mg/l at Anjana Village of Deogarh tehsil to 1139 mg/ l at Jujupra village of Bhimtehsil. Maximum permissible standard for sodium is prescribed 200 mg/l by WHO in drinking water. Result obtained from the analysed sample on an average 60% of the water samples found above the prescribed permissible standard. Water intake with high concentration of sodium may cause high blood pressure arteriosclerosis, oedema and hyperosmolarity6.
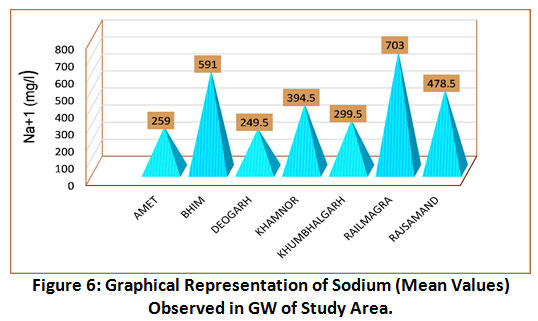 |
Figure 6: Graphical Representation of Sodium (Mean Values) Observed in GW of Study Area. Click here to view Figure |
Potassium (K+1)
According to present study concentration of potassium found lower than sodium except few locations result ranges from 0 mg/l at Nathdwara village in Khamnortehsil to 383 mg/l at Tal village in Deogarh tehsil. As per WHO maximum permissible standard limit for potassium in drinking water is 12 mg/l all the water sample exceed WHO maximum permissible standard limit in the sampling areas.
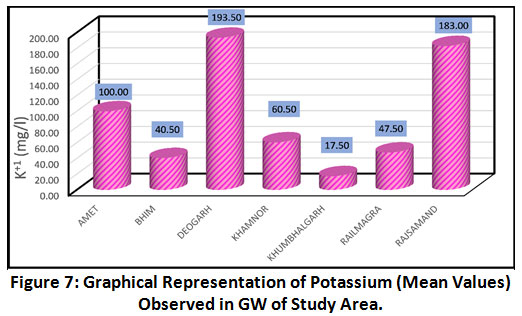 |
Figure 7: Graphical Representation of Potassium (Mean Values) Observed in GW of Study Area. Click here to view Figure |
Calcium (Ca+2)
According to present study and result obtained concentration of the calcium found in the range of 6mg/l at Kelwara village to maximum 405 mg/l at Koonchal village among all the sampling station around 60% samples exceed acceptable limit of BIS drinking water standardthat is 75 mg/l7 only 40 % sample found below the acceptance limit and 0 .5 % sample found beyond the maximum permissible standard limit of BISpotable water standardthat is200 mg/l7 consumption of higher concentration of calcium for prolong period lead to abdominal illness and make it unfit for domestic purpose due to its encrustations and scaling nature. In the sampling area higher concentration of Ca+2 is result of the leaching of mineral from marble mining and dumping areas in the ground water.
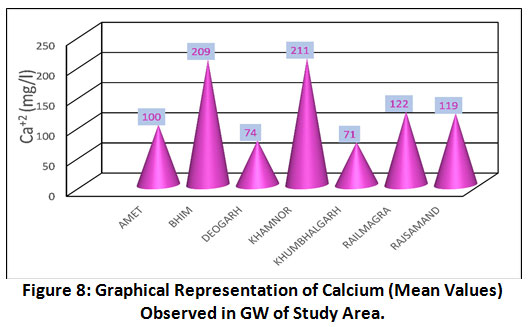 |
Figure 8: Graphical Representation of Calcium (Mean Values) Observed in GW of Study Area. Click here to view Figure |
Magnesium (Mg+2)
Magnesium is the most abundant mineral along with calcium, according to result obtained it found in the range of 10 mg/l at Padmela village to 319 mg/l at Jujupura village in the present study 90% of the sample found beyond the desirable limit pf BIS drinking water standardthat is 30 mg/l7 and 85 % of the water samples found below the maximum permissible standard limit of BIS drinking water standard which is 100 mg/l7higher concentration of the Magnesium is undesirable for domestic purpose as it is responsible for harness of the water.
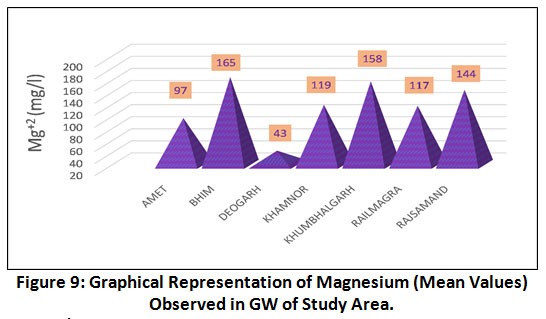 |
Figure 9: Graphical Representation of Magnesium (Mean Values) Observed in GW of Study Area. Click here to view Figure |
Chloride (Cl-1)
Chloride plays a vital role to identifying water quality, source of chloride in ground water may be weathering of rock, sedimentary rock leaching, domesticand industrial waste as well as fertilizers in agriculture filed. In the present study chloride found in the range of 14 mg/l at Anjna village to 3085 mg/l at Jujupuravillage however mean value found 784 mg/l for all stations. Desirable limit for chloride is 200mg/l as per drinking water standard given in 2012by Bureau of Indian standard and maximum permissible limit is 600 mg/l the study conducted shows only 37 % samples are under the presumable limit around 1-2 % samples found above the maximum presumable limit of BIS standard.
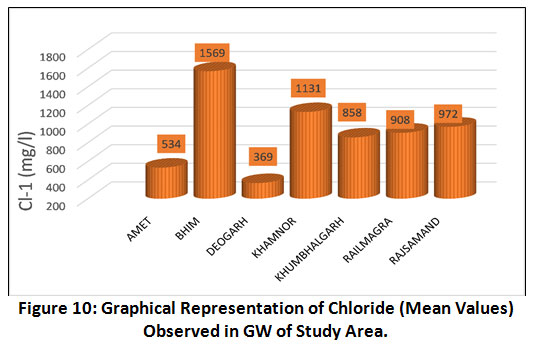 |
Figure 10: Graphical Representation of Chloride (Mean Values) Observed in GW of Study Area. Click here to view Figure |
Sulphate (SO4-2)
Sulphate Commonly present in mine water and in some industrial wastes, higher concentration of Sulphate has a laxative effect and combination with other ions, give a bitter taste10.Sulphate found in natural water in anion form as per BIS: 10500,2012 presumable limits for sulphate in potable water is 200 mg/l and 400mg/l is the maximum presumable standard in the absence of alternative source. Sulphate is measure by turbidity method by using nephelometer or spectrophotometer meter by using barium chloride and conditioning regent. In the present study sulphate foundbetween 0 mg/l to 1239 mg/l, among all the samples 75 % samples found below the permissible limit and 92% samples found under the limit of maximumpresumable standard limit for potable water. At few sampling stations shows high concentration of sulphate which may create scale formation in water pipes and may be gives piquant taste in water that can have a purgative effect on human health as well on livestock.
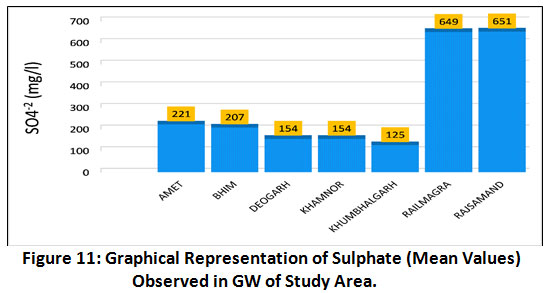 |
Figure 11: Graphical Representation of Sulphate (Mean Values) Observed in GW of Study Area. Click here to view Figure |
Carbonate (CO3-2)
The value of carbonate is found in the range of 0 to 120 milligram per litre among all the sampling station and mean value found 33 mg/l for all the stations. Almost 50% samples show nil values of carbonate only two sampling points indicate more than 100 mg/l of carbonate.
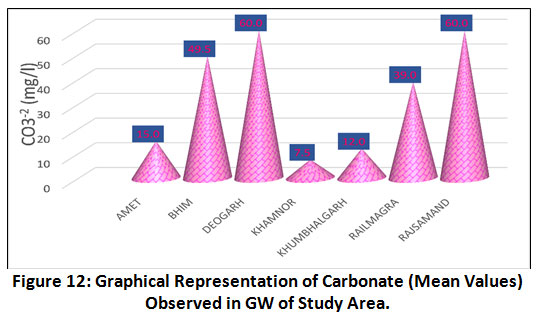 |
Figure 12: Graphical Representation of Carbonate (Mean Values) Observed in GW of Study Area. Click here to view Figure |
Bicarbonate (HCO3-1)
The present study stated that the concentration of bicarbonate ranges from 73 mg/ l at Jujpurato 683 milligram per litre at Bhatoli in Rjsamand Tehsil while mean value of all the samples was found 122 mg/l. (Stumm and morgan 1996) studiesthat dominance of mineral dissolution is responsible for higher concentration of bicarbonate in the ground water.
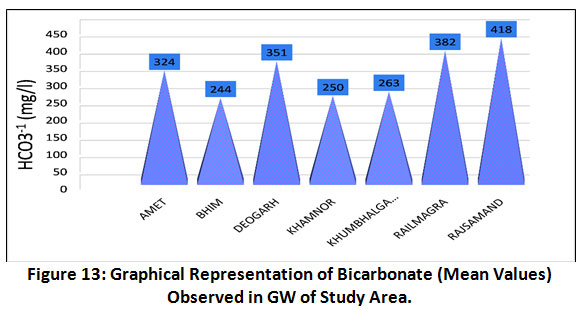 |
Figure 13: Graphical Representation of Bicarbonate (Mean Values) Observed in GW of Study Area. Click here to view Figure |
Nitrate (NO3-1)
As per the study conducted the range of NO3 found in the samples from 0 milligram per litre to 175 milligram per litre while permissible limit of nitrate as per BIS is 45 mg/l there is no relaxation in the standard presumable limit above 45 mg/l in potable water. 60% samples found within the permissible limit of drinking water standard and 40% samples exceed the permissible limit during study period it is already reported that higher concentration of the nitrate causes blue baby syndrome in child. Source of nitrate in ground water are fertilizer, domestic sewage and industrial waste.
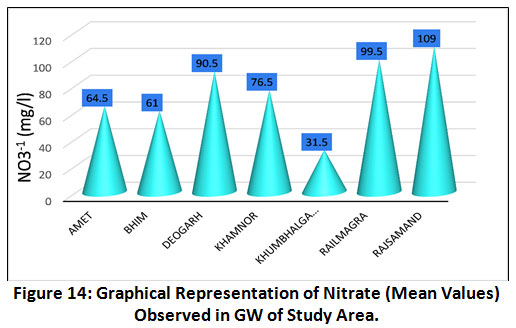 |
Figure 14: Graphical Representation of Nitrate (Mean Values) Observed in GW of Study Area. Click here to view Figure |
Fluoride (F)
In nature fluoride occurs in the form of fluorspar (fluorite), rock phosphate, triphite, phosphorite crystals climate is the major factor which control the presence of concentration of fluoride accessory minerals in the rock mineral assemblage through which the ground water is flow11In the present studies fluoride found 0.06 milligram per litre to 5.65 milligram per litre while mean value of all the samples were found 1.93 milligram per litre. as per BIS presumable limit for potable water for fluoride is 1 mg/l and maximum presumable standard limit is 1.5 milligram per litre from the result obtained it is indicated that 62% samples found within the presumable limit while 38% samples exceed the acceptable limit while 90% of the samples found within the maximum presumable limit significant source of fluoride in ground water is leaching, weathering of soluble fluoride. As per earlier studied excess fluoride cause dental, skeletal and non- skeletal fluorosis.
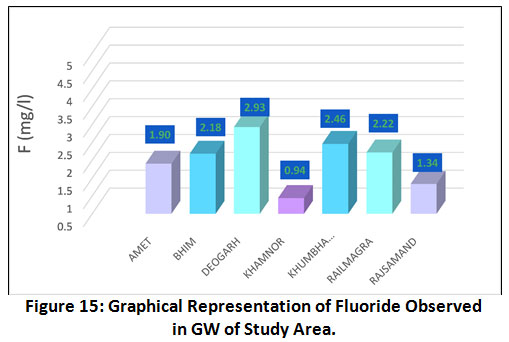 |
Figure 15: Graphical Representation of Fluoride Observed in GW of Study Area. Click here to view Figure |
Conclusion
Based on Sample collected and analysed it could be summarized that quality of the ground water is deteriorated due to marble mining and its allied activities in entire district, the measured criterion is Electrical Conductivity, pH, Alkalinity-Total, Dissolved Solids-Total, Sodium, Potassium, Magnesium, Calcium, Sulphate, Chloride,Carbonate, Bicarbonate, Nitrate, Fluoride, and Total Hardness. Obtained results indicated that the Contamination in ground water quality is the likely result of unsystematic dumping, of marble and processing waste and irregular and unplanned mining activities.Reported that Concentration of TDS, Hardness, alkalinity, calcium and sulphate including EC and pH has deteriorated due to the mining and its allied activities.12 Reported that leachates can enhance the dissolution of inorganic materials or substances such as chlorides, bicarbonates, sodium, sulphate and potassium content of water.13 reported that waste from marble industry destroying the ground water resources in the Zarqa Governorate, Jordan14
The overall water samples can only be suitable for drinking purpose after further necessary treatment. degradation in water quality will pose serious health hazard to the local people. 10As per the ground water atlas book 2013 all Seven blocks of Rajsmand district falls in over exploited zone it will cause serious water scarcity in near future.
As the entire district have ample number of small-scale marble units which causing serious environmental implications therefore it should be taken in note that actions should be taken to improve the water quality and action plan should be implement to improve water quality of the marble mining areas in the Rajsamand District it is suggest that ground water recharging with rain water could minimize the concentration of minerals and leads to raise the ground water level in area.
Acknowledgment
The first author of this paper expresses her sincere gratitude towards her guide Dr. Suraj Kumar Singh and Dr. Shruti Kanga, Co-ordinators of the Centre for climate change and water research, Suresh Gyan Vihar University Jaipur, for guidance during sampling and analysis of the samples and formulating the findings author also thanks to GMEC International for providing laboratory facilities. Mr. S S Rathore, a retired senior scientist of Centre Ground Water Board India, guided her during data interpretation.
Funding Source
No funding and financial support were received for this research work.
References
- Aremu M. O., et al (2011),,Electronic journal of Environmental Agricultural and Food Chemistry, 2011, 10(6), 2296-2304.
- SaranathanEt et al (2014) Inferences and influences on Groundwater Quality around Mining Environment as modeled through GIS, International journal of chemtech research vol 6 no 14 pp 5441-5449.
- Naik, P.D., Ushamalini, and Somashekhar, R.K. Ground water evaluation of stone quarry area. Journal of Industrial Pollution and Conservation, 2007; 23(1): 15-18.
- H. Manjunatha et al (2012): Qualitative Analysis of Subsurface Water Quality in ChallakereTaluk,Karnataka, India, The Journal Of Tropical Life Science vol. 2, no. 2, pp. 44 – 48, may, 2012.
CrossRef - Mohapatra TK, KM Purohit (2000) Qualitative aspects of surface and groundwater for drinking purpose in Paradeep area. Ecology of Polluted Waters. 1:144.
- S. V. Sarath Prasanth et al (2012) Evaluation of groundwater quality and its suitability for drinking and agricultural use in the coastal stretch of Alappuzha District, Kerala, Indi. Appl Water Sci (2012) 2:165–175.
CrossRef - Shankar, Muttukrishan (1994) In situ bioremediation of contaminated groundwater. Proceedings of National Seminar on EPCR-04, UBDT Engineering college. Davangere. 32.
- Muhammad Iqbal et al (2018) The effects of marble industries effluents on water quality in Swat, Northern Pakistan Journal of Biodiversity and Environmental Sciences (JBES) ,Vol. 13, No. 1, p. 34-42.
- Sastry KV, P Rathee (1988) Physico-chemical and microbiological characteristics of water of village Kanneli, (Dist. Rohtak) Haryana. Proc. Academic. Environmental Biology. 7(1):103-108.
- National Ground Water Association, USA, Groundwater Fundamentals
- Handa, B. K.:(1975) ‘Geochemistry and genesis of fluoride containing ground water in India’, Ground Water 13(3), pp 275–281.
CrossRef - Lamare R. Eugene et al (2014) : Degradation in Water Quality due to Limestone Mining in East Jaintia Hills, Meghalaya, India, International Research Journal of Environment Sciences Vol. 3(5), 13-20.
- E. Zanoni, et al,(1973). ?Potential for groundwater pollution from the land disposal of solid wastes,? Crit. Rev. Environ. Sci. Technol. Vol. 3, 1973, 225-260.
CrossRef - 16 Fakher J. Aukour et al (2008) Marble Production and Environmental Constrains: Case Study from Zarqa Governorate, Jordan Jordan Journal of Earth and Environmental Sciences Volume 1, Number 1, Pages 11 -21
- Indian Standard drinking Water — Specification: 10500(Second Revision) 2012.
- Stumm, M. and Morgan, J.J. (1981). Aquatic chemistry: an introduction emphasizing chemical equilibria in natural waters, 2nd edition. Wiley, New York
- WHO (2017) Guidelines for drinking water quality, World Health Organisation, Geneva.
- Hydrogeological Atlas of Rajasthan Rajsamand District 2013.
- Indian Minerals Yearbook 2016 (Part- III : Mineral Reviews) 55th Edition MARBLE (Advance Release) January 2018.
- APHA : Standard methods for the examination of water and waste water, 23rd Ed. Washington DC,2017.
- Indian Stannard for water and Waste water sampling and analysis IS: 3025 1988 (R subsequently).


