Climate Change and Agriculture in a Coastal Region: A Case Study of Betel Leaf Cultivation in Sagar Island, Kakdwip, South 24 Parganas
Samiran Das
*
 and Manjari Bhattacharji
1
Department of Geography,
Visva-Bharati, Santiniketan,
West Bengal
India
http://dx.doi.org/10.12944/CWE.18.1.32
Copy the following to cite this article:
Das S, Bhattacharji M. Climate Change and Agriculture in a Coastal Region: A Case Study of Betel Leaf Cultivation in Sagar Island, Kakdwip, South 24 Parganas. Curr World Environ 2023;18(1). DOI:http://dx.doi.org/10.12944/CWE.18.1.32
Copy the following to cite this URL:
Das S, Bhattacharji M. Climate Change and Agriculture in a Coastal Region: A Case Study of Betel Leaf Cultivation in Sagar Island, Kakdwip, South 24 Parganas. Curr World Environ 2023;18(1).
Download article (pdf)
Citation Manager
Publish History

Introduction
Climate change and its impacts are recognized as major global issue 1–9 not only among contemporary academicians and policy makers, but also among the common man. It was perceived and recorded conceptually by the intellectuals, scientists and academicians at first. This conceptual frame work was then tested and verified empirically on the basis of the analysis of long term rainfall and temperature data from various parts of the world 10–13. Predictions regarding the trend of climate change have also been attempted and made with the help of stochastic and computer aided simulation models 9,14–16. These sophisticated methods and the finer nuances of their findings are rather incomprehensible to the common man who neither has the expertise nor the access to such knowledge base. However, on the basis of their direct experience of the ground reality, (especially for those who make a living from the natural resource base like land, soil, water, climatic parameters), they authenticate and testify the tenability of the findings that are based on data obtained through elaborate instrumentation and analyzed through sophisticated techniques. This is because, the subtle and finer manifestations of climate change not only escape instrumentation but also are subject to large biases and sampling errors owing to incomplete data coverage especially in the 19th century and during the period of the World Wars 17. Additional or supplementary database may also alter results of previous studies as well. Some of these uncertainties or biases can be taken care of by recording the perception of the people of particular regions.
Therefore, in view of their complementarity, studies on the impact of climate change should be based on long term instrumentation based data analyses and an insightful study into the observations and perceptions of the people who are at the receiving end of these impacts.
The study area
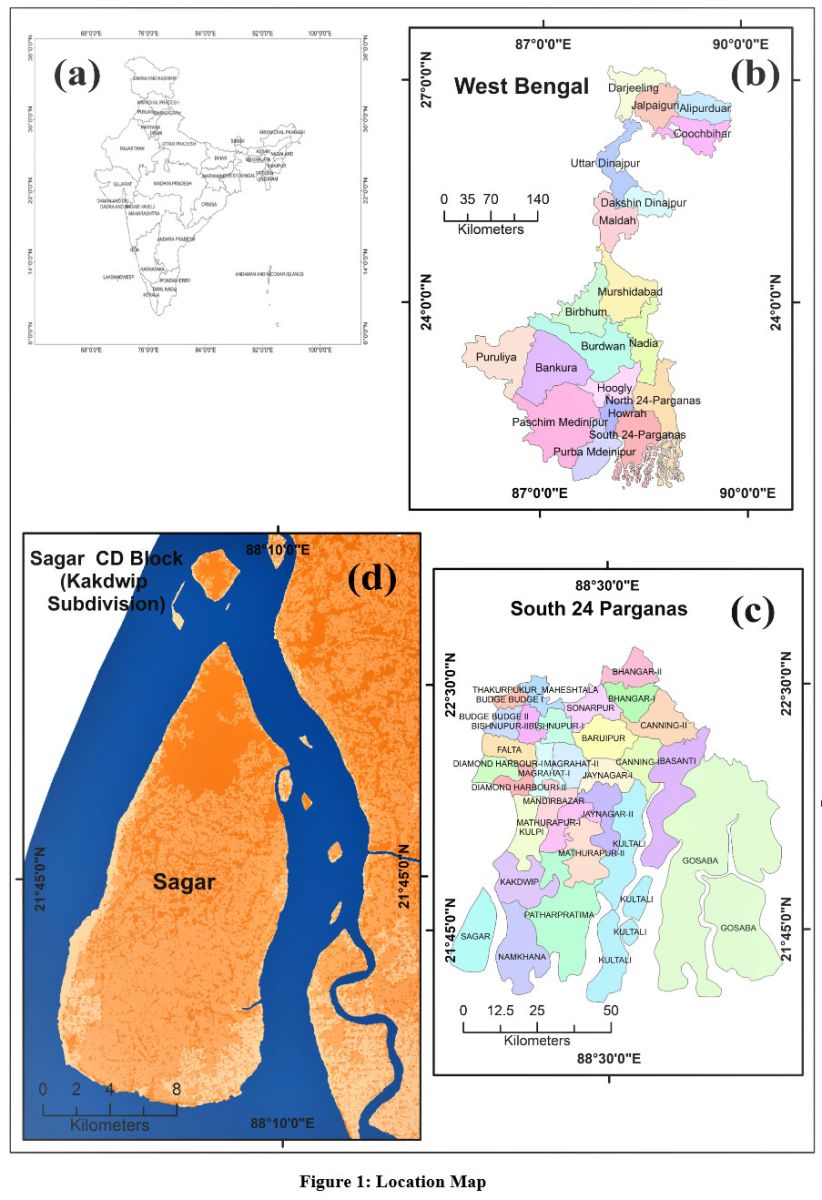
Sagar is a C.D. Block under Kakdwip subdivision, of South 24 Parganas district of the state of West Bengal in Eastern India (Fig.1). The study area, is a delta shaped island in the Hooghly estuary bounded by river Hooghly in the west and Muriganga -in the east. Southern portion of the island face the Bay of Bengal (BoB). It is an area of active delta formation of river Ganga and experiences a flood and an ebb tide in a single day of approximately 12 hours cycle. 18–20. The island is traversed by a number of salt water creeks which allows the salt water to enter deep within the island territory.
 | Figure 1: Location map
|
Being situated on the verge of Bay of Bengal, this area experiences severe wind turbulence during the summer and monsoons. During the storm surges, the tidal creeks act as an active way of salt water influx deep within the territory. This phenomenon increases the pH level of the soil which makes the land particularly less suitable for cultivation of sensitive crop like betel vine. Besides, the area lies within the pathway of tropical cyclone formed in the BoB and Indian Ocean and makes it first to experience highest capacity of any hazard caused by tropical cyclone like- storm surges, inundation and wind related destruction. This renders the region physically vulnerable. However the social vulnerability of the local population also needs to be mentioned. 18,21–24
DEM (Digital Elevation Model, derived from ASTER GDEM, Version 2) analysis by the authors reveals three distinct topographic characteristics (Fig. 1 (d)). The northern part is relatively older than the southernmost part of the island. Hence this area is also relatively higher than the rest of the island. Average height remains more than 10 m in this part of the island. The southern portion is highly active in nature and rapidly altered by the long shore current and seasonal tidal rushes 25–27. Because of that, distinctive patches of low lying mud flat zones can be seen in this segment of the island. Average height remains below 5m in this portion, whereas middle portion of the island is moderately high and remains 7-10 m above MSL (Mean Sea Level). This entire area is composed of soil from Holocene epoch, primarily composed of silt-clay and fine sand 25.
The primary manifestation of climate change in the form of sea level rise and flooding are obvious and apparent in the topographically low lying coastal areas. It is also manifested through increased frequency of severe weather phenomena. Sagar Island, located in Kakdwip sub-division with its geographical characteristics as described above, is therefore an ideal location to assess the impact of climate change on major economic activity-(IPCC, 2018: Summary for Policymakers, B.2.3, pp.8) 21,28–33.
Betel leaf cultivation in Sagar Island
Weather and climate remain the principle dominant factors for agricultural productivity till today. Changes in climatic parameters alter the productivity dramatically, leading to large scale famine, shortfall in production etc8,9,30. However these effects are rarely isolated but have a large scale impact since the international trade connects the entire globe in terms of food and economy. Any impact on the agricultural crop of certain region will lay effect on other parts of the world as well 34. These facts indicate the entangled relation between agriculture, climate and the world food production and security and necessitate the study of impact of climate change on agriculture on global context rather than as an isolated phenomenon.
It is in this context, the authors have delved into the various dimensions of betel leaf cultivation in Sagar Island of Kakdwip sub-division. Betel leaf is one of the major cash crops in this environmentally and geographically marginalized location that is particularly vulnerable to even the slightest positive changes in sea level 35–37.
Database and Method
The dataset used for the analyses are temperature and rainfall are the 100 year data as per the record of Indian Meteorological Department (here in after abbreviated as IMD). The data pertains to the period for 1901 to 2000, while the data for the period after that has not been incorporated. This is because the 100 year data set pertains to site specific station data (Station-Sagar Island), while from 2000 onwards site specific station data are not given in public domain. The data available in the public domain is the interpolated data. Station data is more reliable for site specific microclimatic parameters. And since the site specific data covers a longer period of time, this has been incorporated in the study and the generalized interpolated data has been avoided for data incompatibility and to avoid over generalization of the findings that runs the danger of misrepresenting the reality.
Therefore, the two principal methods in the present study are -
Analyses of the secondary data base of temperature and rainfall.
Recording the observations and perception of local people on the climate change manifestations on betel leaf cultivation to overcome lack of empirical findings on the likely and probable impact of climate change on the productivity and quality of betel leaf in the study area. (It is pertinent to mention here that conceptually and theoretically the worldwide change in climatic parameters and their impact on agriculture are likely to be reflected in the microclimate of smaller areas, particularly those located in the low lying coastal study area.) To fulfill this objective, the following design of a structured questionnaire has been framed and used.
Design of perception Survey
Specific target group of respondents who have been engaged for 3 generation at a stretch were chosen for the survey belonging to the following age groups
Persons above 65years of age
Persons between 30-65 years of age
Persons below 30
The premise for the selection of the first age group of respondents is that they are witness to the pre and post climate change scenarios.
For the perception survey sixteen villages have been selected for the purpose to gain a complete spatial coverage of the phenomenon. Then 5 respondents have been selected from each sample villages for structured questionnaire survey. This design is further elaborated toward the end section of this paper for better comprehension. The survey was conducted during 2018-19 period.
Evidences of climate change in the study area
As already stated climate change in the study area has been ascertained on the basis of analysis of the 100 year data on temperature and rainfall obtained from IMD.
Air temperature
Mishra (2010), in Chand. et.al. 38 analyzed the air temperature data from 1891-2003 (110 years) for Sundarban region. He reports that, for the first 80 years (1891-1970), the average daily minimum temperature increased by 0.6 degree Celsius and the average daily temperature increased by 0.1 degree Celsius. His findings further reveal that after 1970 the increasing trend is more marked up to 2000. During this period a faster rate of rise of the daily minimum temperature is noted compared to that of the daily maximum temperature, resulting in the gradual decrease in diurnal range. 23 He reports that the rate of rise of average air temperature stands at 0.019 degree Celsius between 1970 up to the year 2000. He further opines that if this trend continues, the air temperature in this area is expected to rise by 1 °C by 2050.
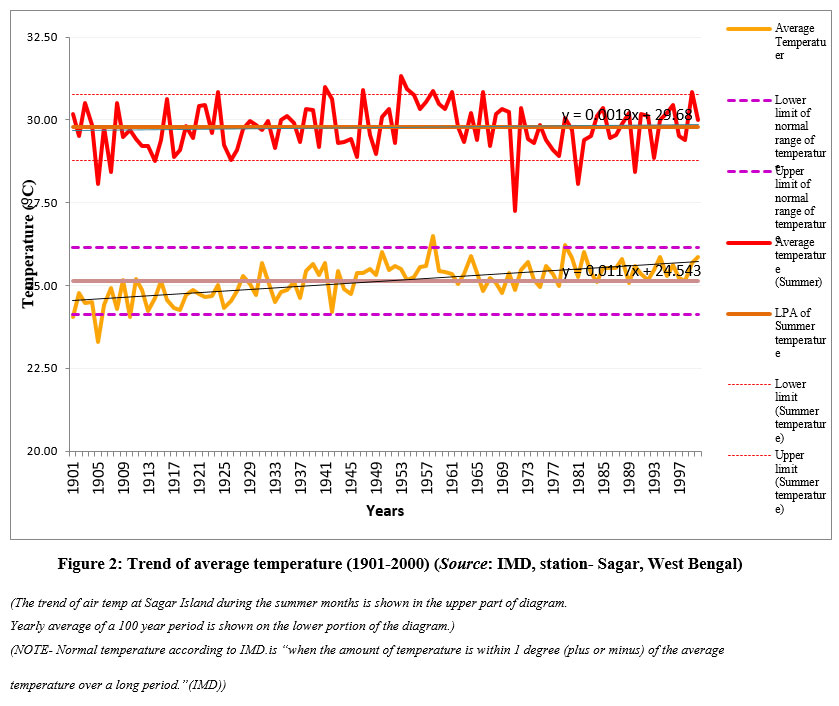
 | Figure 2: Trend of average temperature (1901-2000) (Source: IMD, station- Sagar, West Bengal).
|
(The trend of air temp at Sagar Island during the summer months is shown in the upper part of diagram.
Yearly average of a 100 year period is shown on the lower portion of the diagram.)
(NOTE- Normal temperature according to IMD.is “when the amount of temperature is within 1 degree (plus or minus) of the average temperature over a long period.”(IMD))
Temperature data from 1901 to 2000, analyzed by the author also corroborate the above observations. This is shown in Fig. 2. In the upper portion of the graph (Fig. 2), the 100 year average temperature of the summer months from 1901 to 2000 has been plotted. Regression line of the temperature (depicted through the black line) reveals a rising trend of temperature in general. On an average, the temperature is within the IMD defined normal limits. Fluctuations of temp from the normal limits as per IMD criteria are noted except in 1971,1981,1990 when the recorded temperature are below the lower limit of as per IMD specifications. Only in the 1950s the temperature exceeds or is closer to the IMD defined normal upper limit of summer months’ temperature.
The 100 year average annual temperature from1900-2000 shown in the lower portion of the graph (Fig. 2) also reveals a rising trend of temperature like the summer months. Fluctuations of temperature from the normal limits as per IMD criteria are noted only for the summer months when negative deviation is noted of the years 1971, 1981, 1990 during which one two/three years where the deviations are beyond the normal. In either case, the fluctuation of temp is within normal limits except two or three deviations beyond the normal (for summer temperature deviation, showing below normal for the years- 1905, 1907, 1971, 1981 & 1990). The rising trend of temperature as given in the above diagram is commensurate with the findings of Hazra et al.23.
Temperature data has been analyzed in terms of the criteria as incorporated in Table 1. For analyses of the Temperature data have been analysed in terms of the criteria stated in Table 1.The normal limits of maximum and minimum temperature have been determined as per the criteria laid down by IMD. The findings show that the both the parameters are within the normal limits (Table 1) as per IMD specifications.
Table 1: Criteria for temperature data analysis.
Sl. No. | Parameters | Average Temperature/LPA (Long Period Average) (oC) | Calculated Normal range of Temperature | ||
Average temperature (oC) | Maximum limit of temperature (oC) | Minimum limit of temperature (oC) | |||
1. | Trend of 100 year average temperature | 25.14 | 24.14 to 26.14 |
|
|
2. | 100 year average maximum temperature | 31.54 |
| 32.54 | 30.54 |
3. | 100 year average minimum temperature | 21.41 |
| 22.41 | 20.41 |
4. | 100 year average summer temperature | 29.78 |
| 30.78 | 28.78 |
The trend line of the temperature plotted for both the cases (summer and yearly temperature) reveals a rising trend. Fluctuations of temp from the normal limits as per IMD criteria are noted only for the summer months when negative departure is noted of the years 1971, 1981, 1990. The rising trend of temp as given in the above diagram is commensurate with the findings of Hazra et al. 23
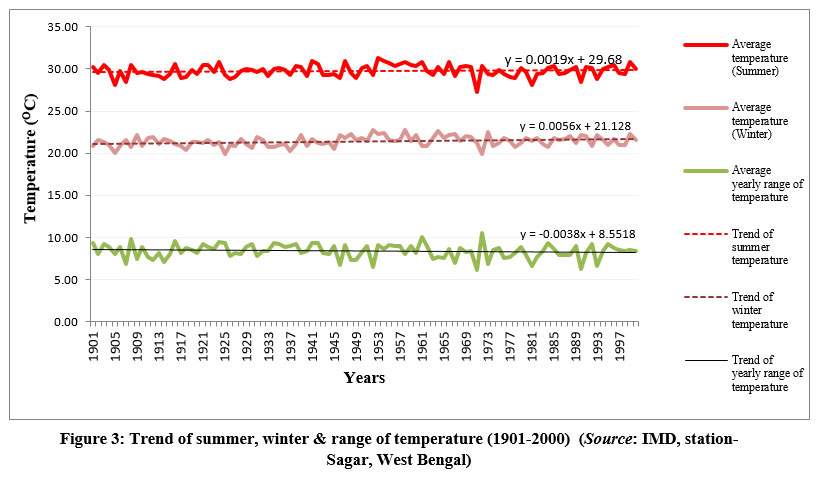
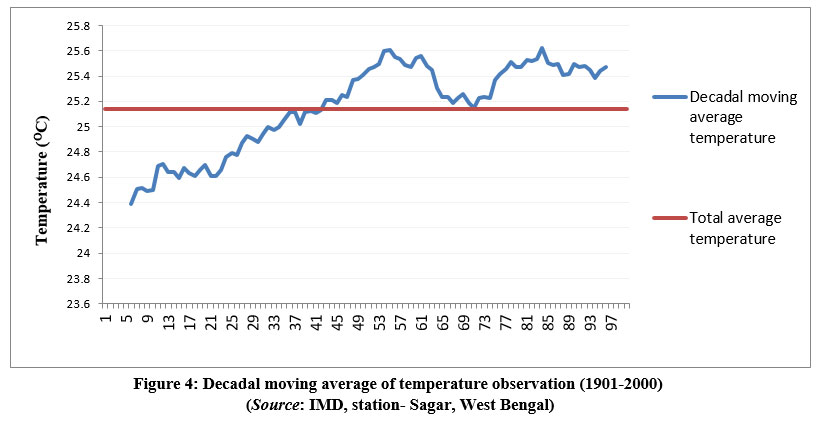
In the next figure (Fig. 3), the average summer temperature, average winter temperature and average yearly range of temperature have been plotted. From the figure, it is seen that both the maximum and the minimum temperature are rising. However the rate of rise of the winter temperature is greater than that of the summer temperature (the slope factor being 0.0056 and 0.0019, respectively). This indicates decrease in the annual range of temperature, which is evident from the trend of temperature range with a slope factor of -0.0038. Indirectly again this indicates warming of the atmosphere in this region. Analysis of decadal moving average also reveals similar increasing trend (Fig. 4).
 | Figure 3: Trend of summer, winter & range of temperature (1901-2000) (Source: IMD, station- Sagar, West Bengal).
|
 | Figure 4: Decadal moving average of temperature observation (1901-2000) (Source: IMD, station- Sagar, West Bengal).
|
After that the temperature has been forecasted for 30 years (up to 2030) based on 100 years data to statistically verify that the trend is persistent. This is done by fitting an ARIMA model in R software using the auto ARIMA function. While fitting the ARIMA model, stationarity and seasonality of the sample data has been considered to make the prediction more accurate.
Two popular methods for checking the stationarity has been applied here viz. ADF test (Augmented Dickey Fuller Test) and KPSS test (Kwiatkowski-Phillips-Schmidt-Shin test). ADF test checks for presence of unit root in the data series to prove its stationarity. Null hypothesis (H0) of ADF test considers that there is a unit root present in the series & the series is there by non-stationary. A non-stationary time series data is non-cooperative for forecasting. The KPSS test also checks the stationarity, but here the null hypothesis (H0) is opposite of ADF test i.e. there is no unit root in the series & it is stationary. Detailed information about the parameters for selection of the best fitting ARIMA model is given in Table 2.
Table 2: Comparison between ADF & KPSS test for ARIMA model fitting.
Parameter | ADF test | P value | KPSS test | P value | Hypothesis | AIC | BIC |
Temperature | -9.0895 | 0.01 (P value smaller than printed) | 0.10924 | 0.1 (P value greater than printed) | Data series is stationary | 2928.877 | 2954.23 |
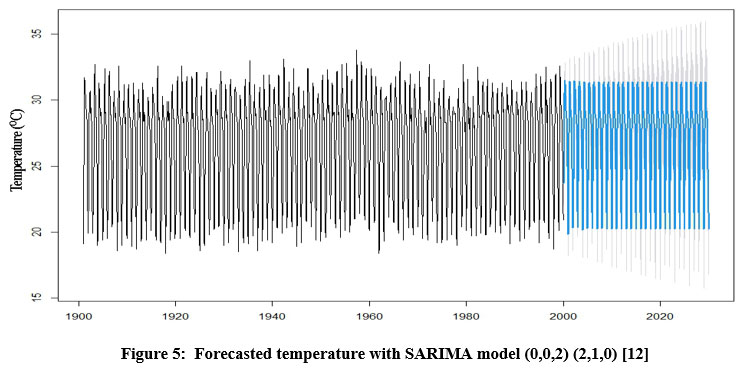
In selecting the ARIMA model, least AIC & BIC value is considered as best fitted. After running the auto ARIMA function in R, the function gives the (p,d,q) as (0,0,2) and seasonal component (P,D,Q) as (2,1,0) with a lag order of 12 as the best fit model (i.e. with the least AIC & BIC value) 39–41. The fitted Seasonal ARIMA model (SARIMA) also predicts similar trend of temperature for the predicted time period (Fig. 5). This confirms the variability of climatic parameters and shows that temperature will continue in the same trend as of previously discussed.
 | Figure 5: Forecasted temperature with SARIMA model (0,0,2) (2,1,0) [12].
|
Rainfall and monsoon pattern
Mishra, (2002) studied the monsoon pattern for the period 1891-2000 and reported delayed onset of monsoon with the withdrawal date remaining almost the same, causing a reduction in the span of monsoon. Study of last 110 years rainfall data (1891-2000) of Sager Island based on World Meteorological Organization recommended method of trend study of 30 years successive mean shows an increasing trend during the last three successive mean periods. [Mishra, (2002) in 38]
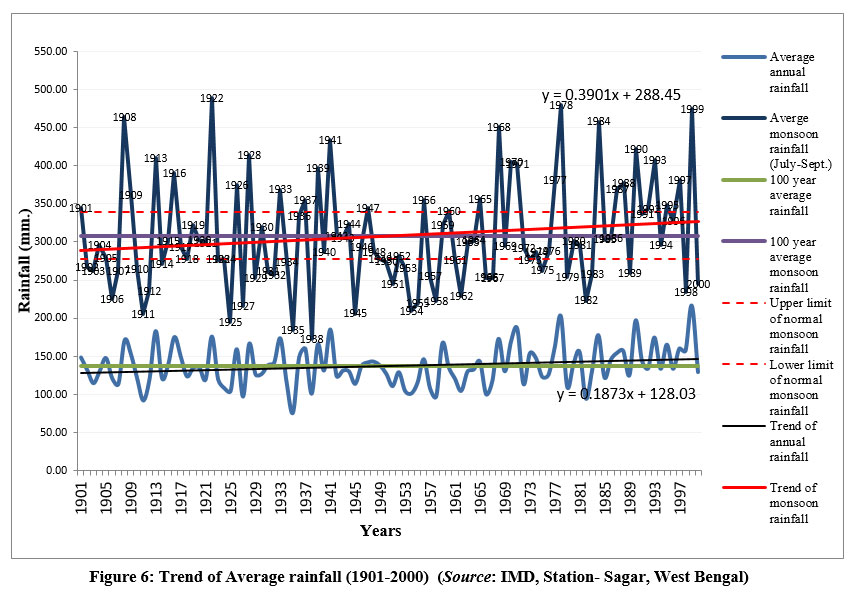
Chand et al. (2012) reports that the earliest date of onset of monsoon was noted on 25th May, 2009 and the most delayed onset of monsoon occurred on 26th June, 1983. Therefore, the largest deviation in the dates of onset and recession of monsoon occurred within a period of 25 years indicative of recent climate change in terms of uncertainties of weather phenomenon. The rainfall and monsoon pattern analyzed by the author is presented in Fig. 6. Two dimensions of the rainfall data (annual average and monsoon month’s average) have been analyzed to detect the trend of rainfall amount in terms of the following criteria.
Departure of average yearly rainfall from 100 years’ mean rainfall (1901-2000).
Departure of average yearly rainfall from IMD defined normal annual rainfall.
Trend of average rainfall of monsoon months for 100 years period (1901-2000).
Departure of monsoon month’s rainfall from IMD defined normal rainfall for monsoon months.
 | Figure 6: Trend of Average rainfall (1901-2000) (Source: IMD, Station- Sagar, West Bengal).
|
The following observations are noted
In the first 40 years of observation 16 years have had excess rainfall, till 1944. And 18 deficit years of monsoon rainfall and rest 11 years having within normal range.
Predominance of deficit rainfall is noted through 1948-1967.
During 1968-2000, 16 years have had excess monsoon rainfall, 8 years have had deficit monsoon rainfall, and 9 years have had normal monsoon rainfall. There for, on an average the rainfall has a fluctuation pattern, however in the first 40 years the fluctuation is symmetric with 16 years of excess and 16 years of deficit rainfall with a recurrence period of 2-3 years for both. For the last 32 years the fluctuation is asymmetric with 16 years of excess monsoon rainfall and 8 years of deficit monsoon rainfall.
From 1968 onwards, the recurrence of excess monsoon rainfall years is decreasing so much so that excess rainfall occurred in every alternate year.
Further insight into the rainfall amount shows that in the first 44 years the rainfall amount exceeded 400mm for 5 years; while from 1968 to 2000 the rainfall exceeded 400 mm. for 8 years.
Further analysis shows that in the former period rainfall exceeded 450 mm. for two years while in the later it exceeded 4 times in 30 years. This bears a correspondence between the rising trend of temperature and complementary occurrence of rise in the amount and frequency of rainfall.
(NOTE- Normal monsoon rain fall according to IMD.is “when the total amount of rainfall in the country between June and September is within 10 percent (plus or minus) of the average rain over a long period. 'Deficit rainfall' is when it drops below the margin of 10 per cent of the average. 'Excess rainfall' is when it exceeds the average by more than 10 per cent.”(IMD))
From the Fig. 6, large fluctuations in the amount of average yearly rainfall are noted. Between 1901-1945, events of excess and deficit rainfall predominate. The same trend in the amount of rainfall is noted from 1968-2000. An important observation in the trend of fluctuation is that in the former period alternate years of excess and deficit rainfall are noted; while in the latter, events of excess rainfall predominate. The period in between these two, that is from 1945-1967 is also noted for predominance of deficit rainfall. On the whole we find regularity in the nature of fluctuation from 1901-1945, while the deviations are irregular thereafter.
Trend of fluctuation is noted in the departure of annual average rainfall from the 100 year rainfall till 1944, followed by predominance of deficit rainfall till about 1967, there after excess average annual rainfall from 100 year average predominates till 2000. This is also reflected in the decreasing range of monsoon rainfall as depicted in the Fig. 6. Deviation of annual average rainfall of the individual years from the 100 year average rainfall shows the same trend as that of the monsoon months. From Fig. 7 it is observed that the minimum monsoon rainfall remains almost the same, while maximum rainfall shows an increasing trend with a slope factor of 0.083x and 0.710x respectively. This is the proof of increasing rainfall and an evidence of climate change in the area.
 | Figure 7: Trend of maximum and minimum monsoon rainfall (1901-2000) (Source: IMD, station- Sagar, West Bengal).
|
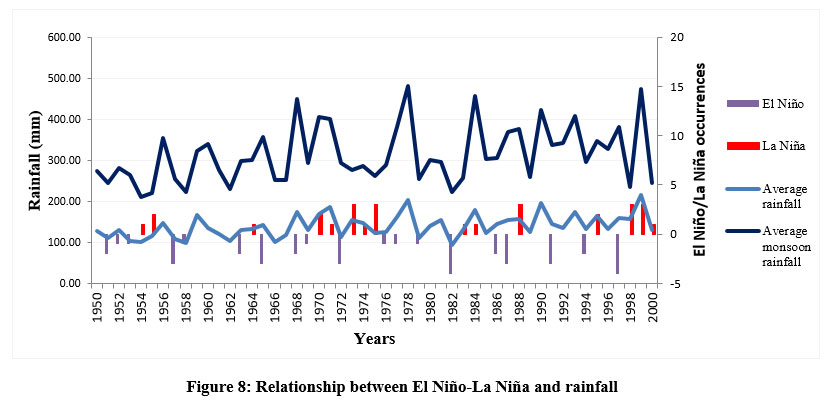
Whether the extended period of deficit rainfall is related to teleconnections like El Niño and La Niña years; and the years of excess rainfall to that of incidences of cyclonic storms in the study area, demands in depth examination; which however is beyond the scope of this paper. Thus simple enquiry has been made to understand the relation between the extended deficit in rainfall and such teleconnection, if any. Fig. 8 reveals that there is no such evidence to support the direct correlation between the teleconnections and rainfall.
 | Figure 8: Relationship between El Niño-La Niña and rainfall.
|
As in the case of temperature data, a rainfall forecast for 30 years (up to 2030) based on 100 years data, has been attempted. to statistically verify whether the current trend of rainfall pattern is persistent or not, using the auto ARIMA function in R. Detailed information about the parameters for selection of the best fitting ARIMA model for rainfall forecasting is given in Table 3. ARIMA model with least AIC & BIC value is considered as best fitted. After running the auto ARIMA function in R, the function gives the (p,d,q) as (0,0,0) and seasonal component (P,D,Q) as (2,1,0) with a lag order of 12 as the best fit model (i.e. with the least AIC & BIC value) 39–41. The fitted Seasonal ARIMA model (SARIMA) also predicts similar trend of rainfall for the predicted time period (Fig. 9). This confirms the variability of climatic parameters and shows that rainfall will continue in the same trend as of previously discussed.
Table 3: Comparison between ADF & KPSS test for ARIMA model fitting.
Parameter | ADF test | P value | KPSS test | P value | Hypothesis | AIC | BIC |
Rainfall | -12.563 | 0.01 (P value smaller than printed) | 0.16421 | 0.1 (P value greater than printed) | Data series is stationary | 14271.23 | 14286.44 |
 | Figure 9: rainfall Forecast with SARIMA model (0,0,0) (2,1,0) [12].
|
Extreme weather events (CS/SCS)
Among all the extreme weather events those which are prominent here are CS (cyclonic storms), SCS (super cyclonic storms) and D (depressions). Like in the case of air temperature and rainfall, analysis of the frequency and time of occurrence of the extreme weather events relevant to this area have been done by several other authors. Their findings are given in Table 4.
Table 4: Average frequency of extreme weather events. (Source: Cyclone e-atlas, IMD; In: Chanda (2012)
Para meters | Period of occurrence | ||
1891-1930 | 1931-1970 | 1971-2010 | |
Depression | 5.40 | 8.83 | 5.35 |
Cyclonic Storms | 3.33 | 2.5 | 1.98 |
Super Cyclonic Storms | 1.6 | 1.98 | 2.05 |
Mishra (2002) in 38 studied the influence of frequency of extreme weather events for the period of 80 years (1891-1970) upon the distribution of rainfall in Sundarban and the adjoining coastal areas and reports that they have a direct bearing on the amount of rain fall. He further reports that up to 1922 the frequency of such systems were mostly below the average, but after 1922 there has been a considerable increase in the frequency of occurrence of such systems particularly up to 1953 and after 1964. Eight tropical storm systems develop over the Bay of Bengal each year which directly affect total rainfall received in this region, he adds.
The extreme weather events considered 38 here are Depressions, Cyclonic storms, and Severe Cyclonic Storms. His study suggests that in the last few decades, extreme weather events have become more frequent and powerful although there is a reduction in total number overall. This is reflected in the increasing trend in the amount of rainfall. Singh 42 opines that Severe Cyclonic Storms during post monsoon season, over the Bay of Bengal have increased by 26% since 1891.
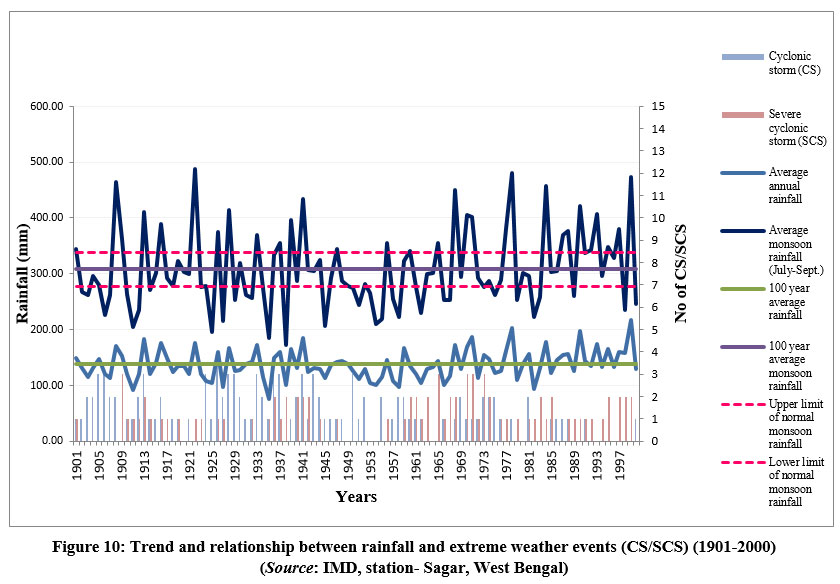
The authors have analyzed the relation between rainfall and these extreme weather events for the period 1901 to 2000. The findings are presented in Fig. 10. Data has been analyzed in terms of the possible correspondence, if any, between the occurrence of Cyclonic Storms (CS) and Severe Cyclonic Storms (SCS) for the 100 year period (since Depressions does not has any direct bearing on Betel cultivation, it has not been analyzed) and excess monsoon months’ rainfall and average annual rainfall (1901-2000). From the data it can be seen that on an average 2 such events have occurred per year.
 | Figure 10: Trend and relationship between rainfall and extreme weather events (CS/SCS) (1901-2000) (Source: IMD, station- Sagar, West Bengal).
|
Accepting this as normal we have picked up the years in which more than 2 such events have occurred and regarded them as years of extreme weather events. Analyzing the data on the amount of excess average annual rainfall and that of the monsoon months corresponding to these years shows that 31 out of 100 years have experienced extreme weather events in the form of CS/SCS. Out of those 31 years, 14 years shows clear coincidence between the occurrence of extreme weather events, average annual rain fall and the monsoon months’ rainfall.
However, generalization regarding this cannot be made because the data pertains to only one point (i.e. station Sagar) therefore the occurrence of CS/SCS and its correspondence with above normal rainfall cannot be reckoned with as a significant manifestation of climate change at this location. It is for this reason we have only considered rainfall and temperature as a major parameter of climate change to assess its impact on betel leaf cultivation over time in the study area.
Impact of climate change on betel leaf cultivation
Reports of yield loss from various parts of Africa, due to global change in rainfall and temperature for the period 1958 to 2013 are reported by Benjamin et al 8,43. Parry 9 states that yield decreases in climate change scenario are noted especially in situations where adaptation practices are not adopted. In Climate change scenario with type 2 adaptation, increase in yields is reported (Components of type 2 adaptation involve substantial change to agricultural systems possibly requiring resources beyond the farmer’s means. These include- large shifts in planting date, increased fertilizer application, development of new varieties; and installation of irrigation systems) 9.
Among the four components of type 2 adaptation- application of fertilizer and installation of irrigation (improvised traditional) system are directly applicable in the study area. The remaining two are not applicable. But one unique local adaptive structure (locally called “Boroj”) that creates an artificial micro climatic unit is notable here. This is discussed subsequently. Apart from that, soil treatment within the boroj (vine yard) is practiced in the study area to make it suitable for cultivation.
(Type 2 adaptive strategy practiced in the study area)
Soil treatment
Given the geographical location, the study area is characterized by regular inflow of brackish water. Especially during the storm surges, the tidal creeks act as an active way of salt water influx deep within the territory. This phenomenon increases the pH level of the soil (Fig. 11) which makes the land particularly less suitable for cultivation of such highly sensitive crop like betel vine. Salinity is detrimental to betel leaf. Soil salinity puts negative impact on betel leaf by simply checking its growth. 35,37,36
 | Figure 11: Soil map of Sagar, (Source: NATMO District Planning Map Series).
|
In spite of that, the successful commercial cultivation of betel leaf in study area is ensured by radical treatment of the soil of the vineyards. This creates a sharp difference in soil characteristics between the area within and outside the boroj. This treatment is done whenever the boroj needs to be re-prepared or rejuvenated, which is generally done every 5 years or so, which is the mean expected viable longevity of the vines. The soil treatment involves the following phases.
In the first phase the local soil is dugout up to a depth of one to two feet and replaced with the soil obtained from areas which are free from salt water incursion. Then the ex situ soil is reworked with compost and oil cakes. Then the soil is flattened and compacted and left under plastic cover for 30 days. Within this time the soil is uncovered after 15 days and reworked again with formalin and covered with plastic sheets. This process is repeated again for the final time after 15 days and left for another 5-10 days until the soil is ready for betel vine plantation. In the next phase the soil is treated with organic and inorganic components. While organic manures include compost, oil cakes etc. Inorganic components comprise formalin, bleaching powder etc.
Fertilizer
Fertilizer (chemical and organic fertilizer) consumption for betel leaf cultivation is shown in Fig. 12. In the X-axis number of betel vine has been shown, representing the size of the land holdings of farmers. Y-axis shows the amount of fertilizer used in terms of money spent for the same for better comprehension. From Fig. 12, it is clear that there is almost en exponential increase in the application of fertilizer that must have maintained the steady increase in the productivity of betel leaf despite the unfavorable geography and imperceptible rise in temperature, during the period of observation. This conforms to the efficacy of the adoption of adaptation level 2 (application of fertilizer in this case.)
 | Figure 12: Change in fertilizer consumption for betel leaf cultivation in Sagar, (Source: Primary survey).
|
Irrigation
Irrigation is comprised of aquifer fed perennial dug-out, unlined tanks attached to individual vineyards. Only in some cases individual tanks are absent beside vine yards. In such cases informal arrangements of common use of such tanks by surrounding vine yards are done. Irrigation is required throughout the year. It is manually sprinkled on the creepers once a day on a daily basis. However, in the rainy season, depending on the weather condition the schedule changes. Irrigation is attached to the vine yard and could be found in the study area only in the form of tanks.
Boroj (Vine yard) preparation
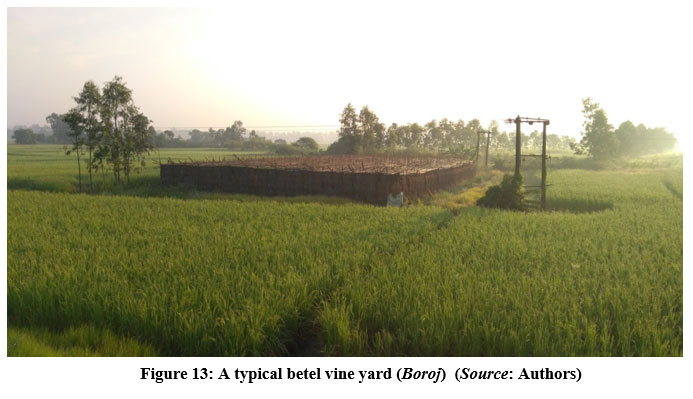
Boroj is an indigenously developed artificial structure to regulate insolation, temperature and humidity and to provide a protective structure (Fig. 13) to the betel vine from the very strong winds associated with extreme weather events (CS & SCS). It is an indigenous adaptive method to create congenial micro climatic environment for betel leaf cultivation. It houses the betel vines. Traditionally boroj is made from bamboo, sticks, coconut leaves and straw. Bamboo and sticks help the structure of the boroj to stand and hold in its position. On the other hand straw and coconut leaves provide shade, from scorching heat, necessary for betel leaf. 35,37,36. Straw and coconut leaves provide shade to the vines and at the same time keeps the inner temperature cooler by allowing wind to pass through. Betel vine grows well in shades rather than direct sunlight. So in summer time, when the temperature is higher, the shade, specially the roof is thickened by adding some extra layer of thatch.
 | Figure 13: A typical betel vine yard (Boroj) (Source: Authors).
|
 | Figure 14: A betel vine yard (Boroj) made with ‘Shade net’ (Source: Authors).
|
The shape of the boroj is square or rectangular – depending on the shape of the land, on which the boroj is prepared. The height of the boroj is not fixed, it essentially varies with the farmer himself, to allow him to stand comfortably while harvesting the leaves or taking care of the vines. However the height of the roof of the boroj follows a mean height of seven feet from the ground. However, at present, for durability of the structure , some cultivators use synthetic material called “shade net” (Fig. 14) that are tied to concrete pillars instead of straw ,coconut leaf and other thatch material for providing the shade and support to the betel vine. Despite their durability, it is used by only 20% to 30 % of the betel leaf cultivators. Long standing experienced cultivators do not prefer this because it can withstand the fury of the high speed winds associated with cyclonic and severe cyclonic storms only up to a very specific threshold limit. Beyond this threshold limit, the entire shade net gets uprooted together with the betel vines. The indigenously built boroj on the other hand, is not as much wind resistant but these materials like bamboo, sticks, coconut leaves , straw and other thatch material are blown away by the winds in the event of a storm, allowing the wind to pass right through the boroj, thereby leaving the structure and the plant partially intact and crop bearing. This helps the farmer to avoid total loss of harvest. In such circumstances, the only cost that the cultivator has to bear is for the repair of the boroj on the wind ward side and the cost of partially damaged crops.
A table (Table 5) has been prepared to better understand the sequential steps that are necessary for an ideal boroj construction and then the steps that are actually followed by the locals have also been incorporated. Each step has been assigned a point representing a total of 8 points (100%). The final score achieved is 6.15 (76.875%) shows the lagging points, those which have been avoided or could not be done. The missing steps or sub-steps were supposed to lower the production amount, which have been overcome by excess use of chemical fertilizers.
Table 5: Boroj scoring (prepared by authors).
Proper steps for betel leaf cultivation | Sub steps | Points assigned for each steps/sub steps | Steps actually followed |
Selection of appropriate land | Soil | 0.5 | 0.5 |
pH | 0.5 | 0.5 | |
Preparation of land & curing the soil | Stage 1 | 0.33 | 0.33 |
Stage 2 | 0.34 | Not followed | |
Stage 3 | 0.33 | 0.33 | |
Selection of ideal parent vine | Healthy | 0.5 | 0.33 |
Mature plant | 0.5 | Not followed | |
Curing of parent vine & collecting the sapling | Curing | 0.33 | 0.33 |
Removing the top | 0.34 | Not followed | |
Top part | 0.33 | 0.33 | |
Curing the sapling |
| 1 | 1 |
Preparation of PILI or BHATI (Raised strip of land for plantation) | Cure | 0.5 | 0.5 |
Height & Width | 0.5 | Not followed | |
Plantation of saplings |
| 1 | 1 |
Construction of Boroj | Construction | 0.5 | 0.5 |
Maintenance | 0.5 | 0.5 | |
| Total score | 8 (100%) | 6.15 (76.875 %) |
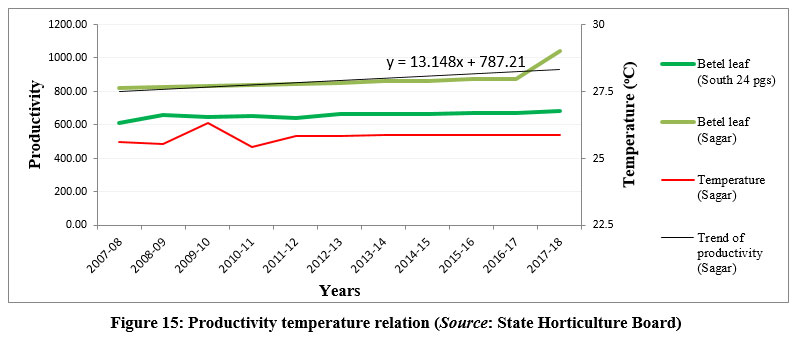
After undertaking these type 2 adaptive strategies described above; the impact of climate change on betel leaf cultivation in the study area is examined with respect to the productivity of betel leaf in the district and in Sagar block in the light of current trend of rainfall and temperature rise.
 | Figure 15: Productivity temperature relation (Source: State Horticulture Board).
|
From Fig. 15 it is seen that, there is a slow but steady increase in the productivity of betel leaf despite the imperceptible rising trend in temperature during the period of observation. This proves that the adaptive strategies adopted by the local cultivators are working fruitfully. Alternatively, it may be stated that productivity does not seem to be affected by rise in temperature. This need to be viewed against the backdrop of the IPCC findings that temperature rise of more than 1.50C only affects crop yield and productivity 33,15,44. However, it may be noted here that IPCC talks about global figures of temperature alone but the rise of 0.6 °C increase in the average daily minimum temperature and 0.1°C increase in the average daily temperature of Sagar for the period 1891-1970 and the rise of the temperature at a rate of 0.019 °C per year from the year 2000 onwards needs to be noted because the regional implications of this temperature rise cannot be ignored altogether. Since secondary data pertaining to this is not available, the authors have assessed this on the basis of perception survey of betel leaf cultivators which is discussed subsequently. Besides, for a greater insight in to the phenomena it would be pertinent to look into the observations, opinions and perceptions of the betel leaf cultivators regarding the impact of climate change. The rationale for this method of enquiry is elaborated in the earlier section of this paper.
Design of perception Survey
Perception survey has been done for 80 betel leaf farmers from sixteen more or less evenly distributed villages (5 respondents from each sample villages) for the purpose to gain a complete spatial coverage of the phenomenon. The respondents are then classified into two categories, on the basis of their economic status and the tenure of occupation of the betel leaf cultivators. The justification for the former is to assess the status of affordability of the adoption of type 2 adaptive strategy: while that of the later is to ascertain the impact of global warming on the quality characteristics of betel leaf. A definite break point of temperature or rainfall rise, indicating the beginning of climate change could not be identified because there is a steady but imperceptible rise in these parameters manifesting climate change. Therefore, the interviewees have been selected on the basis of their age and tenure of engagement in betel leaf cultivation taking into consideration the benefits of long term experiences and observations on this issue. The design is outlined briefly in the Table 6.
Table 6: Design of perception survey.
Total no of villages in Sagar C.D. Block | No of sample villages | % of sample villages | Total no of respondents | Occupational period group of respondents (in years) | No of respondents in each occupational period group | % of respondents in each occupational group |
47 | 16 | 34 (approx.) | 80 (5 respondents from each sample villages) | ?10 | 4 | 5 |
10-20 | 16 | 20 | ||||
20-30 | 28 | 35 | ||||
30-40 | 22 | 27.5 | ||||
40-50 | 9 | 11.25 | ||||
>50 | 1 | 1.25 |
Two indicators, chosen for assessment of economic status are- a) Number of betel vines owned/cultivated; b) Engagement in Additional economic activity (source of income other than betel leaf).
Impact of climate change on the quality of the betel leaf
To gain an insight into the manifestation of climate change we have analyzed the productivity figures in previous section. This is further being looked into through the observations of the cultivators who have been engaged in this practice for over a period of more than 30 years or so. Most of them have reported higher incidence of “Black Spots” (Fig 16(a)) and “Chlorosis” (loss of Chlorophyll) (Fig 16(b) & (c)) in recent years due to sudden fluctuations in temperature. Their observations are recorded in Table 7. The table reveals that irrespective of the economic status the impact of warming is noted in the quality and market (economic) value of the betel leaf. Implicitly, it means that the adoption of adaptive strategies cannot outweigh the impact of global warming at the local scale in the study area. Perception survey also revealed that none of the respondents has any idea about climate change or global warming irrespective of their educational or economic status.
 | Figure 16: Black spots (a) and Chlorosis (b) and (c) on betel leaf (Source: Authors).
|
Table 7: Perception regarding impact of climate change on betel leaf cultivation.
Economic status group | Number of respondents | No. of respondents reporting occurrence of chlorosis only | % | No. of respondents reporting occurrence of black spots only | % | No. of respondents reporting occurrence of both | % | No. of respondents providing no response | % |
1 | 1 | 0 | 0 | 0 | 0 | 0 | 0 | 1 | 100 |
2 | 6 | 0 | 0 | 2 | 33.33 | 4 | 66.66 | 0 | 0 |
3 | 27 | 1 | 3.70 | 13 | 48.15 | 13 | 48.14 | 0 | 0 |
4 | 19 | 0 | 0 | 11 | 57.89 | 8 | 42.11 | 0 | 0 |
5 | 23 | 2 | 8.69 | 6 | 26.08 | 13 | 56.52 | 2 | 8.69 |
6 | 4 | 0 | 0 | 2 | 50 | 2 | 50 | 0 | 0 |
Occupational period group | Number of respondents (frequency) | No. of respondents reporting occurrence of chlorosis only | % | No. of respondents reporting occurrence of black spots only | % | No. of respondents reporting occurrence of both | % | No. of respondents providing no response | % |
<10 | 4 | 0 | 0 | 0 | 0 | 3 | 75 | 1 | 25 |
10-20 | 16 | 1 | 6.25 | 7 | 43.75 | 8 | 50 | 0 | 0 |
20-30 | 28 | 2 | 7.14 | 10 | 35.71 | 15 | 53.57 | 1 | 3.57 |
30-40 | 22 | 0 | 0 | 10 | 45.46 | 11 | 50 | 1 | 4.55 |
40-50 | 9 | 0 | 0 | 4 | 44.44 | 5 | 55.55 | 0 | 0 |
>50 | 1 | 0 | 0 | 0 | 0 | 1 | 100 | 0 | 0 |
Findings and Discussion
Distinct evidences of climate change in the study area are noticeable. The indicators used for measuring climate change are temperature, rainfall and frequency of occurrences of storms of various dimensions .All of these show an increasing trend over the last 100 years.
A distinct break in the trend of temperature and rainfall are noted during mid-1960s. Before this, temperature fluctuations beyond IMD normal were not particularly noticeable. Since mid-1960, three negative fluctuations, well below IMD normal (Fig. 2) are conspicuous. Positive fluctuations on the other hand are within IMD normal limits. Trend of maximum (summer) and minimum (winter) temperature pattern analysis reveals a rising trend of 0.0019 and 0.0117 respectively. Therefor winter temperature is changing faster than summer implying lowering of the diurnal temperature with time. The trend of average temperature rise is 0.0117 (Fig. 2), hence climate change isn’t manifested through distinct temperature rise, rather it’s in the form of fluctuation, which is much more detrimental to the productivity and quality of betel leaves. Analysis of the rainfall pattern for the last 100 years reveals fluctuating trend with positive and negative peaks beyond normal limits (Prescribed by IMD.
In the case of temperature the average rate of change is 0.19. In the case of rainfall the fluctuation are also noted for the 100 year period. The rate of change of rainfall has been within normal limits but major changes are seen in the dates of onset and withdrawl of mnsoon 38.
Given the sensitivity of betel leaf to such changes, conceptually, an adverse impact on the productivity and quality of betel leaves through decrease in yield, quality of the product etc. seems inevitable. However in reality, this is not so. Firstly because the rise in temperature is much lesser than 1.5oC, which according to IPCC is the threshold value for impact on agriculture. Secondly, the adoption of adaptive strategies like use of fertilizer, soli treatment, construction of artificial structure (boroj) to control ambient weather in the study are largely offsets the adverse impact of climate change on crop production.
In conclusion it can be said that the area is economically and geographically a marginal area and the cultivators operate as subsistence commercial farmers. Therefore not only do they lack the wherewithal for carrying out scientific analyses of the impact of climate change on betel leaf but it is not in vogue too. Therefore, perception and awareness survey of the betel is the only way out to record the impact of climate change in the study area. Besides, all though there are evidences of climate change but it is yet to reach the threshold limit through which an adverse impact of productivity would be evident. Under the present scenario of climate change in the study are, productivity remains unchanged. However, if the change continues as predicted through ARIMA model for next 30 years, situation would be severely detrimental to betel leaf production especially given the marginal economy of the study are. Therefore the aim should be to prevent further rise of temperature which should mitigate the issues arising out of climate change. Suitable mitigation strategies to either maintain the status quo of the climatic scenario or to reduce the present rate of change of temperature should be adopted and adhere to.
Acknowledgement
We are grateful to India Meteorological Department and State Horticulture Board for providing the necessary data for academic and research purposes.
Conflict of Interest
The authors declare no conflict of interest.
Funding Sources
No funds/ grants were received for the present research work.
References
- Altieri MA, Nicholls CI, Henao A, Lana MA. Agroecology and the design of climate change-resilient farming systems. Agron Sustain Dev. 2015;35(3):869-890. doi:10.1007/s13593-015-0285-2
CrossRef - Hoque MZ, Cui S, Xu L, Islam I, Tang J, Ding S. Assessing Agricultural Livelihood Vulnerability to Climate Change in Coastal Bangladesh. Int J Environ Res Public Health. 2019;16(22):4552. doi:10.3390/ijerph16224552
CrossRef - Howden SM, Soussana JF, Tubiello FN, Chhetri N, Dunlop M, Meinke H. Adapting agriculture to climate change. :6.
- Kantamaneni K, Rice L, Yenneti K, Campos LC. Assessing the Vulnerability of Agriculture Systems to Climate Change in Coastal Areas: A Novel Index. Sustainability. 2020;12(11):4771. doi:10.3390/su12114771
CrossRef - Parry M, Rosenzweig C, Iglesias A, Fischer G, Livermore M. Climate change and world food security: a new assessment. Glob Environ Change. 1999;9:S51-S67. doi:10.1016/S0959-3780(99)00018-7
CrossRef - Smith DL, Almaraz JJ. Climate change and crop production: contributions, impacts, and adaptations. Can J Plant Pathol. 2004;26(3):253-266. doi:10.1080/07060660409507142
CrossRef - Thornton P, Dinesh D, Cramer L, Loboguerrero AM, Campbell B. Agriculture in a changing climate: Keeping our cool in the face of the hothouse. Outlook Agric. 2018;47(4):283-290. doi:10.1177/0030727018815332
CrossRef - Kolladi R. A Review on the Impact of Climate Change on Crop Production in Humid Tropics. SciFed J Glob Warm. 2017;1(1). doi:10.23959/sfjgw-1000002
CrossRef - Parry M, Rosenzweig C, Livermore M. Climate change, global food supply and risk of hunger. Philos Trans R Soc B Biol Sci. 2005;360(1463):2125-2138. doi:10.1098/rstb.2005.1751
CrossRef - A brief history of climate change. BBC News. https://www.bbc.com/news/science-environment-15874560. Published September 20, 2013. Accessed September 24, 2022.
- Hasselmann K. Stochastic climate models Part I. Theory. Tellus. 1976;28(6):473-485. doi:10.1111/j.2153-3490.1976.tb00696.x
CrossRef - Palmer TN. Stochastic weather and climate models. Nat Rev Phys. 2019;1(7):463-471. doi:10.1038/s42254-019-0062-2
CrossRef - Treut HL, Somerville R, Cubasch U, et al. Historical Overview of Climate Change Science. Published online 2007:36.
- Kumar SN, Aggarwal PK, Rani S, Jain S, Saxena R, Chauhan N. Impact of climate change on crop productivity in Western Ghats, coastal and northeastern regions of India. Curr Sci. 2011;101(3).
doi:10.1163/9789004322714_cclc_2015-0171-002
CrossRef - Porter JR, Semenov MA. Crop responses to climatic variation. Philos Trans R Soc B Biol Sci. 2005;360(1463):2021-2035. doi:10.1098/rstb.2005.1752
CrossRef - Yaduvanshi A, Zaroug M, Bendapudi R, New M. Impacts of 1.5 °C and 2 °C global warming on regional rainfall and temperature change across India. Environ Res Commun. 2019;1(12):125002. doi:10.1088/2515-7620/ab4ee2
CrossRef - Karl TR, Knight RW, Christy JR. Global and Hemispheric Temperature Trends: Uncertainties Related to Inadequate Spatial Sampling. J Clim. 1994;7:1144-1168. doi:10.1175/1520-0442(1994)007<1144:GAHTTU>2.0.CO;2
CrossRef - Bandyopadhyay S. Natural Environmental Hazards and Their Management: A Case Study of Sagar Island, India. Singap J Trop Geogr. 1997;18(1):20-45. doi:10.1111/1467-9493.00003
CrossRef - Bera A, Meraj G, Kanga S, et al. Vulnerability and Risk Assessment to Climate Change in Sagar Island, India. Water. 2022;14(5):823. doi:10.3390/w14050823
CrossRef - Project Concept for Enhancing Livelihoods in Sagar Island. Sundarbans Development Board; 2008:65.
- Bera A, Meraj G, Kanga S, et al. Vulnerability and Risk Assessment to Climate Change in Sagar Island, India. Water. 2022;14(5):823. doi:10.3390/w14050823
CrossRef - Hazra PS, Samanta K, Mukhopadhyay A, Akhand A. Temporal Change Detection (2001-2008) Study of Sundarban. Published online 2010:128.
- Hazra S, Ghosh T, DasGupta R, Sen G. Sea Level and associated changes in the Sundarbans. Published online 2002:26.
- Mitra A, Gangopadhyay A, Dube A, Schmidt ACK, Banerjee K. Observed changes in water mass properties in the Indian Sundarbans (northwestern Bay of Bengal) during 1980–2007. Curr Sci. 2009;97(10):9.
- Bandyopadhyay S. Sagar Island: Evolution, Landforms and Environmental Management. Unpublished thesis. University of Calcutta; 1996.
- Roy Chowdhury B, Sen T. Coastal Erosion and Its Impact on Sagar Island, (S) 24 Parganas, W.B. Int J Sci Res. 2015;4(3):5.
- Jayappa KS, Mitra D, Mishra AK. Coastal geomorphological and land?use and land?cover study of Sagar Island, Bay of Bengal (India) using remotely sensed data. Int J Remote Sens. 2006;27(17):3671-3682. doi:10.1080/01431160500500375
CrossRef - Bordenave P. Agriculture in coastal areas: environmental issues, impacts and regulation tools. :19.
- Chen X, Zong Y. Major impacts of sea-level rise on agriculture in the Yangtze delta area around Shanghai. Appl Geogr. 1999;19(1):69-84. doi:10.1016/S0143-6228(98)00035-6
CrossRef - Datta S. IMPACT OF CLIMATE CHANGE IN INDIAN HORTICULTURE - A REVIEW. :11.
- Gopalakrishnan T, Hasan M, Haque A, Jayasinghe S, Kumar L. Sustainability of Coastal Agriculture under Climate Change. Sustainability. 2019;11(24):7200. doi:10.3390/su11247200
CrossRef - Mishra D, Sahu NC. Economic Impact of Climate Change on Agriculture Sector of Coastal Odisha. APCBEE Procedia. 2014;10:241-245. doi:10.1016/j.apcbee.2014.10.046
CrossRef - IPCC. Summery for Policymakers.; 2018.
- Rosenzweig C, Parry ML, Fischer G, Frohberg K. Climate Change and World Food Supply. University of Oxford, Environmental Change Unit; 1993. Accessed September 29, 2022. http://www.ciesin.org/docs/004-046/004-046.html
- Jana BL. Grambanglar Arthakori Foshol-Paan. First. Display Printers pvt. ltd.; 1995.
- Panda J. Paschimbange Arthokari Paner Chas. 3rd ed. Debi Book Stall; 2019.
- SATSA. Paan chas Somossa o Protikar. In: Vol 3. 3rd ed. SATSA krishi pustika. State Agricultural Technologists Service Association; 2013:32.
- Chand BK, Trivedi RK, Dubey SK, Beg MM. Aquaculture in Changing Climate of Sundarban.pdf. Published online 2012.
- Nau R. Statistical forecasting: notes on regression and time series analysis. Published 2014. Accessed October 16, 2022. https://people.duke.edu/~rnau/411home.html
- Dai J, Chen S. The application of ARIMA model in forecasting population data. J Phys Conf Ser. 2019;1324(1):012100. doi:10.1088/1742-6596/1324/1/012100
CrossRef - Shweta. Introduction to Time Series Forecasting — Part 2 (ARIMA Models). Medium. Published July 30, 2021. Accessed October 16, 2022. https://towardsdatascience.com/introduction-to-time-series-forecasting-part-2-arima-models-9f47bf0f476b
- Singh OP. Long-term trends in the frequency of severe cyclones of Bay of Bengal?: Observations and simulations. MAUSAM. 2007;58(1):59-66. doi:10.54302/mausam.v58i1.1131
CrossRef - Sultan B, Defrance D, Iizumi T. Evidence of crop production losses in West Africa due to historical global warming in two crop models. Sci Rep. 2019;9(1):12834. doi:10.1038/s41598-019-49167-0
CrossRef - Shah R, Srivastava R. Effect of Global Warming on Indian Agriculture. Sustain Environ. 2017;2(4):366. doi:10.22158/se.v2n4p366
CrossRef


