Diversity of Naturally Colonized True Mangroves and Mangrove Associates Along the Bank of Champa Canal, West Bengal, India, with Emphasis on Different Environmental Factors
Avik Bhanja1
 , Pijush Payra2
*
, Indrajit Sau3
, Sandip Makur4
, Dishani Biswas5
, Tapas Bhunia6
and Nibedita Sinha7
, Pijush Payra2
*
, Indrajit Sau3
, Sandip Makur4
, Dishani Biswas5
, Tapas Bhunia6
and Nibedita Sinha7
1
Department of Biological Sciences (Fisheries Science),
Midnapore City College,
Vidyasagar University,
Midnapore,
West Bengal
India
2
Department of Fisheries Science,
Ramnagar College,
Vidyasagar University,
Depal,
India
3
Department of Botany and Forestry,
Vidyasagar University,
Midnapore,
West Bengal
India
4
Department of Remote Sensing and GIS,
Vidyasagar University,
Midnapore,
West Bengal
India
5
Department of Geography,
Raja Narendra Lal Khan Women's College (Autonomous),
Midnapore,
West Bengal
India
6
Department of Aquaculture,
Sanjeev Agrawal Global Educational (SAGE) University,
Bhopal,
Madhya Pradesh
India
7
Department of Aquaculture Management,
Ramnagar College,
Vidyasagar University,
Depal,
India
http://dx.doi.org/10.12944/CWE.20.2.20
Copy the following to cite this article:
Bhanja A, Payra P, Sau I, Makur S, Biswas D, Bhunia T, Sinha N. Diversity of Naturally Colonized True Mangroves and Mangrove Associates Along the Bank of Champa Canal, West Bengal, India, with Emphasis on Different Environmental Factors. Curr World Environ 2025;20(2). DOI:http://dx.doi.org/10.12944/CWE.20.2.20
Copy the following to cite this URL:
Bhanja A, Payra P, Sau I, Makur S, Biswas D, Bhunia T, Sinha N. Diversity of Naturally Colonized True Mangroves and Mangrove Associates Along the Bank of Champa Canal, West Bengal, India, with Emphasis on Different Environmental Factors. Curr World Environ 2025;20(2).
Download article (pdf)
Citation Manager
Publish History

Introduction
Mangroves are a diverse group of salt-tolerant, primarily arboreal, flowering plants that mainly thrive in tropical and subtropical regions.1,2 True mangroves are species that exclusively inhabit intertidal zones, whereas mangrove allies can thrive in both littoral and terrestrial environments.3 Mangrove ecosystems hold substantial ecological and economic importance in coastal protection and water quality enhancement. As one of the most productive ecosystems, they serve as a natural, renewable resource.4,5 Services encompass the function of mangroves as a nursery for economically significant fisheries, particularly shrimp, and also offer habitats for numerous molluscs, crustaceans, avifauna, insects, primates, and reptiles.3 Mangrove companions are typically not inundated by high tides. Mangroves are primarily found along the landward margin and include several types of plants such as herbs, ferns, climbers, vines, shrubs, trees, and orchids.6 The mangrove water exhibited mild alkalinity and elevated levels of pH, total hardness, calcium, magnesium, chloride, total inorganic and organic phosphate, ammonium, nitrite, and nitrate.7 The confluence of river water and ocean initiates numerous physical and chemical processes that might affect water quality.7 Tidal oscillations can induce systematic alterations in the delicate balance of conditions within these unique and vulnerable ecosystems.4,8 Dynamic processes of erosion and accretion continually shape and alter deltas due to the influence of semi-diurnal tides, vigorous winds, wave action, varying sediment loads, and other natural pressures.8
Mangroves are globally distributed, occurring in over 112 nations. Mangroves exist in all coastal states of India, encompassing West Bengal, Odisha, Andhra Pradesh, Tamil Nadu, Puducherry, Kerala, Karnataka, Goa, Maharashtra, Gujarat, Daman-Diu, the Andaman and Nicobar Islands, and a restricted region in Lakshadweep.5 India's mangrove forests cover an area of 4,991.68 km² along the nation's coastlines.9 The Indian mangroves consist of roughly 59 species across 41 genera and 29 families. Among these, 34 species from 25 genera and 21 families are found along the west coast.10 The mangrove habitats of India are under significant threat due to the unrestrained exploitation of their resources for various purposes, including fodder, fuel, wood, lumber for construction, alcohol, paper, charcoal, and medicinal uses.11 In addition to these factors, the transformation of forested land for aquaculture and agriculture, the development of ports and harbours, the expansion of human habitation, overgrazing, urbanisation, industrialisation, and chemical pollution are significant and prevalent activities that diminish mangrove areas.10,11 Due to these challenges, almost 33% of India's mangrove regions have been lost in the past 15 years. The East Coast region has had a loss of approximately 28%; the West Coast region, about 44%; and the Andaman and Nicobar Islands, over 32%.11
The Purba Medinipur district in West Bengal, India, is rich in natural resources, especially its brackish water ecosystems that support a wide variety of fauna and flora.12 The coastline of this district along the Bay of Bengal displays unique features influenced by geomorphic changes. The natural colonisation of specific mangrove and halophyte species on the mudflat is observable along this coastline.13 The Negua Diversion Canal (NDC), also known locally as the Champa Canal or Champa River, is situated in the district of Purba Medinipur. NDC constitutes a component of the Dubda basin project. The Dubda Basin Project commenced in 1972.14 This canal is referred to as the Champa River due to its extensive length, significant width, and notable depth. This canal originates from Kudi and flows into the Bay of Bengal. The water exhibits freshwater characteristics from its source to the syphon at Paniparul; subsequently, it transitions to brackish water after the syphon, and finally, at Mohana, or the canal's terminus, it displays marine water characteristics.15 The Champa Canal spans approximately 30.3 kilometres, with a stretch from the syphon to the Bay of Bengal measuring around 13 kilometres. Its width fluctuates between 110 and 140 meters, influenced by seasonal changes and tidal variations in the Bay of Bengal.15
Despite many studies on the diversity of mangroves and other tidal flora along the coastal region of Purba Medinipur district,13,16-19 there is a significant lack of research addressing the diversity of mangroves and their associates, as well as the environmental parameters along the banks of Champa Canal or Negua Diversion Canal in Purba Medinipur district, West Bengal, India. The research aimed to investigate the diversity of mangroves and their associated species, emphasizing water and soil quality metrics with tidal fluctuations along the canal's bank.
Material and Methods
Study area and period
The study was carried out along the banks of the Champa Canal, also known as the Negua Diversion Canal, located in the Purba Medinipur district of West Bengal, India. The sampling sites were categorised into three distinct zones (Zone-I, Zone-II, Zone-III) according to variations in salinity and the presence of mangrove vegetation.
Zone-I (Shankarpur Mohana to east side of Chowddomile Bridge; 21°38'19.5"N 87°33'36.2"E to 21°40'42.3"N 87°34'29.6"E) is located nearest to the Bay of Bengal and is dominated by true mangroves and halophytic vegetation due to high salinity intrusion and tidal influence. The frequent tidal flushing supports rich alluvial deposition, favouring dense root systems and pneumatophores for gas exchange.
Zone-II (West side of Chowddomile Bridge to Madhabpur canal bank; 21°40'43.1"N 87°34'29.5"E to 21°42'39.4"N 87°33'22.7"E) represents a transitional zone, features moderate mangrove diversity and mixed vegetation types, as salinity and tidal effects decrease inland. It serves as an ecotone between the marine-influenced Zone-I and the freshwater-influenced Zone-III.
Zone-III (Sabitrapur to Paniparul Syphon bridge; 21°42'39.8"N 87°33'22.2"E to 21°44'32.0"N 87°31'43.4"E) exhibits the lowest mangrove diversity, influenced by freshwater flow dominance, lower salinity, and drying up due to different anthropogenic activities.
The investigation was carried out over the span of one year, specifically from December 2023 to November 2024.
Collection of samples
Specimens of various types of mangroves and their associates were collected manually, either by hand or with a pruning secateur, during low tide. All samples were gathered in the pre-labelled plastic bag. The samples were then transported to the laboratory for identification purposes.
Water samples were gathered across three distinct seasons: pre-monsoon (PreM), monsoon (MoS), and post-monsoon (PoS), from four different sampling locations in each of the three zones. The samples were transported to the laboratory for detailed analysis.
Soil samples were systematically collected with a soil sampling probe across three distinct seasons: monsoon, post-monsoon, and pre-monsoon, from three designated study zones.
Soil samples were gathered in sampling bags from the surface of the tidal bank of the Champa canal, specifically at a depth of 10-12 cm, and transported to the laboratory for subsequent analysis.
Daily tidal data were recorded from the tidal gauge located on the dam of the thirty-two-chambered sluice gate near Z-I, in addition to information gathered from various websites, including Tides4fishing20 and Tidechart.com.21
Identification of plant samples
The collected samples of mangroves and their associates were identified using the mangrove identification manual and standard flora references,6,22-26 as well as online resources such as the India Biodiversity Portal,27, and eFlora of India.28 Species were categorized as abundant, common, or rare according to their visual prevalence and occurrence frequency across sampling sites during field surveys. The conservation status of the species identified in this study was detailed as per the IUCN Red List of Threatened Species.29
Water and soil parameters analysis
The examination of Total Alkalinity (TA), Chloride, Nitrite, Nitrate, and Phosphate was conducted in accordance with standard techniques.30 The temperature was recorded with the SKADIOO digital water temperature meter (range: -50~110°C and ±1°C accuracy). The pH of water was monitored via a Digital pH meter (PH-009(I)A). The Dissolved Oxygen (DO) and Biochemical Oxygen Demand (BOD) of the samples were assessed using Winkler’s technique. The total dissolved solids in the water samples were quantified using a digital TDS meter (Labtronics LT-25). Electrical conductivity was assessed via a digital EC meter (Systronics-308). Salinity was quantified via a portable salinity meter (ACETEQ-SALMETER).
The soil pH and electrical conductivity were assessed using standard methodology.31 The assessment of available nitrogen in soil was conducted according to an established procedure,32 while the quantification of available phosphorus in soil was conducted using the Olsen standard method.33 The assessment of potassium availability in soil was conducted using standard protocols.34
Statistical analysis
Statistical analysis was performed utilising IBM SPSS Statistics Version 27.0 for Windows. Microsoft Excel 2001 was used to generate graphs for different datasets. All environmental parameter values are presented as mean ± standard deviation (SD).
Results
Mangrove diversity
A total of 10 true mangrove species across 8 genera and 6 families were identified in this study (Table 1). A total of 35 mangrove associates from 31 genera and 21 families were recorded in this study (Table 2). The study zones, based on salinity and tidal influences, showed significant variation in biodiversity. Zone I (Marine dominated) exhibited the highest species diversity among the existing mangroves. Zone II (Transitional) exhibits considerable species overlap and variety, encompassing a transitional ecosystem. Zone-III, influenced by freshwater, exhibits the least diversity of mangroves, with the absence of numerous true mangroves.
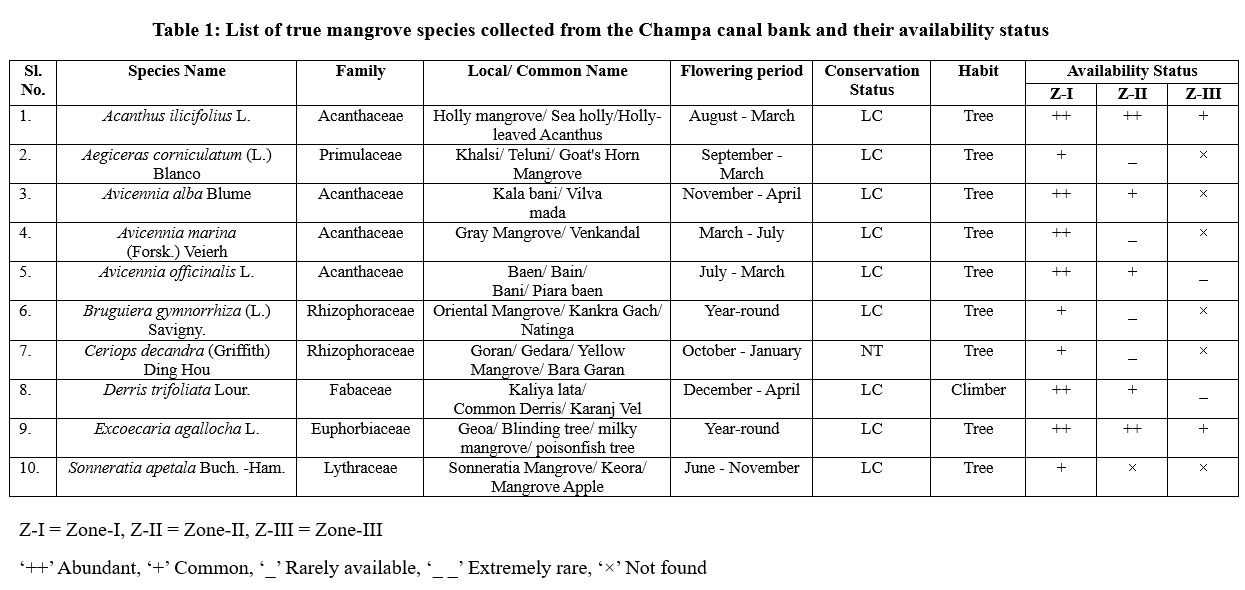 | Table 1: List of true mangrove species collected from the Champa canal bank and their availability status
|
Table 2: List of mangrove associates collected from the Champa canal bank and their availability status
SL. No. | Species Name | Family | Local/ Common Name | Flowering period | Conservation Status | Habit | Availability Status | ||
Z-I | Z-II | Z-III | |||||||
Sesuvium portulacastrum (L.) L. | Aizoaceae | Jadu Palang/ Sea Purslane/ Shore Purslane | October - April | LC | Herb | + | + | × | |
Trianthema portulacastrum L. | Aizoaceae | Horse Purslane/ Black Pig Weed/ Shwet Punarnava | April - June | NE | Herb | _ | + | + | |
Suaeda maritima (L.) Dumort. | Amaranthaceae | Indian Saltwort/ Giria sak | June - January | NE | Succulent | ++ | _ | × | |
Suaeda monoica Forssk.ex Gmel. | Amaranthaceae | Eelakura/ Ilakura | May - December | NE | Succulent | ++ | + | _ _ | |
Suaeda nudiflora (Willd.) Moq. | Amaranthaceae | Giria sak/ Eelakura/ Ilakura | November - April | NE | Succulent | + | × | × | |
#Calotropis gigantea (L.) W.T. Aiton | Apocynaceae | Aakanda/ Giant Milkweed/ Crown Flower | Year-round | NE | Shrub | _ | ++ | ++ | |
#Phoenix sylvestris (L.) Roxb. | Arecaceae | Khejur/ Date Sugar Palm | March - May | NE | Tree | + | + | + | |
Pluchea indica (L.) Less. | Asteraceae | Indian camphorweed/ Indian fleabane/ Indian pluchea | February-April | NE | Shrub | + | + | + | |
* #Chromolaena odorata (L.) R.M.King & H.Rob | Asteraceae | Tivra Gandha/ Chritsmas Bush/ Common Floss Flower | October - May | NE | Shrub | + | + | + | |
* #Parthenium hysterophorus L. | Asteraceae | Gajar Ghas/ Congress Grass | May-March | NE | Herb | _ | + | + | |
Heliotropium curassavicum L. | Boraginaceae | Seaside Heliotrope/ Monkey Tail/ Salt Heliotrope/ Quail Plant | February - April | NE | Herb | ++ | + | _ | |
* #Opuntia dillenii (Ker Gawl.) Haw. | Cactaceae | Eltham Indian Fig/ Nagphan/ Phani/ Mahavriksha | March-May | NE | Shrub | _ _ | _ | _ | |
#Capparis zeylanica L. | Capparaceae | Kalokera/ Gobindaphal/ Ceylon Caper/ Karambha | February-April | NE | Shrub | + | _ | × | |
#Casuarina equisetifolia L. | Casuarinaceae | Jhau/ Coastal She-Oak/ Junglisaru | December - July | LC | Tree | _ | × | × | |
Ipomoea pes caprae (L.) R.Br. | Convolvulaceae | Chagol pa/ Bayhops, Beach morning glory | March - October | LC | Creeper | ++ | + | × | |
Ipomoea sagittifolia Burm.f. | Convolvulaceae | Purple Heart Glory/ Bankalami/ Manjika | Year-round | LC | Climber | _ | _ | + | |
Cyperus rotundus L. | Cyperaceae | Nut grass/ Mutha-bon/ Coco-grass | June - October | LC | Herb | + | + | ++ | |
Fimbristylis ferruginea (L.) Vahl | Cyperaceae | Rusty Sedge/ West Indian Fimbry | June - October | LC | Herb | + | + | + | |
#Euphorbia lactea Haw. | Euphorbiaceae | Elkhorn/ Frilled Fan/ Candelabra Plant/ False Cactus | April - June | DD | Shrub | _ | _ | _ | |
Guilandina bonduc L. | Fabaceae | Nicker nut/ Fever nut | December - April | LC | Climber | ++ | + | + | |
#Neptunia oleracea Lour. | Fabaceae | Lajjabati/Water mimosa/ sensitive neptunia | December - March | LC | Herb | + | + | + | |
*Prosopis juliflora (Sw.) DC. | Fabaceae | Algaroba/ Velvet mesquite/ Kabuli Keekar/ Southwest Thorn | March - April | NE | Tree | + | + | + | |
Rothia indica (L.) Druce | Fabaceae | Indian Rothia/ Papra | August -December | NE | Herb | _ | _ | _ | |
Clerodendrum inerme (L.) Gaertn. | Lamiaceae | Kundali/ Banajui/ Glory Bower/ Wild Jasmine | November-December | NE | Shrub | ++ | + | _ _ | |
Acacia nilotica (L.) Del.ssp. indica (Benth.) Brenan | Mimosaceae | Babul/ Kikar/ Babool | June - September | NE | Tree | + | + | + | |
Pandanus odoratissimus Linn.f. | Pandanaceae | Keora/ Kewda/ Kea/ Talai | July - February | LC | Bushy shrub | + | + | + | |
Cynodon dactylon (L.) Pers. | Poaceae | Durba/ Bermuda grass/ Bahama grass/ Dog's Tooth grass | March-October | NE | Herb | ++ | ++ | ++ | |
Leersia hexandra Sw. | Poaceae | Arail/ Rice Grass/ Swamp rice grass | Year-round | NE | Herb | × | _ | + | |
Myriostachya wightiana (Nees ex Steud.) Hook.f. | Poaceae | Nalai/ Darbhagaddi/ Mangrove grass | April - September | NE | Herb | ++ | _ | _ | |
Porteresia coarctata (Roxb.) Tateoka | Poaceae | Wild rice/ Dhani ghash/ Mangrove Wild Rice | June - October | DD | Herb | ++ | _ | _ | |
Portulaca oleracea L. | Portulacaceae | Nunia Sag/ Common Purslane/ Brihalloni | June - September | NE | Herb | + | _ | × | |
Azima tetracantha Lam. | Salvadoraceae | Bee-sting bush/ Needle Bush/ Four-thorns/ Stink Bush | October-January | LC | Shrub | ++ | + | _ | |
* #Solanum sisymbriifolium Lam. | Solanaceae | Swetrangani/ Sticky Nightshade/ Wild Tomato/ Sada kantikari | February-April | NE | Shrub | + | + | + | |
Solanum trilobatum L. | Solanaceae | Agnidamini/ Purple-fruited pea eggplant | January-August | NE | Shrub | + | + | + | |
* #Lantana camara L. | Verbenaceae | Vanacchedi/ Gubon/ Lantana Weed/ Banmarich | Year-round | NE | Shrub | + | + | + | |
*Invasive alien plant species can grow in the tidal plain as tidal vegetation
#Species are not exclusive mangrove associates
Z-I = Zone-I, Z-II = Zone-II, Z-III = Zone-III
‘++’ Abundant, ‘+’ Common, ‘_’ Rarely available, ‘_ _’ Extremely rare, ‘×’ Not found
Species distribution patterns revealed that Z-I supported the richest diversity, with 6 dominant and 4 commonly occurring true mangrove species, along with 34 mangrove associates, out of which 10 were abundant and 16 common species. Z-II recorded 9 true mangrove species, comprising 2 abundant, 3 common, and 4 rare species, along with 33 associate species, most of which were common (n = 21). In contrast, Z-III exhibited the lowest diversity, with only four true mangrove species (2 common, 2 rare) and 28 associate species, including 3 abundant, 16 common, 7 rare, and 2 extremely rare (Figure 1 and 2).
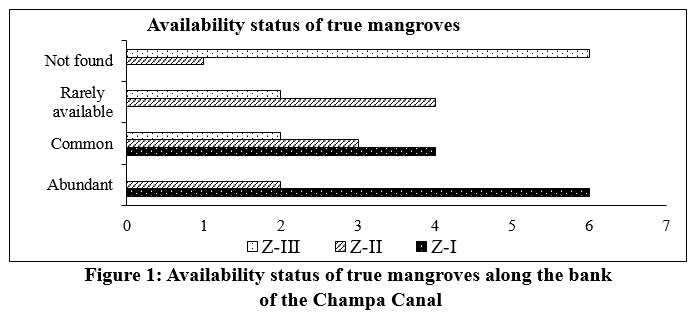 | Figure 1: Availability status of true mangroves along the bank of the Champa Canal
|
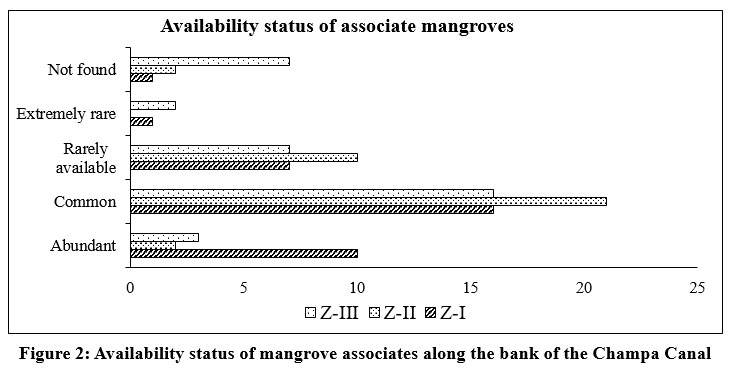 | Figure 2: Availability status of mangrove associates along the bank of the Champa Canal
|
Acanthaceae (40%) was the dominant family among true mangroves, while Fabaceae and Poaceae were most common (11%) among mangrove associates (Figure 3 and 4).
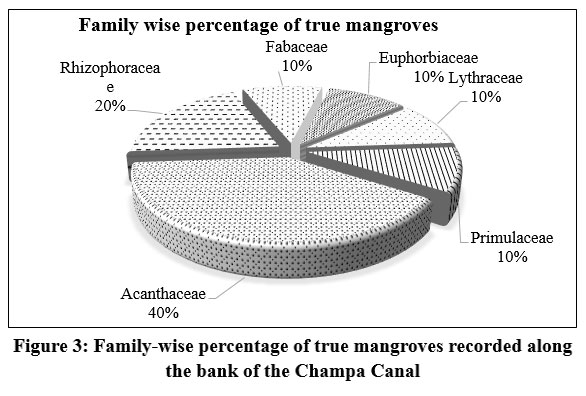 | Figure 3: Family-wise percentage of true mangroves recorded along the bank of the Champa Canal
|
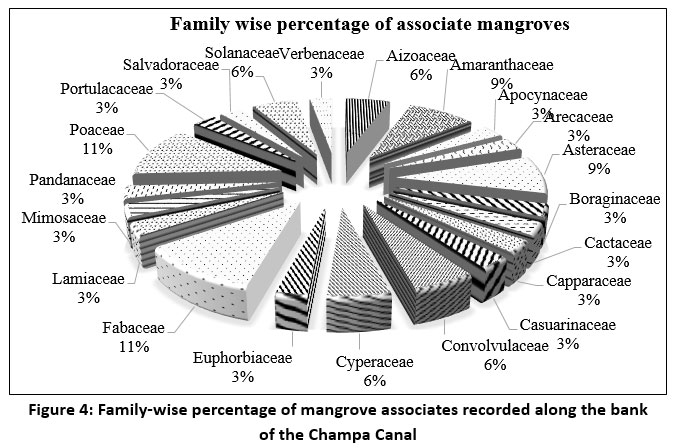 | Figure 4: Family-wise percentage of mangrove associates recorded along the bank of the Champa Canal
|
Water quality parameters
The water quality in the Champa Canal exhibited distinct seasonal and spatial variations. Air temperature fluctuated between 27.6°C and 31.1°C, whilst surface water temperature ranged from 23.1°C to 32.6°C, reaching its peak during the PreM period. The pH values reached a maximum of 8.9 in Z-I and a minimum of 6.3 in Z-III. Dissolved oxygen varied from 3.5 to 6.5 ppm, with elevated values during the MoS season. Electrical conductivity and total dissolved solids were maximal in Z-I, signifying elevated salinity. Additional indicators, including alkalinity, BOD, TSS, nitrite, nitrate, and phosphate, exhibited variability, with the majority of values rising during the MoS as a result of runoff and freshwater influx (Table 3).
Soil quality parameters
Soil parameters across the three zones showed noticeable seasonal variations. Soil pH remained relatively stable, ranging from 5.95 to 6.68, with slightly higher values during the MoS. Electrical conductivity varied between 1.53 and 3.97 dS/m, peaking in Z-I during the PoM season. Available nitrogen content ranged from 156.44 to 230.22 kg/ha, with the highest values found in Z-I, likely due to organic matter accumulation. Phosphorus content ranged from 18.4 to 24.1 kg/ha, and potassium varied between 213.38 and 368.89 kg/ha, both being highest in mangrove-dominated Z-I (Table 4).
Table 3: Physico-chemical parameters (Mean±SD) of the Champa Canal water across the three study zones
Parameters | Pre-monsoon (PreM) | Monsoon (MoS) | Post-monsoon (PoM) | ||||||
Z-I | Z-II | Z-III | Z-I | Z-II | Z-III | Z-I | Z-II | Z-III | |
AT(0C) | 31.08 | 30.15 | 30.20 | 28.89 | 28.77 | 29.09 | 28.02 | 27.75 | 27.62 |
WT(0C) | 30.43 | 31.1 | 30.53 | 29.17 | 29.49 | 29.31 | 27.01 | 26.77 | 26.31 |
pH | 8.34 | 8.08 | 7.98 | 7.86 | 7.5 | 7.42 | 8.01 | 7.59 | 7.11 |
TA (ppm) | 206.78 | 182.91 | 151.1 | 180.3 | 161.29 | 139.49 | 192.3 | 169.31 | 141.05 |
Salinity (‰) | 18.9 ±0.1 | 11.4 | 4.9 | 16.28 | 9.72 ±0.22 | 2.17 | 18.3 | 10.09 | 3.3 |
DO (ppm) | 4.31 | 4.17 | 3.48 | 5.24 | 5.31 | 5.1 | 5.05 | 4.86 | 3.55 |
EC (µS/cm) | 25,650.33 | 17,806.5 | 8,035.25 | 20,327.14 | 15,293.11 | 7,124.09± | 22,123.01 | 15,297.7 ± 729.02 | 8,091.3 |
BOD (ppm) | 1.73 | 1.91 | 1.98 | 1.95 | 2.18 | 2.36 | 2.04 | 2.58 | 2.94 |
TDS (ppm) | 23,720.14 | 18,482.51 | 16,092.25 | 21,920.39 | 15,092.14 | 14,438.65 | 23,133.17 ±767.04 | 17,627.76 ±620.34 | 15,421.92 ±511.08 |
TSS (ppm) | 115.25 | 84.44 | 79.35 | 232.5 | 176.43 | 165.24 | 144.5 ±19.02 | 131.74 | 130.17 |
Nitrite (ppm) | 0.09 | 0.14 | 0.18 | 0.41 | 0.38 | 0.43 | 0.2 | 0.19 ±0.03 | 0.3 |
Nitrate (ppm) | 0.16 | 0.2 | 0.28 | 0.44 | 0.46 | 0.58 | 0.34 | 0.3 | 0.39 |
Phosphate (ppm) | 0.15 | 0.16 ±0.08 | 0.16 | 0.37 | 0.43 | 0.5 | 0.25 | 0.31 ±0.16 | 0.36 |
AT=Atmosphere Temperature; WT=Water Temperature; TA=Total Alkalinity; DO=Dissolved Oxygen; EC=Electrical conductivity; BOD= Biological Oxygen Demand; TDS=Total Dissolved Solids; TSS=Total Suspended Solids
Table 4: Physico-chemical parameters of mangrove soil along the bank of Champa Canal across the three study zones
Parameters | Pre-Monsoon (PreM) | Monsoon (MoS) | Post-Monsoon (PoM) | ||||||
Z-I | Z-II | Z-III | Z-I | Z-II | Z-III | Z-I | Z-II | Z-III | |
Soil pH | 6.21 | 5.95 | 6.14 | 6.68 | 6.1 | 6.57 | 6.2 | 6.0 ±0.11 | 6.6 |
EC (dS m-1) | 3.14 | 2.95 | 2.57 | 2.03 | 1.84 | 1.53 | 3.97 | 3.05 | 3.09 |
Nitrogen (kg/ha) | 209.24 | 194.61 | 172.16 | 183.1 | 178.19 | 156.44 | 230.22 | 206.46 | 182.14 |
Phosphorus (kg/ha) | 21.32 | 19.14 | 18.72 | 24.1 | 23.66 | 20.58 | 21.2 | 22.58 | 18.4 |
Potassium (kg/ha) | 291.78 | 209.4 | 213.38 | 368.89 | 267.72 | 234.65 | 302.01 | 235.13 | 226.24 |
EC=Electrical conductivity
Tidal variance
The tidal pattern along the Champa Canal was found to be meso-tidal and semi-diurnal, with spring tides ranging from 2.6 to 5.5 meters and neap tides from 0.2 to 2.3 meters. The highest spring tide occurred in October 2024, while the lowest was recorded in March and April. Neap tides peaked in September and reached their minimum in March (Figure 5).
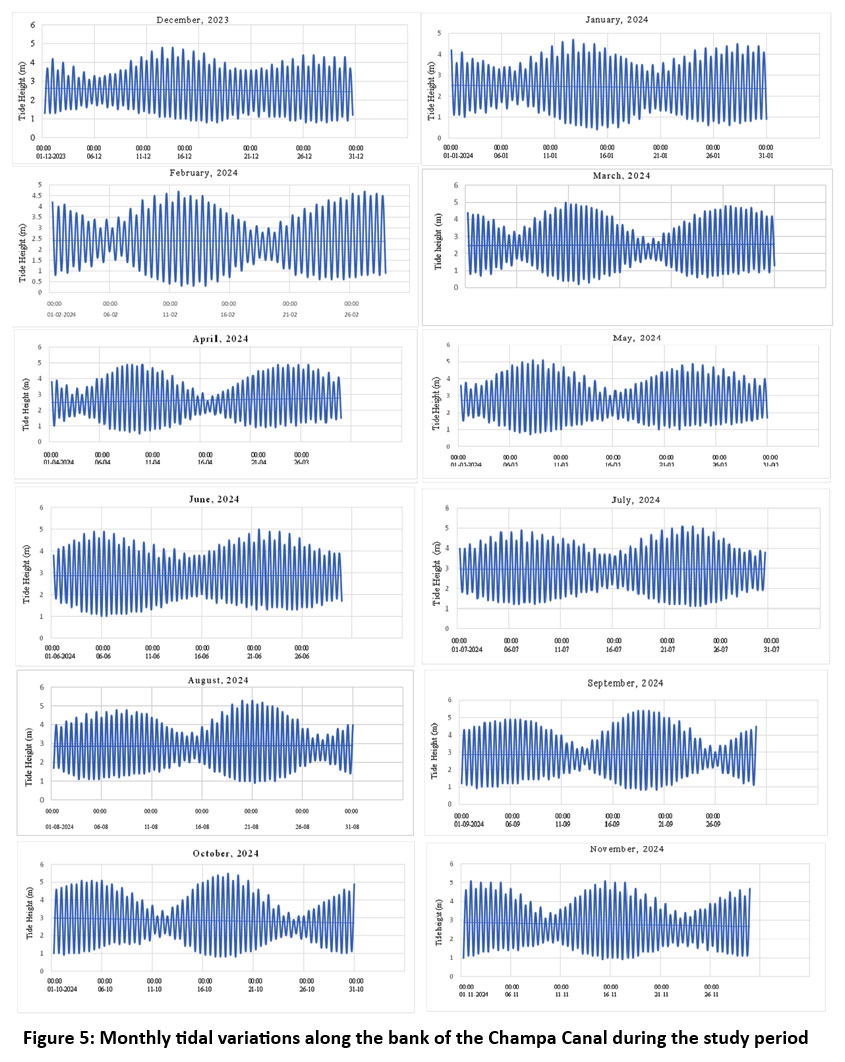 | Figure 5: Monthly tidal variations along the bank of the Champa Canal during the study period
|
Discussion
Mangrove diversity
In a previous study, a total of 37 true mangrove species and mangrove associates were listed along the Digha-Junput coastline.13 A thorough investigation in the Purba Medinipur district identified 23 angiospermic species, comprising 9 true mangrove species and 14 mangrove associates.16 In the same district, 20 mangrove associates from 15 families were found.17 This coastal region harboured 42 tidal vegetation species, including 6 true mangrove species and 36 mangrove associates.18 A recent study in the Champa Canal area of the Ramnagar-I block, Purba Medinipur district, discovered 3 true mangrove species and 8 associate mangroves.19 The brackish water area of the Champa Canal was categorised into three distinct zones (Z-I, Z-II, Z-III) according to salinity levels and the presence of tidal vegetation. Z-I is situated closest to the Bay of Bengal and is characterised by the presence of true mangroves and halophytic vegetation, resulting from significant salinity intrusion and tidal effects. Salinity intrusion in estuarine mangrove zones demonstrates both seasonal and spatial variability, as observed in the Krishnapatnam Coast and Paravoor mangrove ecosystems of India.35,36 In the Z-I zone, six true mangrove species dominate: Acanthus ilicifolius, Avicennia alba, Avicennia marina, Avicennia officinalis, Derris trifoliata, and Excoecaria agallocha. Additionally, four species, namely Aegiceras corniculatum, Bruguiera gymnorrhiza, Ceriops decandra, and Sonneratia apetala, are commonly found in this area. In Z-I, 34 out of 35 mangrove associates are present. Of these, 10 are classified as abundant, 16 as common, 7 as rarely available, and 1 as extremely rare. Species including Suaeda maritima, Suaeda monoica, Heliotropium curassavicum, Guilandina bonduc, Clerodendrum inerme, Myriostachya wightiana, and Azima tetracantha are prominent associates along the canal bank of Z-I. Leersia hexandra was absent in Z-I.
Zone-II exhibits moderate mangrove diversity alongside various vegetation types, attributed to the reduction of salinity and tidal influences as one moves inland. The location extends from the west side of Chowddomile Bridge to the bank of the Madhabpur canal. A total of 9 true mangrove species are recorded from Z-II. Among these, two species (Acanthus ilicifolius, Excoecaria agallocha) are abundant, three species (Avicennia alba, Avicennia officinalis, Derris trifoliata) are common, and four species (Aegiceras corniculatum, Avicennia marina, Bruguiera gymnorrhiza, Ceriops decandra) are rarely available. A total of 33 associate mangroves were documented in Zone-II. Calotropis gigantea and Cynodon dactylon are prevalent in this zone, with approximately 21 species being common and 10 species occurring rarely. Suaeda nudiflora and Casuarina equisetifolia were absent in Z-II.
Zone-III demonstrates the least mangrove diversity, primarily due to the predominance of freshwater flow and reduced salinity levels. The location is situated between Sabitrapur and the Paniparul Syphon bridge. The Champa Canal exhibits brackish water characteristics from Shankarpur Mohana to the Paniparul syphon.15 In Z-III, four mangrove species are identified: Acanthus ilicifolius and Excoecaria agallocha are common, while Avicennia officinalis and Derris trifoliata are rarely found. Aegiceras corniculatum, Avicennia alba, Avicennia marina, Bruguiera gymnorrhiza, and Ceriops decandra were absent in Z-III. Sonneratia apetala was not present in Z-II and Z-III. A total of 28 mangrove associates are present along the canal bank. The Calotropis gigantea shrub, Cyperus rotundus, and Cynodon dactylon herbs are prevalent in this zone. Certain exclusive mangrove associates, such as Sesuvium portulacastrum, Suaeda maritima, Suaeda nudiflora, Ipomoea pes-caprae, and Portulaca oleracea, are absent in this zone. Suaeda monoica and Clerodendrum inerme are notably rare species. Guilandina bonduc, Acacia nilotica, Pandanus odoratissimus, and Solanum trilobatum are prevalent species in this zone.
Within the true mangrove families, Acanthaceae accounts for 40%, while Rhizophoraceae represents 20%, and Primulaceae, Fabaceae, Euphorbiaceae, and Lythraceae each provide around 10%. The associate mangrove families Fabaceae and Poaceae each account for 11%. Both Amaranthaceae and Asteraceae contribute 9% each. Each family, including Aizoaceae, Convolvulaceae, Cyperaceae, and Solanaceae, contributes 6%. The remaining 13 mangrove associates contribute 3% each.
Species previously documented, such as Heritiera fomes, Derris scandens, Rhizophora mucronata, and Hibiscus tiliaceus,13,16,18 along the Purba Medinipur Coast, were absent in the current study. While presently recorded exclusive mangrove associates, such as Suaeda maritima and other related species, were absent in prior studies conducted in this region. Alien plants can proliferate swiftly due to the mobility of society and the deliberate transport of ornamental and forage species.37 According to a report, a total of 173 IAPS were introduced in India.37 Six invasive alien plant species (Chromolaena odorata, Parthenium hysterophorus, Opuntia dillenii, Prosopis juliflora, Solanum sisymbriifolium, Lantana camara) were identified in the study area. Their presence in this area is prevalent and increasing rapidly, posing a significant threat to the native biodiversity of the region. Among the recorded mangrove associates, 11 species are classified as NeMS, adapted to the tidal plain of Champa Canal as tidal vegetation. Among the 11 recorded NeMS, 5 are classified as IAPS-NeMS (excluding Prosopis juliflora), while the remaining 6 species are identified as native NeMS: Calotropis gigantea, Phoenix sylvestris, Capparis zeylanica, Casuarina equisetifolia, Euphorbia lactea, and Neptunia oleracea (Plate A and B).
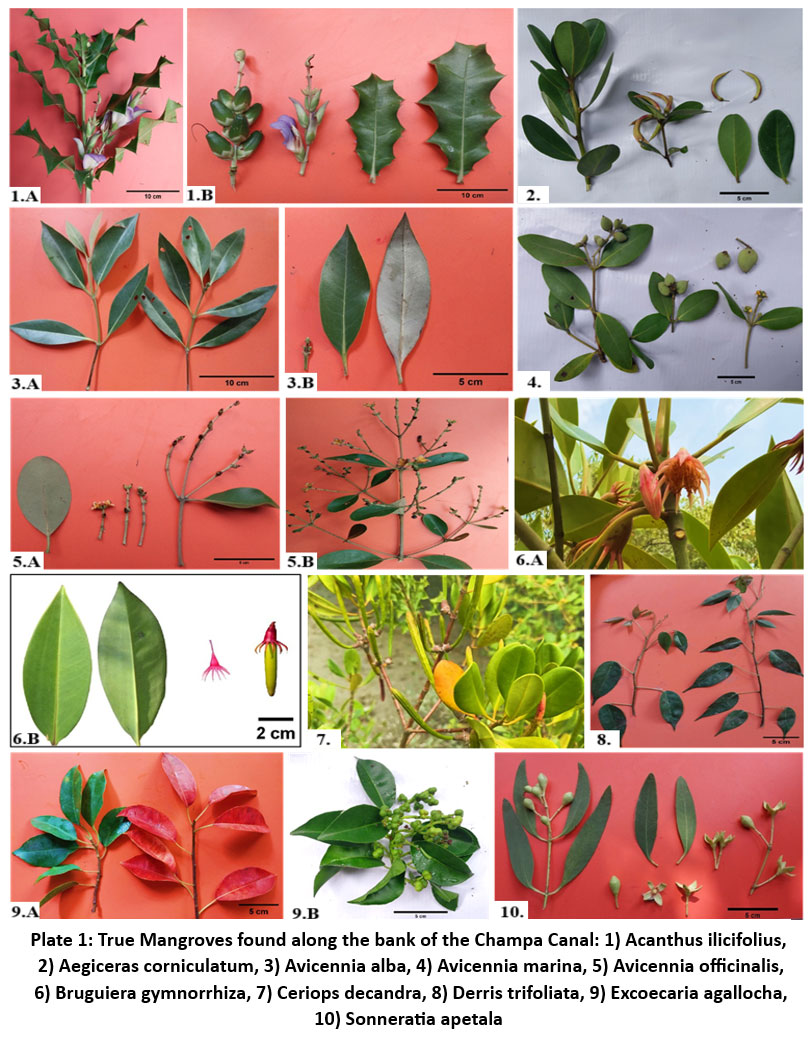 | Plate 1: True Mangroves found along the bank of the Champa Canal: 1) Acanthus ilicifolius, 2) Aegiceras corniculatum, 3) Avicennia alba, 4) Avicennia marina, 5) Avicennia officinalis, 6) Bruguiera gymnorrhiza, 7) Ceriops decandra, 8) Derris trifoliata, 9) Excoecaria agallocha, 10) Sonneratia apetala
|
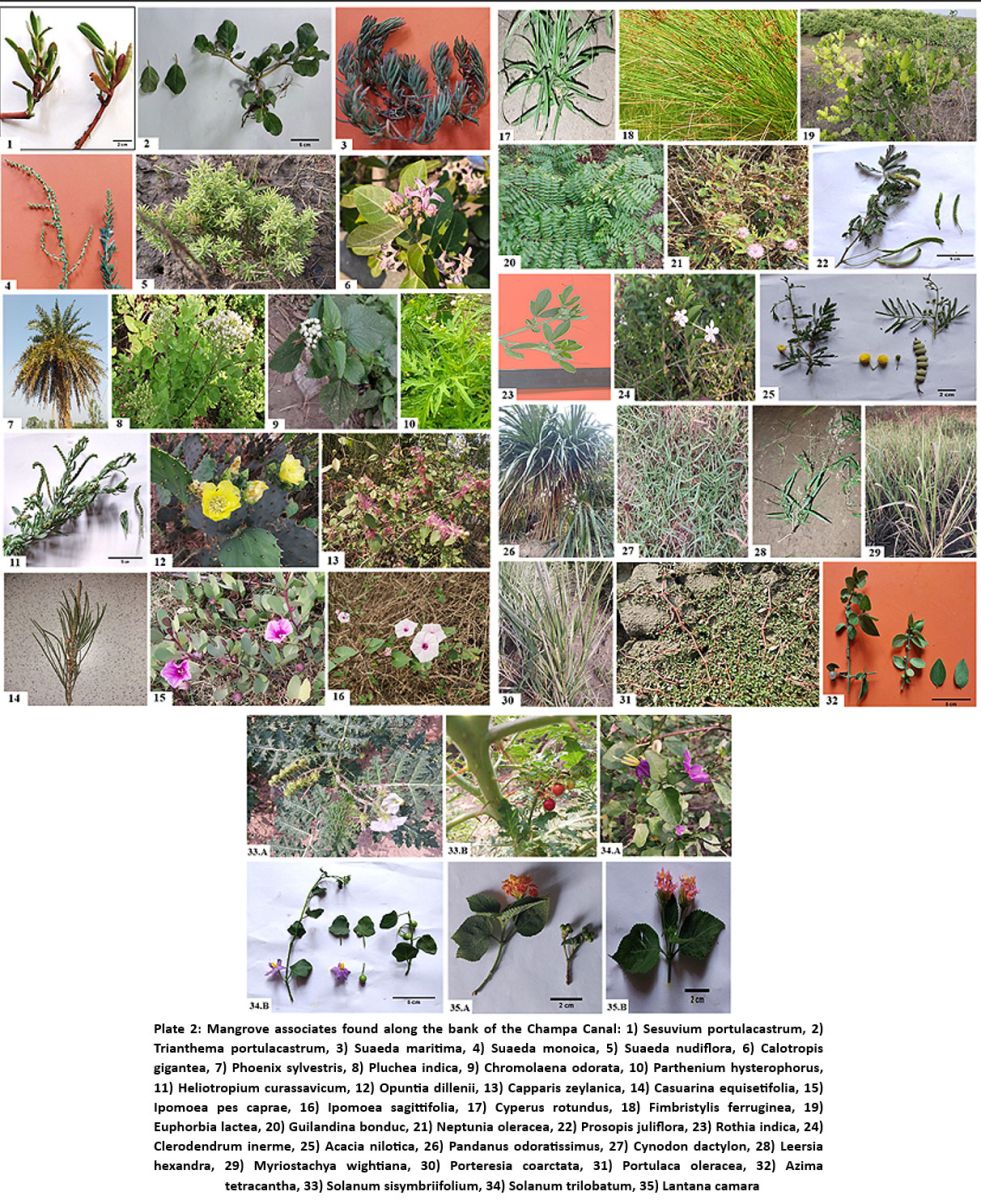 | Plate 2: Mangrove associates found along the bank of the Champa Canal: 1) Sesuvium portulacastrum, 2) Trianthema portulacastrum, 3) Suaeda maritima, 4) Suaeda monoica, 5) Suaeda nudiflora, 6) Calotropis gigantea, 7) Phoenix sylvestris, 8) Pluchea indica, 9) Chromolaena odorata, 10) Parthenium hysterophorus, 11) Heliotropium curassavicum, 12) Opuntia dillenii, 13) Capparis zeylanica, 14) Casuarina equisetifolia.
|
Water quality parameters
Air temperature ranged from 27.62°C (PoM) to 31.08°C (PreM). Air temperature peaks during PreM and reaches its lowest point during MoS, while PoM exhibits moderate temperature variation. In the mangroves of Kundapur temperature ranged from 24°C to 29°C,38 while temperature ranged from 25.4 °C to 31.2 °C in the Krishnapatnam mangroves.35 Surface water temperature varied between 23.1 °C (PoM) and 32.6 °C (PreM) in Z-II. All zones exhibited comparable trends with analogous seasonal variations. Surface water temperature is highest in PreM (Z-II) and lowest in PoM (Z-III). Surface water temperature is primarily influenced by photoperiod intensity, atmospheric temperature, evaporation, insolation, freshwater influx, and cooling, in addition to the ebb and flow from adjacent neritic waters.36
The pH reached its maximum in Z-I during the PreM season at 8.9, while it was at its minimum in Z-III during PoM at 6.3. The pH of Z-I was consistently higher across all seasons compared to the other two zones. Z-I represents the integrated bay and estuarine regions. This indicates a combined variation in pH, while the other two zones reflect a typical estuarine pH resulting from the mixing of fresh and marine water.39
Seasonal analysis of dissolved oxygen demonstrated an inverse correlation with temperature and salinity. Temperature and salinity are recognised factors influencing the solubility of oxygen in seawater.40 The current investigation observed elevated DO values during the Mos across all three zones and diminished values during PreM. Dissolved oxygen levels varied from 3.48 ppm to 5.31 ppm in the Champa Canal mangrove region. During PreM and PoM, dissolved oxygen (DO) levels were elevated in Z-I (4.31 ppm in PreM and 5.05 ppm in PoM) due to significant turbulence and mixing from tidal action in Z-I, with the desiccation of Z-III resulting from the absence of lotic waters from the Dubda Basin and various anthropogenic activities. The minimum dissolved oxygen (DO) level was observed in Z-III (3.48 ppm) during the PreM phase. The elevated levels seen on the opposite side during MoS DO in Z-II (6.5 ppm) may be attributed to substantial rainfall and freshwater flow from the upstream region. Different researchers obtained analogous results.41,42 The dissolved oxygen levels in the Paravoor mangrove ecosystem of Kerala ranged from 3.8 ppm to 5.2 ppm,36 whereas a fluctuation was noted in DO from 2.4 ppm to 5.0 ppm in the Pichavaram mangroves of Tamil Nadu.43
The alkalinity of the water sample ranged from 139.49 ppm to 206.78 ppm. The peak alkalinity was seen in Z-I during the PreM, whereas the minimum was noted in Z-III during the MoS. Z-I exhibited relatively elevated levels during all three seasons, while Z-II demonstrated a moderate value. The elevated alkalinity levels in the Z-I may be attributed to its proximity to the Bay of Bengal and the presence of abundant mangrove vegetation in these areas. The elevated pH levels at the downstream stations result from the amalgamation of saltwater with estuarine waters and the photosynthetic activity of mangroves, which consumes CO2, thereby altering the balance towards increased alkalinity.44
Electric conductivity (EC) serves as a measure of the concentration of dissolved salts in water. This is also characterised by the quantity of ions, both positive and negative, present in water, as well as the capacity of water to conduct an electrical current. This serves as an important measure of the salinity and overall salt concentration in a water sample.35 The electrical conductivity ranged from 7,124.09 µS/cm to 25,650.33 µS/cm during the study period. The observed higher and lower conductivity values during the PreM and MoS seasons may be attributed to the reduction in freshwater flow and increased evaporation rates, and vice versa. The current results align with the research conducted in the Sunderban mangroves,45 as well as in Bhitarkanika Mangrove.46
The BOD values in this study varied from 1.73 to 2.94 ppm over the three seasons, with elevated BOD levels noted during the monsoon and post-monsoon seasons, attributed to the microbial oxygen demand for decomposing suspended organic matter.47 The elevated BOD and reduced DO levels recorded at Z-III may be ascribed to anthropogenic activity in that area. Pristine rivers typically exhibit a 5-day BOD of less than 1 ppm, whereas highly contaminated rivers display BOD values ranging from 2 to 8 ppm.48 The current estuary segment of the Champa Canal is thus unfavourable regarding organic load and nitrogen levels. This represents the potential pollution risk from current agricultural and industrial operations in this region.
The total dissolved solids (TDS) range from 14,438.65 ppm to 23,720.14 ppm, signifying water pollution primarily resulting from the confluence of seawater and river water.49 Total Dissolved Solids (TDS) is typically linked to inorganic salts, and there exists a strong correlation between TDS and conductivity. While there is no universally applicable precise quantitative correlation between TDS and conductivity, elevated conductivity suggests high TDS.41 A study reported that the TDS levels in Sunderban mangrove regions varied from 7,200 to 12,900 ppm.45 TDS value ranged from 10,000 ppm to 30,000 ppm in the Bhitarkanika Mangrove.46 The total suspended solids (TSS) level during this present study period ranged from 79.35 ppm to 232.5 ppm. The elevated TSS values during the MoS and immediate PoM seasons, in contrast to the summer season, may be ascribed to rainfall, turbulent conditions, and the influx of dislocated fine earth materials from the catchment area via runoff into the mangrove ecosystem.35 A study recorded TSS ranged from 0.7 g/L to 3 g/L in Krishnapatnam Coastal mangroves.35
Nitrite in mangroves is a crucial element of the nitrogen cycle and contributes to different ecological processes. The concentration is affected by the system's oxidation or reduction conditions. Nitrite concentrations can impact the richness and variety of microbial communities, thereby influencing other creatures within the mangrove ecosystem.36 In the current investigation, nitrite levels varied from 0.09 ppm to 0.43 ppm. Peak nitrite concentrations were observed during MoS. Z-III exhibited the highest value, maybe attributable to anthropogenic activity in the region and the introduction of organic load from upstream sources. Nitrite concentrations observed between 0.04 and 0.87 uM in the western mangroves of Kachchh-Gujarat.50 Nitrates are an essential nitrogen source that affects plant growth and the overall productivity of mangroves.36 The nitrate concentration in the study area ranged from 0.16 ppm to 0.58 ppm. In the Bhitarkanika mangrove nitrate concentrations varied from 0.349 ppm to 1.067 ppm.46 The maximum nitrate value was identified during PreM. Phosphate content varied between 0.15 and 0.5 ppm. Elevated phosphate levels were recorded during the MoS, while reduced levels were noted during PreM. The elevated values recorded during the MoS season may be ascribed to runoff from agricultural and aquaculture areas.35 The phosphate concentration varied from 0.55 ppm to 2.59 ppm in Mahanadi mangrove ecosystem.41
Soil quality parameters
The mean salinity of Z-I was recorded at 18.9 ppt in the PreM, 16.28 ppt in the MoS season, and 18.3 ppt in the PoM. The highest salinity observed was 18.9 ppt during the PreM period. The salinity of water in Z-II varied between 9.72 and 11.4 ppt. The maximum salinity observed was 11.4 ppt during the PreM period, whereas the minimum recorded was 9.72 ppt during the MoS season. The water salinity in Z-III ranged from 2.17 ppt (MoS) to 4.9 ppt (PreM). A study indicated that salinity in the Krishnapatnam Coastal mangrove region of Andhra Pradesh ranged from 21 ppt to 33 ppt, with higher levels noted in summer and lower levels during the monsoon, due to rainfall and freshwater inflow from the land.35 The salinity values observed in the Paravoor mangrove ecosystem study in Kerala ranged from 15.8 ppt to 48.31 ppt.36
The primary determinant of mangrove sediment is soil pH, which varied from 5.95 (Z-II during PreM) to 6.68 (Z-I during MoS). Throughout the study period, soil pH remained consistent across the three seasons, showing no significant variation. However, a relatively elevated pH value was noted during MoS compared to PreM and PoM. The elevated pH levels observed during the rainy season can be attributed to the influx of rainwater.51 pH ranged from 7.4 to 8.2 for mangrove soils in the Indian Sunderbans.52
Electrical conductivity ranged from 1.53 dS m-1 in Z-III during MoS to 3.97 dS m-1 in Z-I during PoM. The current study recorded higher values during the PoM season and minimal values during the MoS season. The electrical conductivity of a soil solution increases with higher ion concentration.53 High soil conductivity results from the infiltration of seawater during high tides, water evaporation, and the capillary rise of groundwater during low tides.54
This study reports that the available nitrogen ranges from 156.44 to 230.22 kg/ha. The maximum value was recorded during PoM in Z-I, whereas the minimum value was noted during MoS in Z-III. In Z-I, a high nitrogen value was observed due to the trapping of detritus by finer particles, leading to a significant increase in bacterial population, which subsequently contributed to elevated nitrogen levels. This behaviour was attributed to the elevated organic carbon content in these soils.52 A nearly identical situation was observed regarding phosphorus content. The soil in Z-I, dominated by mangroves, demonstrated a higher availability of phosphorus compared to Z-II and Z-III. Soil phosphorus content varied from 24.1 kg/ha in Z-I during the MoS to 18.4 kg/ha in Z-III during the PoM. The observed low phosphate levels following monsoon seasons can be attributed to restricted freshwater flow, increased salinity, and phosphate consumption by phytoplankton. Fine sediments in muddy areas exhibit a higher efficiency in phosphorus adsorption compared to coarse-grained sediments. This likely explains the abundant growth of mangroves in muddy environments.55 The potassium content in soil ranged from 213.38 kg/ha in Z-III during PreM to 368.89 kg/ha in Z-I during MoS. No significant variation in phosphorus content was observed across all seasons. The average soil potassium values ranged from 117.43 kg/ha in the MoS season to 537.63 kg/ha in the MoS season in the Kundapura mangroves of Karnataka.56
Tidal variance
The tide serves as the primary controlling factor in estuarine hydrodynamic processes, facilitating the advection and dispersion of fluvial materials in coastal water bodies and resulting in significant alterations to the nearby beaches and the bottom topography of the estuarine region.57 The range of spring tides is between 2.6 and 5.5 meters, while the range of neap tides was from 0.2 to 2.3 meters. The peak spring tide height was recorded in October 2024, while the minimum occurred in March and April 2024. The peak neap tide height was recorded in September 2024, while the minimum was noted in March 2024.
The tidal pattern along this coast is predominantly meso-tidal and semi-diurnal. The tides cause seawater intrusion in the sanctuary, leading to a brackish salinity regime essential for the survival of vegetation and animals, including mangroves. Tidal changes significantly influence sedimentation patterns and nutrient distribution in estuarine mangrove regions, hence sustaining their rich biodiversity.58 The seasonal variations in the tidal range were examined in the Bhitarkanika Mangrove where spring tide ranged 3.1–3.7 meters, while the neap tide range was 0.6–1.4 meters.57
Conclusion
The current work shows that the Champa Canal preserves rather great diversity of mangroves and related species, mostly formed by salinity gradients, soil conditions, and tidal dynamics. Increased salinity and tidal effects have improved species richness and ecological complexity in Zone-I; diversity is much reduced in Zone-III, freshwater dominated. The acquired data distinctly demonstrate the significant impact of hydrological and edaphic factors on mangrove distribution. This method underscores the significance of targeted conservation efforts grounded in site-specific biological dynamics. Respond promptly to oversee and control invasive species, restore compromised ecosystems, and curtail extensive human activities. The findings offer crucial insights for the management of sustainable estuaries and considerably enhance existing understanding of regional mangrove conservation.
Acknowledgement
The authors are profoundly grateful to Midnapore City College Midnapore City College, Midnapore, India, for providing the necessary support and facilities to carry out this study.
Funding Sources
The author(s) received no financial support for the research, authorship, and/or publication of this article.
Conflict of Interest
The authors do not have any conflict of interest
Data Availability Statement
All data supporting the findings of this study are available within the manuscript in the form of tables.
Ethics Statement
This research did not involve human participants, animal subjects, or any material that requires ethical approval.
Informed Consent Statement
This study did not involve human participants, and therefore, informed consent was not required.
Permission to reproduce material from other sources
Not Applicable
Authors’ contributions
Avik Bhanja: Conceptualization, Methodology, Writing – Original Draft, Sampling, Data Collection, Analysis.
Pijush Payra: Conceptualization, Analysis, Sampling, Writing – Review & Editing.
Indrajit Sau: Analysis, Review & Editing.
Sandip Makur: Field Support, Data Curation.
Dishani Biswas: Literature Review, Visualization.
Tapas Bhunia: Data Curation, Literature Review.
Nibedita Sinha: Formatting, Referencing.
References
- Mandal A.K. Fauna of Sunderban mangrove Ecosystem, West Bengal. Zool. Surv. India. 1989: 116p.
- Wakle V.B., Khomne A.V, Dhabe A.S. Diversity of mangroves in Goa, central west cost of India. Inter Jour Bot Stud. 2018; 3(3): 65-67.
- VijayaKumar K.M., Kumara V. Diversity of true mangroves and their associates in the Kundapura region, Udupi district, Karnataka, Southwest coast of India. Curr Botany. 2012; 3(2): 03-09.
- Guebas F.D., Javatissa L.P., Nitto D.D., Bosire J.O., Seen D.L., Koedam N. How effective were mangroves as a defense against the recent tsunami? Current Biology. 2005; 15(12): 443-447. https://doi.org/10.1016/j.cub.2005.06.008
CrossRef - Mitra S, Shaw S, Mishra S.S. Animal diversity in the mangrove forest at Bichitrapur of Balasore district, Odisha, India- A case study. Rec Zool Surv India. 2019; 119(1): 9-17. https://doi.org/10.26515/rzsi/v119/i1/2019/122954
CrossRef - Giesen W, Wulffraat S, Zieren M, Scholten L. Mangrove Guide Book for Southeast Asia. FAO and Wetlands International. RAP Publication 2006/07. 2006: 198p.
- Amadi A.N, Olasehinde P.I, Okosun E.A, Yisa J. Assessment of the Water Quality Index of Otamiri and Ramiriukwa Rivers. Phys Int. 2010; 1:116-123. https://doi.org/10. 3844/ pisp.2010.116.123
- Chatterjee M, Shankar D, Sen G.K, Sanyal P, Sundar D, Michael G.S, Chatterjee A, Amol P, Mukherjee D, Suprit K, Mukherjee A, Vijith V, Chatterjee S, Basu A, Das M, Chakraborti S, Kalla A, Misra S.K, Mukhopadhyay S, Mandal G, Sarkar K. Tidal variations in the Sundarbans Estuarine System, India. Jour Ear Syst Sci. 2013; 122: 899-933. https://doi.org/10.1007/s12040-013-0314-y
CrossRef - Forest Survey of India. India State of Forest Report 2023. Ministry of Environment, Forest and Climate Change, Government of India. 2023; Vol. II: 428p. https://fsi.nic.in/isfr-2023
- Upadhyay V.P, Ranjan R, Singh J.S. Human mangrove conflicts: The way out. Current Science. 2002; 83(11): 1328-1336.
- Naskar K.R. Manual of Indian Mangroves. New Delhi, India: Daya Publishing House; 2004.
- Bhunia T, Saxena S, Payra P. A Study on the Availability of Finfish and Shellfish of Junput Mangrove, East Midnapore, West Bengal, India. Uttar Pradesh Jour Zool. 2024; 45(18): 616-34. https://doi.org/10.56557/upjoz/2024/v45i184479
CrossRef - Chaudhuri S, Das I. Naturally Colonized Mangroves in the Digha-Junput Coast, West Bengal with their Ethno-Medicinal Value. Indian Forester. 2009; 135 (4): 539-546. http://dx.doi.org/10.36808/if%2F2009%2Fv135i4%2F378
- Irrigation and Waterways Directorate. Annual Flood Report 2023. Government of West Bengal; 2024. 252p. https://wbiwd.gov.in/uploads/anual_flood_report/Annual-Flood-Report-2023.pdf. August 2024. Accessed on January 8th, 2025.
- Payra P, Mandal B, Rana G.C. Study of Ichthyofaunal Diversity of Negua Diversion Canal of Purba Medinipur District. Trend Fisher Res. 2018; 7(3): 24-39.
- Das D.C., Pati M, Mahato G, Das M. Study of tidal vegetation of Purba Medinipur district of West Bengal, India. Intern Jour Bioass. 2015; 4 (05): 3915-3921.
- Jana B. Mangroves Associate Plant Species in East Midnapore District, West Bengal, India. ABHIYANTRIKI: An Intern Jour Engineer Tech. 2016; 3(3): 17-24.
- Jana B, Mondal A.K. Studies on tidal vegetation in East Midnapore Coastal Belt, West Bengal, India. World Jour Environ Biosci. 2020; 9(2): 35-39.
CrossRef - Bhanja A, Sinha N, Mandal B, Payra P. Diversity of Aquatic Macrophytes in Four Blocks of Purba Medinipur District, West Bengal, India. Ind J Pure App Biosci. 2023; 11(1): 1-8. http://dx.doi.org/10.18782/2582-2845.8974
CrossRef - Tides4Fishing. https://tides4fishing.com. Accessed from December 1st, 2023 to November 30th, 2024.
- Tideschart.com. https://www.tideschart.com. Accessed from December 1st, 2023 to November 30th, 2024.
- Banerjee L.K., Sastry A.R.K., Nayar M.P. Mangroves in India – Identification Manual. Calcutta: Botanical Survey of India; 1989. 140p.
- Kumudranjan N, Rathindranath, M. Ecology and biodiversity of Indian Mangroves. New Delhi, India: Daya Publishing House; 1999. 783p.
- Kathiresan K. Flora and Fauna in mangrove ecosystem: A manual for identification. All India coordinated project on coastal and marine diversity, training and capacity building and Coastal diversity (East–West). Parangipettai: Ministry of Environment and Forest, CAS in Marine Biology; 2000.
- Reddy C.S. Field Identification Guide for Indian Mangroves. New Connaught Place, Dehra Dun, India: Bishen Singh Mahendra Pal Singh; 2008. 100p.
- Barik J, Chowdhury S. True Mangrove Species of Sundarbans Delta, West Bengal, Eastern India. Check List. 2014; 10(2): 329-334.
CrossRef - India Biodiversity Portal. https://indiabiodiversity.org. Accessed in January 2025.
- eFlora of India. https://efloraofindia.com. Accessed in January 2025.
- International Union for Conservation of Nature. The IUCN Red List of Threatened Species, Version 2023-2, IUCN, 2023. www.iucnredlist.org. Accessed in January 2025.
- APHA. Standard Methods for the Examination of Water and Wastewater. Lipps W.C, Braun-Howland E.B, Baxter T.E. Washington: American Public Health Association; 2017. 1516 P.
- Jackson M.L. Soil Chemical Analysis. New Delhi: Prentice Hall of India (Pvt.) Ltd.; 1973. 498p.
- Subbiah B.V., Asija G.L. A Rapid Procedure for the Estimation of Available Nitrogen in Soils. Current Science. 1956; 25: 259-260.
- Olsen S.R., Cole C.V., Watanabe F.S. Estimation of Available Phosphorus in Soils by Extraction with NaHCO3. USDA Circular No. 939. Washington DC: US Government Printing Office; 1954.
- Metson A.J. Methods of chemical analysis for soil survey samples. New Zealand D.S.I.R. Soil Bureau, Bulletin No. 12: 1956; 208p.
- Dattatreya P.S., Madhavi K, Satyanarayana B, Amin A, Harini C. Assessment of Physico-chemical Characteristics of Mangrove Region in the Krishnapatnam Coast, India. Intern Jour Curr Microb Appl Sci. 2018; 7(5): 2326-2342.
CrossRef - Vijayan R, Suresh A.S., Mathew S. Analysis of Physico Chemical Properties in the Mangrove Ecosystem of Paravoor, Kollam District, Kerala, South India. Jour Chem Heal Risk. 2024; 14(3): 54-69.
- Reddy C.S., Bagyanarayana G, Reddy K.N., Raju V.S. Invasive Alien Flora of India. Usgs, USA: National Biological Information Infrastructure; 2008.
- VijayaKumar K.M., Kumara V. Avifaunal diversity of mangrove ecosystem, Kundapura, Udupi district, Karnataka, India. Recen Res Sci Tech. 2011; 3(10): 106-110.
- Chauhan R, Ramanathan A.L. Evaluation of water quality of Bhitarkanika mangrove system, Orissa, east coast of India. Indian Jour Mari Sci. 2008; 37 (2): 153-158.
- Vijayakumar S, Rajesh K.M., Mendon M.R., Hariharan V. Seasonal distribution and behaviour of nutrients with reference to tidal rhythm in the Mulki estuary, south-west coast of India. Jour Mari Biol Assoc India. 2000; 42 (1&2): 21-31.
- Behera B.C., Mishra R.R., Patra J.K., Dutta S.K., Thatoi H.N. Physico Chemical Properties of Water Sample Collected from Mangrove Ecosystem of Mahanadi River Delta, Odisha, India. American Jour Mari Sci. 2014; 2(1): 19-24.
- Pradhan F.C., Bhuyan N.K., Pradhan N.K., Routroy H.K. Assessment of water quality in terms of physico-chemical parameters of Bhitarkanika mangrove system, Odisha, India. Inter Jour Devlop Res. 2014; 4(12): 2702-2705.
- Prabu V.A., Rajkumar M., Perumal P. Seasonal variations in physico-chemical characteristics of Pichavaram mangroves, southeast coast of India. Jour Environ Biol. 2008; 29(6): 945-950.
- Ruttner F. Fundamentals of Limnology. Frey, D.G. and Fry, F.E.J. (Translated). Canada: University of Toronto Press; 1953. 254p.
CrossRef - Ashish V.M., Ashwinova G. Water and soil quality analysis of selected areas of Sunderban and mapping using GIS technique. Inter Jour Res Chem Environ. 2015; 5(4): 44-59.
- Chaudhary S.R., Trivedi R. Physico-Chemical Analysis of Water Quality of Bhitarkanika Mangrove Forest, Odisha, India. Inter Jour Environ Sci. 2024; 13 (3): 57-62.
- Murugan A, Ayyakkannu K. Ecology of Uppanar backwater, Cuddalore. I. Physico-chemical parameters. Mahasagar- Bullet Nation Instit Oceanog. 1991; 24(1): 31-38.
- WBPCB. Rapid estimation of major wastewater discharges to the river Hooghly between the stretch of Palta to Dhankheti Khal. Government of West Bengal: Report of West Bengal Pollution Control Board; 2003. 1-19.
- Chahuan R, Ramanathan A.L. Evaluation of water quality of Bhitarakaika mangrove ecosystem, Orissa, East coast of India. Indian Jour Mar Sci. 2008; 37: 153-158.
- Saravanakumar A, Rajkumar M, Serebiah J.S., Thivakaran G.A. Seasonal variations in physico-chemical characteristics of water, sediment and soil texture in arid zone mangroves of Kachchh Gujarat. Jour Environ Biol. 2008; 29(5): 725-732.
- Patel R, Christian L, Bhagat R, Kamboj R.D., Salvi H. Physico-chemical characteristics of mangrove soil in Gulf of Kachchh, Gujarat, India. Advan Environ Res. 2019; 8(1): 39-54.
- Dasgupta M, Ghosh A, Naskar K.R. A Comparative Study on the Properties of Mangrove and Non-Mangrove Soils of Sundarbans, West Bengal, India. Advan Clinic Toxic. 2018; 3(2): 000129.
CrossRef - Kekane S.S., Chavan R.P., Shinde D.N., Patil C.L., Sagar S.S. A review on physico-chemical properties of soil. Intern Jour Chem Stud. 2015; 3(4): 29-32.
- Ataullah Md., Mohammad M.R.C., Sirajul H, Ashfaque A. Physico-chemical properties of soils and ecological zonations of soil habitats of Sundarbans of Bangladesh. Intern Jour Pure Appl Res. 2017; 1(1): 80-93.
- Sahoo K, Jee P.K., Dhal N.K., Das R. Physico-Chemical Sediment Properties of Mangroves of Odisha, India. Jour Oceanog Marin Res. 2017; 5(2): 162. https://10.4172/2572-3103.1000162
- Vijayakumar K.M., Kumara V. Physico-Chemical Analysis of Mangrove Soil, Kundapura, Karnataka, India. Curr World Environ. 2020; 15(3): 624-631. http://dx.doi.org/10.12944/CWE.15.3.27
CrossRef - Chilika Development Authority. Hydro- Ecology of Bhitarkanika Mangroves, Odisha- An Assessment for Integrated Management. Prepared for Indo-German Biodiversity Programme (GIZ): 2023; 155p.
- Zaman M.S., Chowdhury T.H. The Sundarbans, the World’s Largest Tidal Halophytic Mangrove Forest: Its Economic and Ecological Significance. Bang Jour Interdiscip Sci. 2024; 2 (1): E1-E15. https://doi.org/10.5281/zenodo.12683069


