Evaluating the Effects of Urbanization on Surface Water Quality in Mangalore, Dakshina Kannada District, Karnataka, India.
Yogesha Doora Shivanna1
*
 , Umesh Chandra2
and Sandeep Nayak3
, Umesh Chandra2
and Sandeep Nayak3
1
Department of Civil Engineering,
Mysore College of Engineering and Management,
Mysore,
Karnataka
India
2
Department of Civil Engineering,
Alva's Institute of Engineering and Technology,
Moodbidri, Mangaluru,
Karnataka
India
3
Department of Civil Engineering,
Maharaja Institute of Technology,
Thandavapura, Mysuru,
Karnataka
India
http://dx.doi.org/10.12944/CWE.20.2.27
Copy the following to cite this article:
Shivanna Y. D, Chandra U, Nayak S. Evaluating the Effects of Urbanization on Surface Water Quality in Mangalore, Dakshina Kannada District, Karnataka, India. Curr World Environ 2025;20(2). DOI:http://dx.doi.org/10.12944/CWE.20.2.27
Copy the following to cite this URL:
Shivanna Y. D, Chandra U, Nayak S. Evaluating the Effects of Urbanization on Surface Water Quality in Mangalore, Dakshina Kannada District, Karnataka, India. Curr World Environ 2025;20(2).
Download article (pdf)
Citation Manager
Publish History

Introduction
Urbanization and population increase have resulted in variations in land cover and land use on a local to global scale. This process has the potential to significantly alter the structure and function of ecosystems1. Although they make up only 2% of the planet's land area, cities create 78% of greenhouse gases, which has a substantial impact on global climate change. Because of the benefits that the oceans provide, including a food source, a means of transportation, a position that can be defended, and a healthy environment, humans have historically dwelt along the coast. Most main cities are situated along the coast, and halved of the global populations lives inside the hundred kilometres of sea.2,3 Urban areas are a major source of the pollution that is putting strain on the seas and oceans. Waste water and sewage discharge from cities is one of the significant harmful approaches that cities contaminate coastal areas. Numerous cities around the coast release waste water, including sewage and industrial effluent, straight into the nearby rivers and seas. Improper disposal of plastics and other waste, contamination from household activities like using detergents and medications, untreated sewage and industrial wastewater containing chemicals and heavy metals, and urban storm water runoff that transports oil, grease, pesticides, and litter from streets and roofs. Because of pollution, habitat destruction, and overexploitation, the concentration of human populations close to the coast seriously damages freshwater supplies and aquatic ecosystems. These effects harm human health and marine biodiversity, disturb delicate coastal ecosystems, and deteriorate water quality.
The aquatic ecosystems that surround coastal communities, including estuaries, rivers, oceans, seashores, and coastal wetlands, have been heavily contaminated by pollution as a result of urbanization, industrialization, population increase, and differing farming practices. This leads to the deterioration of the environment. The sustainability of coastal environments is significantly hampered by pollution.4 Substantial industrial areas in the study region are found along the banks of the Gurupur and Nethravati rivers, which combine to form a single estuary before entering the Arabian Sea. Untreated home and industrial waste discharge and disposal into estuaries, rivers, nearshore waterways, and harbor operations are the main causes of coastal pollution in the study area.5 Two of the rivers that run westward in the Mangaluru coastline region are Gurupura and Nethravthi. The adjacent industries discharge a significant quantity of pollutants into them, which degrades the water's quality. For this research, seven surface water samples, including river water, were collected, for this investigation throughout the monsoon, pre-monsoon, and post-monsoon and subjected to established procedures for the analysis of multiple water quality indicators. Unplanned urbanization has significant continuing effects on both the human health and environment. Two particularly persistent and rapidly-evolving issues are air pollution from traffic smoke and water contamination from urban debris.6 In unplanned cities, access to safe drinking water is becoming increasingly difficult for residents, and municipal supplies are not always reliable. Groundwater supplies are also being impacted by sewage pipe leaks. Water shortages are something that most people deal with on a regular basis. Human waste and an inadequate sewage system, which are major causes of water pollution and seep into subsurface water sources, are significant factors that contribute to the impureness of the water in metropolitan areas.7 The release of domestic trash into water supplies is a practical aspect of urbanization, and this activity causes changes that impact the stability of the environment and the quality of the water for a variety of reasons. Urbanization, however, is one of the biggest issues groundwater planners face and one of the most detrimental elements affecting the quality of streams. Industrial waste give rise to a serious hazard to human health and water supplies. Aquatic creatures are negatively impacted by waste released from manufacturing processes, including untreated effluents, heavy metals, poisons, alkaline compounds, and contaminants.8 South Kanara, also known as Dakshina Kannada, is the 4866 square kilometer southern coastal district of the state of Karnataka. The district is situated between latitudes 120 57' and 130 50' north and longitudes 740' and 750' east. At its thinnest, it is around 177 kilometer length, 40 kilometer width, 80 kilometer width,9 and 20, 83,625 people are living there, according to the 2011 census. The Udupi district forms the district's northern boundary, to the east by the Shimoga, Chickmagalur, and Hassan districts, to the south by the Coorg district and the Kerala state's Kasaragod district, and to the west by the Arabian Sea. In addition to having the maximum literateness rate in Karnataka (88.62%).9 Dakshina Kannada district is well-known for its professional and higher education institutions as well as its banking industry. In Karnataka, it is second evenly more compactly district with a population,of 457 people per square kilometer. Over the past few decades, the seaside region of the Dakshina Kannada (DK) district has experienced incredible growth. This area expanded due to increased commercial activity with the establishment of a significant seaport in Panambur, as well as industry expansion as fertilizers, iron ore pelletization, and petrochemicals. Furthermore, it is anticipated that the planned establishment and growth of Mangalore's Special Economic Zones (SEZs) will accelerate the trend of development. Dakshina Kannada district has the second-highest number of registered vehicles in the state of Karnataka. The number of registered automobiles is increasing annually by over 10%.10 The Regional Transport Office in Mangalore reports that approximately thirty thousand automobiles were registered in 2010 and 2011, while thirty-five thousand vehicles were registered in 2012 up until the month of March. 22,659 two-wheelers and 6,574 vehicles had been registered between June 2019 and May 2020, according to data from the regional transport office in Mangalore. There was a slight increase up until May 2021, when 7,957 cars and 25,702 two-wheelers were registered. The principal objective of this investigation is to know the influence of urbanization on water resources in Mangalore, along with specific objective, to collect water samples in different locations of Netravati and Gurupur River and to conduct standard laboratory tests for important water quality parameters and, to Analyze Water quality using WHO and BIS guidelines, weighed arithmetic Index method is employed to assess the urbanization impact on water quality.
Materials and Methods
Demography
According to the Census of India 2001, the urban area of Mangalore had citizens of 601 thousand in 2001, up from 44 thousand in 1901. The urban population growth of Mangalore from 1901 to 2001 is depicted in Figure 1. Between 1991 and 2001, there was a 4% annual increase in population growth, up from 1% between 1901 and 1911.
In 2011, 488,968 people called Mangalore home. Mangalore city has 488,968 residents, however there are 623,841 people living in its urban and metropolitan areas.
The city of Mangalore had 724,159 residents in 2021.10 A study conducted in 2011 on literacy rates in India found that 96.49% of men and 91.63% of women were literate.10
Six years old and younger made up about 8.5% of the population.10 In Mangalore city, 7726 people, or 1.55% of the total population, lived in slums.11 Urban population growth in Mangalore shown in Fig 1.
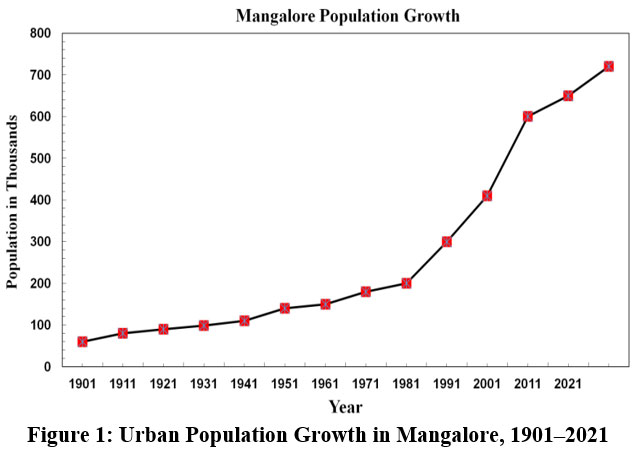 | Figure 1: Urban Population Growth in Mangalore, 1901–2021
|
Methodology
The surface water samples from the locations (Fig 2) were collected from seven locations during the monsoon, before and after the year 2019 monsoon. July to September was taken as monsoon, and pre monsoon season from march to may, while October to December as the post-monsoon season. In accordance with the protocol recommended from APHA (American Public Health Association) (APHA, 2005),11 total 84 surface water samples were collected. The methodology flow chart shown in Fig 2. The samples were drawn from the locations by using composite sampling methodology. Since water levels and depths vary with the seasons, rainfall, and location along the river, there is no single depth for the Netravati and Gurupur River; instead, the average depth, 1.5 m, is set for the duration of the study.
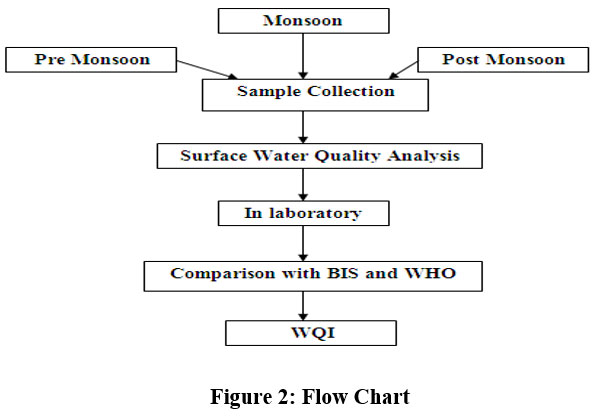 | Figure 2: Flow Chart
|
Study Area
The research area shown in Figure 3 is the seaside area of the DK regionin the Karnataka state of India. It is positioned in between latitudes 12°45' N and 13°7'30" N and longitudes 74°45' E and 75° E. Nethravati and Gurpur are the study area's two principal rivers. We solely took into account the city's Central and Southern regions for our analysis. The quality assessment in this study was limited to Netravati and Gurupura River. The locations of the samples are shown in Table 1 in addition to longitude and latitude data, providing a brief overview of the sample locations.
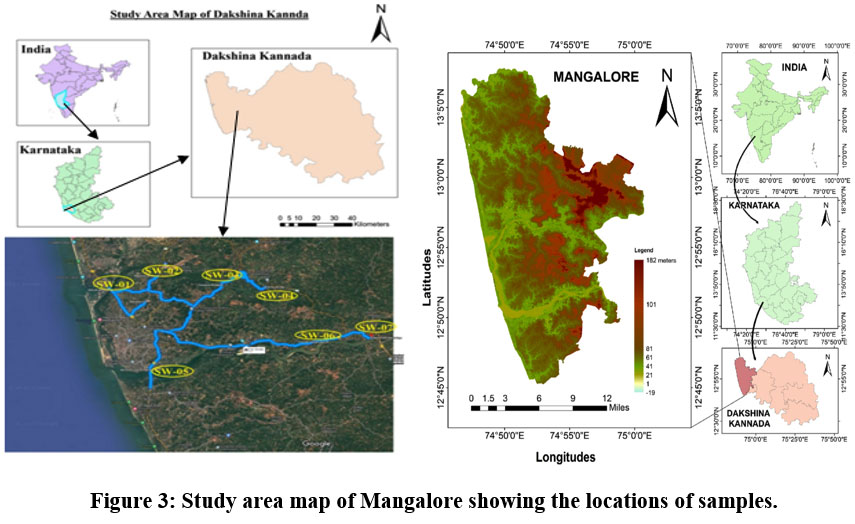 | Figure 3: Study area map of Mangalore showing the locations of samples.
|
Topography and Climate
The research area receives 3955 mm of rainfall on average annually, with 87% of that amount falling between June and September during the South-West monsoon. Temperature ranges from 17 to 37 degrees Celsius are typical for the tropical climate, which is also rather humid. Dense vegetation coexists with undulating topography in the research region. On top of friable sandstones and granitic gneisses is lateritic soil. On the banks of rivers, alluvial deposits are found. Sand accumulations make up the beaches. Mean fluctuation is between 6 and 7 m, and the average depth to the water table is between 7 and 9 m.
Results and discussions
The samples were drawn from the locations by using composite sampling methodology. Samples of surface water were taken throughout the monsoon, postmonsoon, and pre-monsoon seasons. Following extensive cleaning, 84 surface water samples were meticulously gathered in sterile polythene bottles, each of which was appropriately labeled. GPS coordinates were taken at each site to determine precise sampling positions, and after then, these coordinates were used to generate a sampling site map using Arc GIS 10.8. Every collected sample was analyzed in a lab, and the outcomes are compared with BIS and WHO guidelines. Weighted Arithmetic Index Method was used to calculate water’s WQI.12
Table 1: List of Surface Water Sampling Locations with Latitude and Longitude
Sample Names | Sample Location | Latitude | Longitude |
SW- 01 | Gurpur River- Kulur Bridge | 12o55' 34.79"N | 74o49' 37.4"E |
SW- 02 | Gurpur River –Maravoor Bridge | 120 56' 27.157" N | 740 51' 57.710" E |
SW- 03 | Gurpur River- Gurpura Bridge | 120 55' 56.427" N | 740 55' 06.076" E |
SW- 04 | Gurpur River- Addur Bridge | 120 55' 44.205" N | 740 57' 13.958" E |
SW- 05 | Nethravati River- NethravatiBridge | 120 50' 25.328" N | 740 51' 35.756" E |
SW- 06 | Nethravati River- Thumbe Vented Dam | 120 52' 20.341" N | 750 00' 17.912" E |
SW- 07 | Nethravati River- Pane Mangalore Bridge | 120 52' 48.487" N | 750 02' 22.316" E |
Water quality analysis
Seventeen physicochemical parameters of water samples were analyzed utilizing the protocols outlined in Standard Methods (APHA, 2017).13 Table 2 shows the list of tests that were conducted as well as the methodology.
Table 2: Methods used for water quality analysis
Number | PARAMETERS | METHOD USED |
1 | Cadmium | Anodic Stripping Voltammetry |
2 | Chlorides | Argentometric Method |
3 | Copper | Anodic Stripping Voltammetry |
4 | EC | Conductivity Meter |
5 | DO | Membrane Electrode Method |
6 | Fluorides | Ion- Selective Electrode Method |
7 | Hardness | EDTA Titrimetric Method |
8 | Iron | Phenanthroline Method |
9 | Lead | Anodic Stripping Voltammetry |
10 | Manganese | Persulfate Method |
11 | Nitrates | Brucine Method |
12 | pH | Electrode |
13 | Sodium | Flame Photometric Method |
14 | Sulfates | Turbidimetric Method |
15 | TDS | Conductivity -TDS Meter |
16 | Turbidity | Nepholometric Method |
17 | Zinc | Anodic Stripping Voltammetry |
WHO and BIS guidelines
There are two categories of water quality parameters, according WHO guidelines. Health criteria take into account chemical and radioactive components that have the potential to directly harm human health, while acceptance guidelines include characteristics that may not have any direct health consequences but cause an unpleasant taste or odor in the water (WHO 2017). The BIS water quality and World Health Organization's (WHO) recommendations are listed in Tables 3.14
Table 3: BIS and WHO Specification for Drinking Water (BIS- 10500: 2012), (WHO, 2017).
Parameter | Unit | BIS Guideline | Guideline Type | WHO Guideline | Guideline Pattern |
Cadmium, Cd | ug / L | 3 | Acceptable | 3 | Health |
Chlorides, Cl- | Mg/L | 250 | Acceptable | 250 | Acceptability |
Copper , Cu | Mg/L | 0.05 | Acceptable | 2.0 | Health |
EC | uS / cm | 300 | Acceptable | 400 | Acceptability |
DO | Mg /L | 6 | Acceptable | 6.5-8 | Acceptability |
Fluorides, F- | Mg/L | 1 | Acceptable | 1.50 | Health |
Hardness | Mg/L | 200 | Acceptable | 200 | Acceptability |
Iron, Fe | Mg/L | 0.3 | Acceptable | 0.3 | Acceptability |
Lead, Pb | ug/ L | 10 | Acceptable | 10 | Health |
Manganese, Mn | ug/ L | 100 | Acceptable | 400 | Health |
Nitrates, NO3 | Mg/ L | 45 | Acceptable | 50 | Health |
pH | 6.5-8.5 | Acceptable | 6.5-8.0 | Acceptability | |
Sodium, Na | Mg/L | 20 | Acceptable | 200 | Acceptability |
Sulfates, SO4 | Mg/L | 200 | Acceptable | 250 | Acceptability |
TDS | Mg/L | 500 | Acceptable | 600 | Acceptability |
Turbidity | NTU | 1 | Acceptable | 5 | Acceptability |
Zinc, Zn | mg/L | 5 | Acceptable | 3 | Acceptability |
An important step in the growth of water assests is the analysis of water quality. Quality of Water can be described in terms of certain features of the water, typically physical, chemical, and biological (including bacteriological) that are significant for a particular service and that pose a hazard to human health if values beyond acceptable limits.15
The outcomes of water quality analysis in monsoon, pre monsoon and post monsoon months shown in the Table 4, 9, 12, 15, 18, 21 and 24.
The Descriptive Statistics of Water Quality Parameters of Gurupur River and Netravati River are Shown in Table 5, 10, 13, 16, 19, 22 & 25.
Temporal Distribution of water quality of Gurupura River and Netravati River by Weighted Arithematic Index Method are shown in Table 8, 11, 14, 17, 20, 23, and 26.
Graphical Variation of Reults of water quality anaysis of different sampling locations of Gurupura and Netravati River are shown in Figure 5 to 11.
Overall water quality analyis by Weighed Arithmetic Method of both Gurupura River and Netravati River, Before, during, and after the monsoon are shown in Table 27. Whereas Table 6 indicates the limitations of Weighted Arithmetic Index Method (WAI) Developed by Brown and co-workers in 1972.16
Table 4: Water quality analysis results for Surface water- Gurpur River (Kulur Bridge) (SW-01)
Parameter | Unit | WHO | BIS | Nov-2018 | Dec-2018 | Jan- | Feb-2019 | Mar-2019 | Apr-2019 | May-2019 | Jun-2019 | Jul-2019 | Aug-2019 | Sep-2019 | Oct-2019 |
Cadmium | mg/L | 0.003 | 3 | 0.01 | 0.01 | 0.12 | 0.02 | 0.13 | 0.69 | 2.10 | 1.26 | 0.10 | 0.42 | 0.60 | 0.41 |
Chlorides | mg/L | 250 | 250 | 28 | 29 | 26 | 25 | 24 | 25 | 185 | 196 | 189 | 10 | 23 | 12 |
Copper | mg/L | 2 | 0.05 | 4.26 | 6.10 | 3.12 | 1.20 | 3.24 | 4.26 | 2.26 | 1.68 | 1.20 | 2.20 | 1.65 | 1.18 |
Electrical Conductivity (EC) | uS/cm | 400 | 300 | 200 | 540 | 220 | 800 | 320 | 580 | 300 | 320 | 280 | 350 | 590 | 540 |
DO | mg/L | 6 | 6 | 7.4 | 7.5 | 6.2 | 7.4 | 8.5 | 6.4 | 7.6 | 7.6 | 6.7 | 6.3 | 6.1 | 6.1 |
Fluorides(F) | mg/L | 1.50 | 1 | 0.06 | 0.10 | 0.14 | 0.10 | 0.60 | 0.06 | 0.16 | 0.03 | 0.06 | 0.04 | 0.08 | 0.06 |
Hardness | mg/L | 200 | 200 | 21 | 23 | 20 | 24 | 24 | 25 | 58 | 72 | 10 | 10 | 12 | 10 |
Iron(Fe) | mg/L | 0.30 | 0.30 | 0.120 | 0.100 | 0.060 | 0.020 | 0.04 | 0.05 | 0.11 | 0.67 | 1.25 | 1.21 | 0.14 | 0.19 |
Lead | ug/L | 10 | 10 | 1.20 | 1.86 | 2.21 | 1.46 | 2.0 | 1.46 | 1.23 | 1.90 | 2.60 | 1.68 | 2.16 | 2.01 |
Manganese | ug/L | 400 | 100 | 0.01 | 0.02 | 0.02 | 0.06 | 1.08 | 0.08 | 1.28 | 0.13 | 0.01 | 0.06 | 2.18 | 1.83 |
Nitrates | mg/L | 50 | 45 | 3.53 | 3.10 | 2.65 | 1.52 | 3.10 | 3.26 | 1.21 | 1.92 | 1.12 | 1.62 | 2.39 | 2.16 |
pH | 6.5-8 | 6.5-8.5 | 7.45 | 7.52 | 7.26 | 6.61 | 6.86 | 6.65 | 6.61 | 6.23 | 6.56 | 6.50 | 6.8 | 6.48 | |
Sodium | mg/L | 200 | 20 | 5.2 | 6.1 | 7.0 | 12.2 | 35.6 | 98 | 12.2 | 10.8 | 5.8 | 6.9 | 5.9 | 8.8 |
Sulfates | mg/L | 250 | 200 | 6.98 | 6.2 | 5.86 | 3.98 | 7.95 | 9.98 | 6.86 | 2.98 | 5.86 | 3.68 | 2.85 | 0.09 |
TDS | mg/L | 600 | 500 | 50 | 60 | 60 | 65 | 377 | 298 | 698 | 296 | 58 | 47 | 17 | 12 |
Turbidity | NTU | 5 | 1 | 4.9 | 3.9 | 4.8 | 3.5 | 4.8 | 4.6 | 5.2 | 26.8 | 30.1 | 19.8 | 8.9 | 6.8 |
Zinc | mg/L | 3 | 5 | 4.65 | 4.21 | 6.89 | 5.98 | 6.86 | 2.98 | 4.86 | 6.82 | 7.93 | 4.09 | 5.96 | 6.98 |
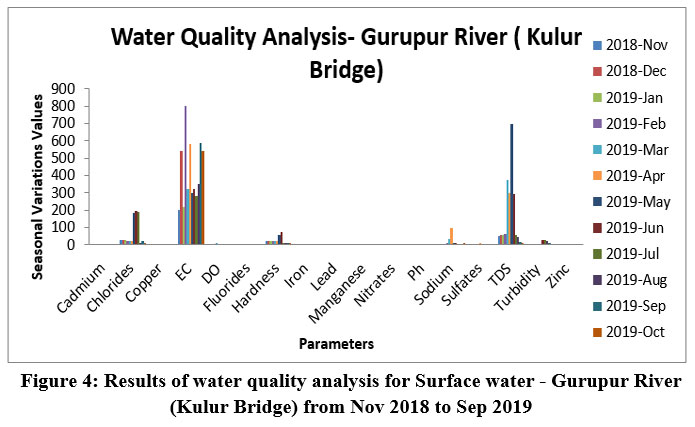 | Figure 4: Results of water quality analysis for Surface water - Gurupur River (Kulur Bridge) from Nov 2018 to Sep 2019
|
Table 5: Water Quality Parameter Descriptive Statistics for the Gurupur River (Kulur Bridge)
Number | Parameter | Unit | Mean | WHO | BIS | Median | Standard Deviation | Min | Max |
1 | Cadmium (Cd) | ug / L | 0.49 | 3 | 3 | 1.395 | 0.40 | 0.01 | 2.10 |
2 | Chlorides (Cl-) | Mg / L | 64.33 | 250 | 250 | 105 | 5781.52 | 10 | 196 |
3 | Copper(Cu) | Mg /L | 2.70 | 2.0 | 0.05 | 3.26 | 2.39 | 1.18 | 6.10 |
4 | EC | uS /cm | 420 | 400 | 300 | 440 | 34.09 | 200 | 800 |
5 | DO | Mg /L | 6.98 | 6.5-8 | 6 | 7 | 0.61 | 6.1 | 8.5 |
6 | Fluorides (F-) | Mg/L | 0.120 | 1.50 | 1.00 | 0.110 | 0.020 | 0.03 | 0.60 |
7 | Hardness | Mg/L | 25.75 | 200 | 200 | 41.5 | 380.20 | 10 | 72 |
8 | Iron( Fe) | Mg/L | 0.33 | 0.3 | 0.3 | 0.08 | 0.21 | 0.02 | 1.25 |
9 | Lead (Pb) | ug /L | 1.81 | 10 | 10 | 1.345 | 0.18 | 1.20 | 2.60 |
10 | Manganese,Mn | ug /L | 0.56 | 400 | 100 | 0.68 | 0.65 | 0.01 | 2.18 |
11 | Nitrates, NO3 | Mg/L | 2.30 | 50 | 45 | 2.235 | 0.70 | 1.12 | 3.53 |
12 | pH | 6.79 | 6.5-8.0 | 6.5-8.5 | 6.63 | 0.17 | 6.23 | 7.45 | |
13 | Sodium,Na | Mg/L | 17.88 | 200 | 20 | 55.1 | 705.29 | 5.2 | 98 |
14 | Sulfates, SO4 | Mg/L | 5.27 | 250 | 200 | 8.42 | 7.14 | 0.09 | 9.98 |
15 | TDS | Mg/L | 169.83 | 600 | 500 | 498 | 43.60 | 12 | 6.98 |
16 | Turbidity | NTU | 10.34 | 5 | 1 | 4.9 | 91.28 | 3.5 | 30.1 |
17 | Zinc,Zn | ug /L | 5.68 | 3 | 5 | 3.92 | 2.25 | 2.98 | 7.93 |
Tidal variations in the Arabian Sea have an influence on the Gurpur River's water quality at the time of sample station SW-01 (Kulur bridge) (Fig. 3). During the study period, the results of parameters like turbidity, iron, and EC exceeded the WHO and BIS guideline limits.
Table 6: Weighted Arithmetic Index Method
Index of Quality | Quality Conditions |
0 to 25 | Excellent |
26 to 50 | Good |
51 to 75 | Poor |
76 to 100 | Very Poor |
> 100 | Unfit For Use. |
Calculation of Weighted Arithmetic Water Quality Index, (WAWQI) (Source- Brown et al. (1970).
Formula for the Overall Water Quality Index is
![]()
is employed to assess a water body's general quality using a variety of criteria.
The Weighted Arithmetic Water Quality Index (WAWQI) technique is the most commonly used approach.
There are three primary steps in the calculation:
Give every water quality metric a relative weight (Wn).
Based on each parameter's concentration in the sample, assign a quality rating (Qn) to it.
To obtain the overall WQI, add these values together.
First, give it a relative weight (Wn).
For the parameter used to calculate the unit weight (Wn), the value is inversely proportional to the recommended Standard value (Sn).
Wn = K/Sn where K is a proportionality constant.
According to drinking water regulations from an appropriate organization, such as the BIS or the WHO, Sn is the standard allowable value for the nth parameter.
K is computed as follows: K=1/E(1/Sn)
The value of guarantees that all weights added together equal one.
In step two,
find the quality rating (Qn = 100 × (Vn - Videal) / (Sn - Videal), where Vn is the water sample's estimated concentration of the nth parameter. Videal is the parameter's optimal value for pure water.
This is zero for the majority of parameters.
There are notable exceptions.
PH: 7.0 is the optimal value.
The optimal level of dissolved oxygen (DO) is 14.60 mg/l.
The standard acceptable value for the nth parameter is Sn.
Determine the Total WQI
A weighted sum of the quality ratings for each parameter divided by the total of their relative weights yields the final WQI value.
![]()
The formula becomes WQI = EWnQn as the sum of the weights (EWn) usually equals 1.
Water quality is then classified into a variety of categories (such as Excellent, Good, Satisfactory, Extremely poor, or Unsuitable) based on the final WQI score; however, the precise range definitions may differ depending on the index. Below, Nov 2018 Sample calculation are shown for reference.
Table 7: Results of Weighted Arithmetic Water Quality Index for November 2018 Samples
Parameter | WHO | 1/Sn | E 1/Sn | k=1/(sum1/Sn) | Wn=K/Sn | Sn | Vn/Sn | Qn | WnQn |
Cadmium | 3 | 0.333 | 25.801 | 0.038759 | 0.01292 | 0.01 | 0.003 | 0.33 | 0.00 |
Chlorides | 250 | 0.004 | 25.801 | 0.038759 | 0.000155 | 20 | 0.08 | 8 | 0.00 |
Copper | 2 | 0.500 | 25.801 | 0.038759 | 0.019379 | 4.26 | 2.13 | 213 | 4.13 |
EC | 400 | 0.003 | 25.801 | 0.038759 | 0.025839 | 290 | 0.72 | 72.5 | 0.01 |
DO | 6 | 0.167 | 25.801 | 0.038759 | 0.00646 | 7.1 | 1.18 | 118.3 | 0.76 |
Fluorides | 1.5 | 0.667 | 25.801 | 0.038759 | 0.025839 | 0.06 | 0.04 | 4 | 0.10 |
Hardness | 200 | 0.005 | 25.801 | 0.038759 | 0.000194 | 21 | 0.105 | 10.5 | 0.00 |
Iron | 0.3 | 3.333 | 25.801 | 0.038759 | 0.129196 | 0.12 | 0.4 | 40 | 5.17 |
Lead | 10 | 0.100 | 25.801 | 0.038759 | 0.003876 | 1.2 | 0.12 | 12 | 0.05 |
Manganese | 0.05 | 20.000 | 25.801 | 0.038759 | 0.775179 | 0.01 | 0.2 | 11 | 8.53 |
Nitrates | 50 | 0.020 | 25.801 | 0.038759 | 0.000775 | 3.53 | 0.07 | 7.06 | 0.01 |
pH | 8 | 0.125 | 25.801 | 0.038759 | 0.004845 | 7.45 | 0.93 | 93.12 | 0.45 |
Sodium | 200 | 0.005 | 25.801 | 0.038759 | 0.000194 | 5.2 | 0.026 | 2.6 | 0.00 |
Sulfates | 250 | 0.004 | 25.801 | 0.038759 | 0.000155 | 6.98 | 0.02 | 2.79 | 0.00 |
TDS | 600 | 0.002 | 25.801 | 0.038759 | 0.025839 | 50 | 0.08 | 8.3 | 0.00 |
Turbidity | 5 | 0.200 | 25.801 | 0.038759 | 0.007752 | 4.9 | 0.98 | 98 | 0.76 |
Zinc | 3 | 0.333 | 25.801 | 0.038759 | 0.01292 | 4.65 | 1.55 | 155 | 2.00 |
25.801 | 1 | 28.97 | |||||||
Table 8: Temporal Distribution of Water Quality of Gurupur River (Kulur Bridge) by Weighted Arithmetic Index Method
Month, year | Nov-2018 | Dec-2 | Jan- | Feb- | Mar- | Apr- | May- | Jun- | Jul- | Aug- | Sep- | Oct- |
WQI | 28.97 | 45.17 | 41.81 | 99.62 | 87.83 | 109.09 | 112.30 | 102.26 | 72.99 | 68.99 | 43.38 | 45.04 |
Status | Good | Good | Good | Extremely | Extremely | Unfit | Unfit | Unfit | Poor | Poor | Good | Good |
The above results (Table 8.0) shows that, the Water Quality of Gurupur river (Kulur Bridge) Vary from good to Unfit for the usage, based on the above results Gurupur River Water at Kulur Bridge can be used during monsoon and post monsoon.
Table 9: Results of Water Quality Analysis for Surface water- Gurpur River (Maravoor Bridge) (SW-02)
Parameter | Unit | WHO | BIS | Nov-2018 | Dec-2018 | Jan- | Feb-2019 | Mar-2019 | Apr-2019 | May-2019 | Jun-2019 | Jul- | Aug-2019 | Sep-2019 | Oct-2019 |
Cadmium | ug/L | 0.003 | 3 | 0.01 | 0.01 | 0.11 | 0.01 | 1.10 | 1.67 | 2.10 | 1.24 | 0.10 | 0.42 | 0.60 | 0.41 |
Chlorides | mg/L | 250 | 250 | 20 | 23 | 20 | 21 | 24 | 25 | 154 | 194 | 180 | 12 | 10 | 12 |
Copper | ug/L | 2 | 0.05 | 4.26 | 6.10 | 3.12 | 1.20 | 3.24 | 4.26 | 2.26 | 1.68 | 1.20 | 2.20 | 1.65 | 1.18 |
EC | uS/cm | 400 | 300 | 290 | 310 | 300 | 190 | 210 | 200 | 510 | 520 | 280 | 600 | 300 | 200 |
DO | mg/L | 6 | 6 | 7.1 | 7.3 | 7.4 | 6.1 | 6.2 | 7.3 | 7.4 | 8.2 | 6.9 | 7.6 | 7.9 | 7.8 |
Fluorides(F) | mg/L | 1.5 | 1.0 | 0.06 | 0.10 | 0.14 | 0.10 | 0.60 | 0.06 | 0.16 | 0.03 | 0.06 | 0.04 | 0.08 | 0.06 |
Hardness | mg/L | 200 | 200 | 21 | 23 | 20 | 24 | 24 | 25 | 58 | 72 | 10 | 10 | 12 | 10 |
Iron(Fe) | mg/L | 0.3 | 0.30 | 0.120 | 0.100 | 0.060 | 0.02 | 0.04 | 0.05 | 0.11 | 0.67 | 1.25 | 1.21 | 0.14 | 0.19 |
Lead | ug/L | 10 | 10 | 1.20 | 1.86 | 2.21 | 1.46 | 2.0 | 1.46 | 1.23 | 1.90 | 2.60 | 1.68 | 2.16 | 2.01 |
Manganese | ug/L | 400 | 100 | 0.01 | 0.02 | 0.02 | 0.06 | 1.08 | 0.08 | 1.28 | 0.13 | 0.01 | 0.06 | 2.18 | 1.83 |
Nitrates | mg/L | 50 | 45 | 3.53 | 3.10 | 2.65 | 1.52 | 3.10 | 3.26 | 1.21 | 1.92 | 1.12 | 1.62 | 2.39 | 2.16 |
pH | 6.5-8 | 6.5-8.5 | 7.45 | 7.52 | 7.26 | 6.61 | 6.86 | 6.65 | 6.61 | 6.23 | 6.56 | 6.50 | 6.8 | 6.48 | |
Sodium | mg/L | 200 | 20 | 5.2 | 6.1 | 7.0 | 12.2 | 35.6 | 98 | 12.2 | 10.8 | 5.8 | 6.9 | 5.9 | 8.8 |
Sulfates | mg/L | 250 | 200 | 6.98 | 6.2 | 5.86 | 3.98 | 7.95 | 9.98 | 6.86 | 2.98 | 5.86 | 3.68 | 2.85 | 0.09 |
TDS | mg/L | 600 | 500 | 50 | 60 | 60 | 65 | 377 | 298 | 698 | 296 | 58 | 47 | 17 | 12 |
Turbidity | NTU | 5 | 1 | 4.9 | 3.9 | 4.8 | 3.5 | 4.8 | 4.6 | 5.2 | 26.8 | 30.1 | 19.8 | 8.9 | 6.8 |
Zinc | ug/L | 3 | 5 | 4.65 | 4.21 | 6.89 | 5.98 | 6.86 | 2.98 | 4.86 | 6.82 | 7.93 | 4.09 | 5.96 | 6.98 |
The electrical Conductivity EC and TDS values are not within the BIS guidelines and these two parameters are varied in the post- monsoon and pre- monsoon shown in the Table 9.
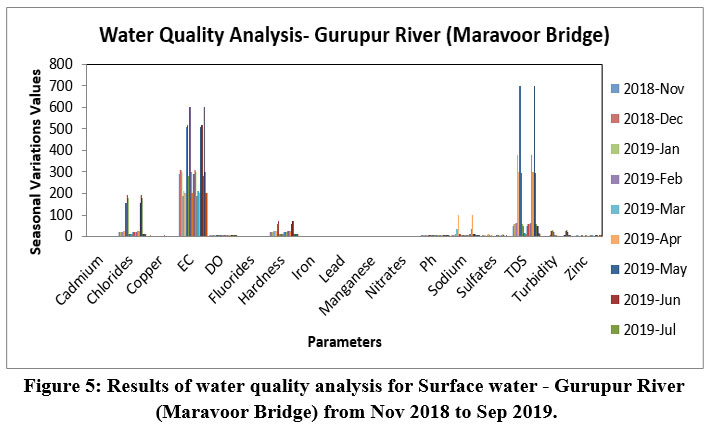 | Figure 5: Results of water quality analysis for Surface water - Gurupur River (Maravoor Bridge) from Nov 2018 to Sep 2019.
|
Table 10: Descriptive Statistics of Water Quality Parameters for Gurupur River (Maravoor Bridge).
Number | Parameter | Unit | Mean | WHO | BIS | Median | Standard Deviation | Min | Max |
1 | Cadmium (Cd) | ug /L | 0.65 | 3 | 3 | 1.885 | 0.51 | 0.01 | 2.10 |
2 | Chlorides (Cl-) | mg/L | 57.92 | 250 | 250 | 89.5 | 5168.99 | 10 | 194 |
3 | Copper(Cu) | ug /L | 2.70 | 2.0 | 0.05 | 3.26 | 2.39 | 1.18 | 6.10 |
4 | EC | uS /cm | 325.83 | 400 | 300 | 355 | 19.57 | 190 | 600 |
5 | DO | mg /L | 7.27 | 6.5-8 | 6 | 7.35 | 0.40 | 6.1 | 8.2 |
6 | Fluorides (F-) | mg/L | 0.120 | 1.50 | 1.00 | 0.110 | 0.020 | 0.60 | 0.03 |
7 | Hardness | mg/L | 25.75 | 200 | 200 | 41.5 | 380.20 | 10 | 72 |
8 | Iron( Fe) | mg/L | 0.33 | 0.3 | 0.3 | 0.08 | 0.21 | 0.02 | 1.25 |
9 | Lead(Pb) | ug /L | 1.81 | 10 | 10 | 1.345 | 0.18 | 1.20 | 2.60 |
10 | Manganese,Mn | ug /L | 0.56 | 400 | 100 | 0.68 | 0.65 | 0.01 | 2.18 |
11 | Nitrates, NO3 | mg/L | 2.30 | 50 | 45 | 2.235 | 0.70 | 1.12 | 3.53 |
12 | pH | 6.79 | 6.5-8.0 | 6.5-8.5 | 6.63 | 0.17 | 6.23 | 7.45 | |
13 | Sodium,Na | mg/L | 17.88 | 200 | 20 | 55.1 | 705.29 | 5.2 | 98 |
14 | Sulfates, SO4 | mg/L | 5.27 | 250 | 200 | 8.42 | 7.14 | 0.09 | 9.98 |
15 | TDS | mg/L | 169.83 | 600 | 500 | 498 | 43.60 | 12 | 698 |
16 | Turbidity | NTU | 10.34 | 5 | 1 | 4.9 | 91.28 | 3.5 | 30.1 |
As per the Descriptive Statistics of Water Quality Parameters shown in the table 10, The Gurpur River's water quality at the sampling site SW-02 (Maravoor Bridge) (Fig. 5.0) meets the desirable limits of WHO and BIS guideline values during the study period. Only minor changes observed in Turbidity, DO, EC and Copper.
Table 11: Temporal Distribution of Water Quality of Gurupur River (Maravoor Bridge) by Weighted Arithmetic Index Method
Month & year | Nov- | Dec- | Jan- | Feb- | Mar- | Apr- | May- | Jun-2019 | Jul- | Aug-2019 | Sep- | Oct- |
WQI | 21.91 | 22.66 | 19.47 | 14.97 | 19.77 | 18.89 | 20.81 | 48.05 | 47.19 | 41.21 | 21.85 | 23.51 |
Status | Excellent | Excellent | Excellent | Excellent | Excellent | Excellent | Excellent | Good | Good | Good | Excellent | Excellent |
The outcomes displayed in Table 11. Demonstrates that the Gurupur River's (Maravoor Bridge) water quality varies from excellent to good in throughout the year.
Table 12: Results of Water Quality Analysis for Surface water- Gurpur River (Gurpura Bridge ) (SW-03)
Parameter | Unit | WHO | BIS | Nov-2018 | Dec-2018 | Jan-2019 | Feb-2019 | Mar-2019 | Apr-2019 | May-2019 | Jun-2019 | Jul-2019 | Aug-2019 | Sep-2019 | Oct-2019 |
Cadmium | ug/L | 0.003 | 3 | 0.01 | 0.01 | 0.11 | 0.01 | 1.10 | 1.65 | 2.10 | 1.26 | 0.11 | 0.48 | 0.60 | 0.41 |
Chlorides | mg/L | 250 | 250 | 20 | 23 | 20 | 21 | 25 | 25 | 154 | 194 | 180 | 12 | 10 | 10 |
Copper | ug/L | 2 | 0.05 | 4.26 | 6.10 | 3.12 | 1.20 | 3.24 | 4.26 | 2.26 | 1.68 | 1.20 | 2.20 | 1.65 | 1.18 |
EC | uS/cm | 400 | 300 | 290 | 280 | 330 | 350 | 300 | 460 | 490 | 530 | 280 | 260 | 250 | 250 |
DO | mg/L | 6 | 6 | 6.9 | 6.8 | 7.3 | 7.8 | 7.6 | 6.9 | 5.9 | 6.3 | 6.1 | 6.1 | 6.3 | 6.2 |
Fluorides(F) | mg/L | 1.5 | 1.0 | 0.06 | 0.12 | 0.14 | 0.10 | 0.62 | 0.06 | 0.16 | 0.03 | 0.06 | 0.04 | 0.08 | 0.06 |
Hardness | mg/L | 200 | 200 | 21 | 23 | 20 | 24 | 24 | 25 | 58 | 72 | 10 | 10 | 12 | 10 |
Iron(Fe) | mg/l | 0.3 | 0.30 | 0.120 | 0.100 | 0.06 | 0.02 | 0.04 | 0.05 | 0.11 | 0.67 | 1.25 | 1.21 | 0.14 | 0.19 |
Lead | ug/L | 10 | 10 | 1.20 | 1.86 | 2.21 | 1.46 | 2.0 | 1.46 | 1.23 | 1.90 | 2.60 | 1.68 | 2.16 | 2.01 |
Manganese | ug/L | 400 | 100 | 0.01 | 0.02 | 0.02 | 0.06 | 1.08 | 0.08 | 1.28 | 0.13 | 0.01 | 0.06 | 2.18 | 1.83 |
Nitrates | mg/L | 50 | 45 | 3.53 | 3.10 | 2.65 | 1.52 | 3.10 | 3.26 | 1.21 | 1.92 | 1.12 | 1.62 | 2.39 | 2.16 |
pH | 6.5-8 | 6.5-8.5 | 7.55 | 7.58 | 7.26 | 6.60 | 6.86 | 6.65 | 6.61 | 6.25 | 6.56 | 6.50 | 6.8 | 6.48 | |
Sodium | mg/L | 200 | 20 | 5.2 | 6.1 | 7.0 | 12.2 | 35.6 | 98 | 12.2 | 10.8 | 5.8 | 6.9 | 5.9 | 8.8 |
Sulfates | mg/L | 250 | 200 | 6.98 | 6.2 | 5.86 | 3.98 | 7.95 | 9.98 | 6.86 | 2.98 | 5.86 | 3.68 | 2.85 | 0.09 |
TDS | mg/L | 600 | 500 | 50 | 60 | 60 | 65 | 377 | 298 | 698 | 296 | 58 | 47 | 17 | 12 |
Turbidity | NTU | 5 | 1 | 4.9 | 3.9 | 4.8 | 3.5 | 4.8 | 4.6 | 5.2 | 26.8 | 30.1 | 19.8 | 8.9 | 6.8 |
Zinc | ug/L | 3 | 5 | 4.65 | 4.21 | 6.89 | 5.98 | 6.86 | 2.98 | 4.86 | 6.82 | 7.93 | 4.09 | 5.96 | 6.98 |
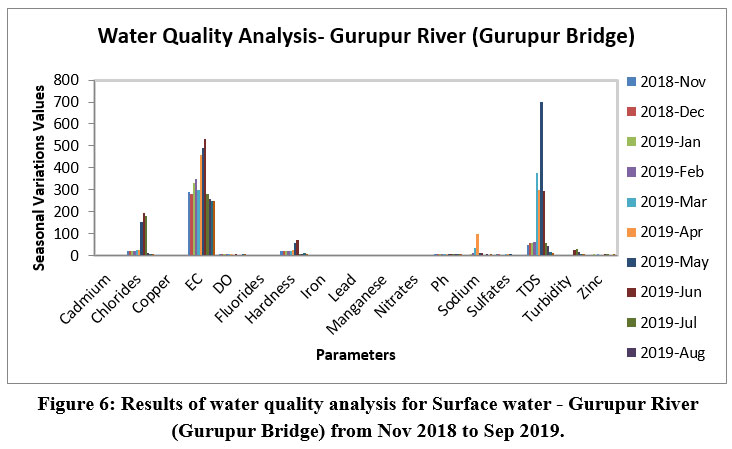 | Figure 6: Results of water quality analysis for Surface water - Gurupur River (Gurupur Bridge) from Nov 2018 to Sep 2019.
|
Table 13: Descriptive Statistics of Water Quality Parameters for Gurupur River (Gurupur Bridge)
Number | Parameter | Unit | Mean | WHO | BIS | Median | Standard Deviation | Min | Max |
1 | Cadmium (Cd) | ug /L | 0.65 | 3 | 3 | 1.88 | 0.51 | 0.01 | 2.10 |
2 | Chlorides (Cl-) | mg/L | 57.83 | 250 | 250 | 89.50 | 5179.97 | 10 | 194 |
3 | Copper(Cu) | ug /L | 2.70 | 2.0 | 0.05 | 3.26 | 2.39 | 1.18 | 6.10 |
4 | EC | uS/cm | 339.17 | 400 | 300 | 475.00 | 9.74 | 250 | 490 |
5 | DO | mg /L | 6.68 | 6.5-8 | 6 | 6.40 | 0.40 | 5.9 | 7.8 |
6 | Fluorides (F-) | mg/L | 0.13 | 1.5 | 1.0 | 0.11 | 0.03 | 0.03 | 0.62 |
7 | Hardness | mg/L | 25.75 | 200 | 200 | 41.50 | 380.20 | 10 | 72 |
8 | Iron( Fe) | mg/L | 0.33 | 0.3 | 0.3 | 0.08 | 0.21 | 0.02 | 1.25 |
9 | Lead(Pb) | ug /L | 1.81 | 10 | 10 | 1.35 | 0.18 | 1.20 | 2.60 |
10 | Manganese,Mn | ug /L | 0.56 | 400 | 100 | 0.68 | 0.65 | 0.01 | 2.18 |
11 | Nitrates, NO3 | mg/L | 2.30 | 50 | 45 | 2.24 | 0.70 | 1.12 | 3.53 |
12 | pH | 6.81 | 6.5-8.0 | 6.5-8.5 | 6.63 | 0.19 | 6.25 | 7.55 | |
13 | Sodium,Na | mg/L | 17.88 | 200 | 20 | 55.10 | 705.29 | 5.2 | 98 |
14 | Sulfates, SO4 | mg/L | 5.27 | 250 | 200 | 8.42 | 7.14 | 0.09 | 9.98 |
15 | TDS | mg/L | 169.83 | 600 | 500 | 498.00 | 43.60 | 12 | 698 |
16 | Turbidity | NTU | 10.34 | 5 | 1 | 4.90 | 91.28 | 3.5 | 30.1 |
17 | Zinc,Zn | ug /L | 5.68 | 3 | 5 | 3.92 | 2.25 | 2.98 | 7.93 |
The pH of the water can reveal whether heavy metals are present as well as the bioavailability and solubility of nutrients.16,17 In the current analysis, the pH of the water samples in Gurupur River (Gurupur Bridge) showed basic pH (Fig 6.0) and neutralin pH (7.1to7.9). Few parameters like EC, DO, TDS and Turbidity values exceed the WHO and BIS acceptable limits because of solubility of nutrients.
Table 14: Temporal Distribution of Water Quality of Gurupur River (Gurupur Bridge) by Weighted Arithmetic Index Method
Month & year | Nov-2018 | Dec-2018 | Jan-2019 | Feb- | Mar- | Apr- | May- | Jun-2019 | Jul- | Aug- | Sep- | Oct- |
WQI | 28.93 | 45.13 | 41.94 | 99.65 | 91.01 | 95.32 | 91.81 | 108.3 | 49.72 | 44.98 | 46.95 | 43.1 |
Status | Good | Good | Good | Extremely | Extremely | Extremely | Extremely | Unfit | Good | Good | Good | Good |
The above results (Table 14.) show that, the Water Quality of Gurupur river water sample collected in the location of Gurupur bridge is Vary from Very poor to Good.
Table 15: Results of Water Quality Analysis for Surface water- Gurpur River (Addur Bridge) (SW-04).
Parameter | Unit | WHO | BIS | Nov-2018 | Dec-2018 | Jan-2019 | Feb-2019 | Mar-2019 | Apr-2019 | May-2019 | Jun-2019 | Jul-2019 | Aug-2019 | Sep-2019 | Oct-2019 |
Cadmium | ug/L | 0.003 | 3 | 0.01 | 0.01 | 0.11 | 0.01 | 1.10 | 1.63 | 2.11 | 1.20 | 0.10 | 0.32 | 0.60 | 0.41 |
Chlorides | mg/L | 250 | 250 | 22 | 21 | 23 | 21 | 24 | 24 | 150 | 184 | 180 | 12 | 10 | 12 |
Copper | ug/L | 2 | 0.05 | 4.26 | 6.20 | 3.10 | 1.28 | 3.26 | 4.36 | 2.16 | 1.66 | 1.20 | 2.21 | 1.65 | 1.19 |
EC | uS/cm | 400 | 300 | 310 | 320 | 300 | 280 | 290 | 300 | 450 | 490 | 360 | 280 | 240 | 270 |
DO | mg/L | 6 | 6 | 7.3 | 7.1 | 7.5 | 7.1 | 6.9 | 6.8 | 7.0 | 7.1 | 6.9 | 7.4 | 7.2 | 7.1 |
Fluorides(F) | mg/L | 1.5 | 1.0 | 0.06 | 0.10 | 0.14 | 0.10 | 0.60 | 0.06 | 0.16 | 0.03 | 0.06 | 0.04 | 0.08 | 0.06 |
Hardness | mg/L | 200 | 200 | 21 | 23 | 20 | 24 | 24 | 25 | 58 | 72 | 10 | 10 | 12 | 10 |
Iron(Fe) | mg/L | 0.3 | 0.30 | 0.120 | 0.100 | 0.060 | 0.020 | 0.04 | 0.05 | 0.11 | 0.67 | 1.25 | 1.21 | 0.14 | 0.19 |
Lead | ug/L | 10 | 10 | 1.20 | 1.86 | 2.21 | 1.46 | 2.0 | 1.46 | 1.23 | 1.90 | 2.60 | 1.68 | 2.16 | 2.01 |
Manganese | ug/L | 400 | 100 | 0.01 | 0.02 | 0.02 | 0.06 | 1.08 | 0.08 | 1.28 | 0.13 | 0.01 | 0.06 | 2.18 | 1.83 |
Nitrates | mg/L | 50 | 45 | 3.53 | 3.10 | 2.65 | 1.52 | 3.10 | 3.26 | 1.21 | 1.92 | 1.12 | 1.62 | 2.39 | 2.16 |
pH | 6.5-8 | 6.5-8.5 | 7.66 | 7.52 | 7.26 | 6.60 | 6.86 | 6.63 | 6.63 | 6.33 | 6.66 | 6.60 | 6.8 | 6.48 | |
Sodium | mg/L | 200 | 20 | 5.2 | 6.1 | 7.0 | 12.2 | 35.6 | 98 | 12.2 | 10.8 | 5.8 | 6.9 | 5.9 | 8.8 |
Sulfates | mg/L | 250 | 200 | 6.98 | 6.2 | 5.86 | 3.98 | 7.95 | 9.98 | 6.86 | 2.98 | 5.86 | 3.68 | 2.85 | 0.09 |
TDS | mg/L | 600 | 500 | 60 | 66 | 65 | 68 | 379 | 292 | 696 | 290 | 58 | 47 | 17 | 12 |
Turbidity | NTU | 5 | 1 | 4.7 | 3.8 | 4.9 | 3.8 | 4.8 | 4.6 | 5.6 | 26.9 | 30.3 | 19.3 | 8.6 | 6.5 |
Zinc | ug/L | 3 | 5 | 4.60 | 4.21 | 6.87 | 5.96 | 6.66 | 2.88 | 4.86 | 6.62 | 7.95 | 4.09 | 5.96 | 6.98 |
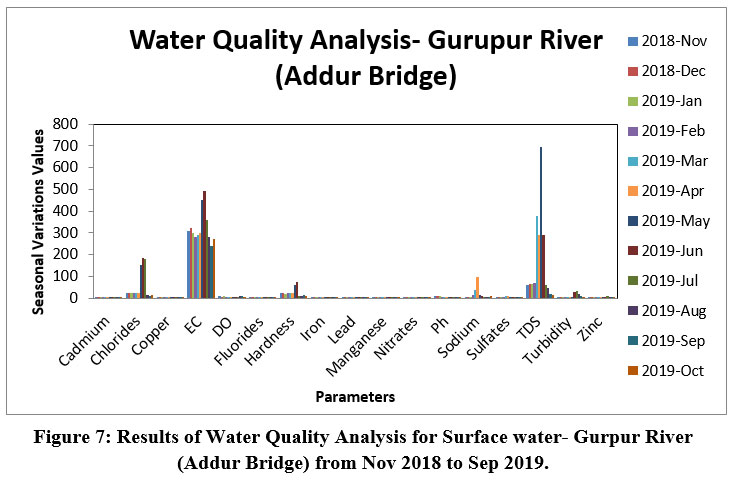 | Figure 7: Results of Water Quality Analysis for Surface water- Gurpur River (Addur Bridge) from Nov 2018 to Sep 2019.
|
In the current analysis few parameters like EC, TDS and Chlorides values exceed the WHO and BIS acceptable limits as shown in Figure 7. This may be due Arabian Sea located nearer to the study area. Hence there may be chances of salt water intrusion that makes surface fresh water contamination and make it unfit for the use.18,19
Table 16: Descriptive Statistics of Water Quality Parameters for Gurpur River (Addur Bridge).
Number | Parameter | Unit | Mean | Median | Standard Deviation | Minimum | Maximum |
1 | Cadmium (Cd) | ug /L | 0.63 | 1.87 | 0.51 | 0.01 | 2.11 |
2 | Chlorides (Cl-) | mg/L | 56.92 | 87.00 | 50.29 | 10 | 184 |
3 | Copper(Cu) | ug /L | 2.71 | 3.26 | 2.47 | 1.19 | 6.20 |
4 | EC | uS /cm | 324.17 | 375.00 | 55.54 | 490 | 240 |
5 | DO | mg /L | 7.12 | 6.90 | 0.04 | 7.4 | 6.8 |
6 | Fluorides (F-) | mg/L | 0.120 | 0.110 | 0.020 | 0.030 | 0.600 |
7 | Hardness | mg/L | 25.75 | 41.50 | 380.20 | 10 | 72 |
8 | Iron( fe) | mg/l | 0.330 | 0.080 | 0.210 | 0.02 | 1.25 |
9 | Lead(Pb) | ug /L | 1.81 | 1.35 | 0.18 | 1.20 | 2.60 |
10 | Manganese,Mn | ug /L | 0.56 | 0.68 | 0.65 | 0.01 | 2.18 |
11 | Nitrates, NO3 | mg/L | 2.30 | 2.24 | 0.70 | 1.12 | 3.53 |
12 | pH | 6.84 | 6.63 | 0.18 | 6.33 | 7.66 | |
13 | Sodium,Na | mg/L | 17.88 | 55.10 | 705.29 | 5.2 | 98 |
14 | Sulfates, SO4 | mg/L | 5.27 | 8.42 | 7.14 | 0.09 | 9.98 |
15 | TDS | mg/L | 170.83 | 494.00 | 42.73 | 12 | 696 |
16 | Turbidity | NTU | 10.32 | 5.10 | 91.25 | 3.8 | 30.3 |
17 | Zinc,Zn | ug /L | 5.64 | 3.87 | 2.24 | 2.88 | 7.95 |
Table 17: Temporal Distribution of Water Quality of Gurpur River (Addur Bridge) By Weighted Arithmetic Index Method
Month & Year | Nov- | Dec- | Jan- | Feb- | Mar- | Apr- | May-2019 | Jun- | Jul- | Aug- | Sep- | Oct- |
WQI | 28.93 | 45.20 | 41.95 | 99.69 | 81.03 | 79.34 | 65.70 | 90.98 | 80.03 | 66.20 | 47.0 | 57.9 |
Status | Good | Good | Good | Extremely | Extremely | Extremely | Poor | Extremely | Extremely | Poor | Good | Poor |
Table 18: Results of water quality analysis for Surface water - Nethravati River (Netravati River Bridge) (SW-05)
Parameter | Unit | WHO | BIS | Nov- | Dec- | Jan- | Feb- | Mar- | Apr- | May- | Jun- | Jul- | Aug- | Sep- | Oct- |
Cadmium | ug/L | 0.003 | 3 | 2.37 | 2.25 | 2.21 | 2.87 | 2.75 | 2.57 | 2.85 | 2.12 | 1.26 | 1.29 | 2.48 | 2.10 |
Chlorides | mg/L | 250 | 250 | 9 | 9 | 10 | 10 | 8 | 9 | 14 | 10 | 12 | 10 | 12 | 9 |
Copper | ug/L | 2 | 0.05 | 5.49 | 7.32 | 6.26 | 4.32 | 6.57 | 8.95 | 4.35 | 3.51 | 2.65 | 3.12 | 4.36 | 5.10 |
EC | uS/cm | 400 | 300 | 340 | 310 | 300 | 420 | 440 | 460 | 510 | 530 | 550 | 590 | 580 | 390 |
DO | mg/L | 6 | 6 | 6.5 | 6.6 | 6.7 | 6.8 | 6.3 | 6.7 | 6.9 | 6.9 | 7.0 | 7.1 | 7.2 | 6.9 |
Fluorides | mg/L | 1.5 | 1.0 | 0.06 | 0.03 | 0.04 | 0.07 | 0.01 | 0.02 | 0.03 | 0.01 | 0.08 | 0.06 | 0.08 | 0.09 |
Hardness | mg/L | 200 | 200 | 21 | 23 | 23 | 22 | 24 | 24 | 25 | 14 | 12 | 10 | 12 | 14 |
Iron(Fe) | mg/L | 0.30 | 0.30 | 0.120 | 0.130 | 0.150 | 0.160 | 0.080 | 0.160 | 0.140 | 1.63 | 2.86 | 0.19 | 0.20 | 0.24 |
Lead | ug/L | 10 | 10 | 5.42 | 4.12 | 6.25 | 3.21 | 7.15 | 8.24 | 6.25 | 5.20 | 4.32 | 3.62 | 4.13 | 4.96 |
Manganese | ug/L | 400 | 100 | 0.05 | 0.06 | 1.10 | 1.12 | 2.13 | 2.20 | 2.26 | 1.02 | 1.06 | 0.06 | 3.25 | 4.06 |
Nitrates | mg/L | 50 | 45 | 1.26 | 2.26 | 1.64 | 2.10 | 1.06 | 2.10 | 0.08 | 1.15 | 2.12 | 3.34 | 3.24 | 5.02 |
Ph | 6.5-8 | 6.5-8.5 | 7.80 | 7.83 | 7.85 | 7.98 | 7.78 | 7.62 | 7.63 | 7.80 | 7.24 | 7.10 | 7.26 | 6.98 | |
Sodium | mg/L | 200 | 20 | 5.8 | 5.6 | 6.0 | 4.6 | 5.10 | 5.30 | 4.8 | 3.2 | 4.0 | 5.10 | 5.40 | 7.90 |
Sulfates | mg/L | 250 | 200 | 2.04 | 2.69 | 2.12 | 1.69 | 1.46 | 1.12 | 4.63 | 1.20 | 12.2 | 2.26 | 2.10 | 0.18 |
TDS | mg/L | 600 | 500 | 23 | 21 | 24 | 26 | 28 | 31 | 25 | 12 | 12 | 16 | 30 | 11 |
Turbidity | NTU | 5 | 1 | 1.4 | 1.0 | 1.10 | 2.20 | 1.62 | 2.98 | 3.0 | 12.6 | 32.7 | 16.9 | 3.9 | 10.0 |
Zinc | ug/L | 3 | 5 | 8.24 | 11.10 | 12.90 | 13.48 | 15.10 | 14.13 | 6.96 | 7.62 | 16.27 | 16.86 | 8.65 | 11.46 |
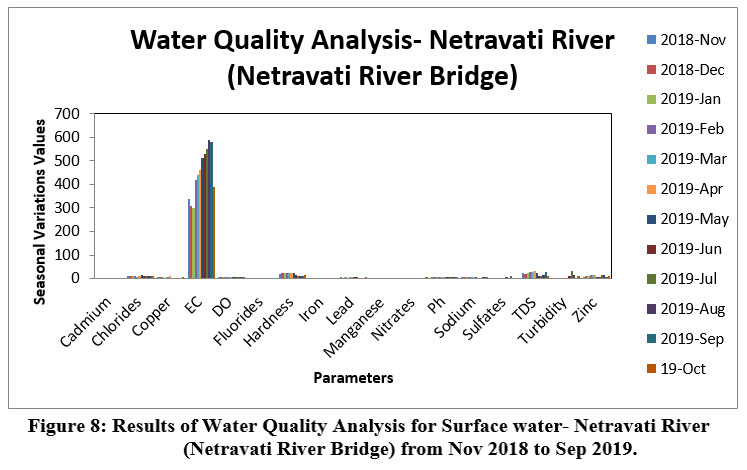 | Figure 8: Results of Water Quality Analysis for Surface water- Netravati River (Netravati River Bridge) from Nov 2018 to Sep 2019.
|
In the current analysis EC values exceed the WHO and BIS acceptable limits as shown in Figure 8. This may be due to increase charged particles (ions) and higher temperature.20,21
Table 19: Descriptive Statistics of Water Quality Parameters for Netravati River (Netravati River Bridge)
Number | Parameter | Unit | Mean | Median | Standard Deviation | Minimum | Maximum |
1 | Cadmium (Cd) | ug /L | 2.26 | 2.71 | 0.28 | 1.26 | 2.87 |
2 | Chlorides (Cl-) | mg/L | 10.17 | 11.50 | 2.88 | 8 | 14 |
3 | Copper(Cu) | ug /L | 5.17 | 6.65 | 3.41 | 2.65 | 8.95 |
4 | EC | uS /cm | 451.67 | 485.00 | 10.49 | 300 | 590 |
5 | DO | mg /L | 6.80 | 6.80 | 0.07 | 6.3 | 7.2 |
6 | Fluorides (F-) | mg/L | 0.05 | 0.03 | 0.00 | 0.01 | 0.09 |
7 | Hardness | mg/L | 18.67 | 24.50 | 32.61 | 10 | 25 |
8 | Iron( Fe) | mg/L | 0.51 | 0.15 | 0.73 | 0.08 | 2.86 |
9 | Lead(Pb) | ug /L | 5.24 | 7.25 | 2.26 | 3.21 | 8.24 |
10 | Manganese,Mn | ug /L | 1.53 | 2.23 | 1.64 | 0.05 | 4.06 |
11 | Nitrates, NO3 | mg/L | 2.11 | 1.09 | 1.67 | 0.08 | 5.02 |
12 | pH | 7.57 | 7.63 | 0.11 | 6.98 | 7.98 | |
13 | Sodium,Na | mg/L | 5.23 | 5.05 | 1.32 | 3.2 | 7.90 |
14 | Sulfates, SO4 | mg/L | 2.81 | 2.88 | 9.89 | 0.18 | 12.2 |
15 | TDS | mg/L | 21.58 | 28.00 | 51.54 | 11 | 31 |
16 | Turbidity | NTU | 7.45 | 2.99 | 90.21 | 1.0 | 32.7 |
17 | Zinc,Zn | ug /L | 11.90 | 10.55 | 11.81 | 6.96 | 16.86 |
Table 20: Temporal Distribution of Water Quality of Netravati River (Netravati River Bridge) By Weighted Arithmetic Index Method
Month & | Nov- | Dec- | Jan- | Feb- | Mar- | Apr- | May- | Jun- | Jul- | Aug- | Sep- | Oct- |
WQI | 61.41 | 73.49 | 89.72 | 89.70 | 71.84 | 59.19 | 69.86 | 89.16 | 51.50 | 53.33 | 57.75 | 46.68 |
Status | Poor | Poor | Extremely | Extremely | Poor | Poor | Extremely | Extremely | Poor | Poor | Poor | Good |
Table 21: Results of water quality analysis for Surface water - Nethravati River (Thumbe Vented Dam) (SW-06)
Parameter | Unit | WHO | BIS | Nov- | Dec- | Jan- | Feb- | Mar- | Apr- | May- | Jun- | Jul- | Aug- | Sep- | Oct- |
Cadmium | ug/L | 0.003 | 3 | 2.36 | 2.26 | 2.20 | 2.89 | 2.75 | 2.56 | 2.85 | 2.11 | 1.25 | 1.26 | 2.48 | 2.20 |
Chlorides | mg/L | 250 | 250 | 10 | 9 | 10 | 8 | 8 | 9 | 14 | 10 | 12 | 10 | 12 | 10 |
Copper | ug/L | 2 | 0.05 | 5.46 | 7.30 | 6.25 | 4.30 | 6.59 | 8.98 | 4.35 | 3.51 | 2.63 | 3.12 | 4.36 | 5.20 |
EC | uS /cm | 400 | 300 | 320 | 360 | 390 | 420 | 450 | 510 | 530 | 610 | 600 | 390 | 480 | 390 |
DO | mg /L | 6 | 6 | 5.6 | 5.8 | 5.9 | 6.1 | 6.3 | 6.8 | 7.0 | 7.1 | 7.3 | 6.9 | 6.8 | 6.6 |
Fluorides | mg/L | 1.5 | 1.0 | 0.04 | 0.02 | 0.06 | 0.07 | 0.01 | 0.02 | 0.03 | 0.02 | 0.08 | 0.06 | 0.08 | 0.09 |
Hardness | mg/L | 200 | 200 | 22 | 23 | 24 | 22 | 23 | 23 | 25 | 14 | 12 | 10 | 14 | 12 |
Iron(Fe) | mg/L | 0.30 | 0.30 | 0.120 | 0.120 | 0.140 | 0.130 | 0.080 | 0.160 | 0.140 | 1.63 | 2.86 | 0.19 | 0.20 | 0.24 |
Lead | ug/L | 10 | 10 | 5.40 | 4.12 | 6.25 | 3.21 | 7.15 | 8.24 | 6.25 | 5.20 | 4.32 | 3.62 | 4.13 | 4.96 |
Manganese | ug/L | 400 | 100 | 0.04 | 0.06 | 1.0 | 1.10 | 2.12 | 2.20 | 2.23 | 1.02 | 1.02 | 0.06 | 3.25 | 4.02 |
Nitrates | mg/L | 50 | 45 | 1.24 | 2.22 | 1.60 | 2.0 | 1.02 | 2.10 | 0.06 | 1.15 | 2.12 | 3.34 | 3.34 | 5.0 |
pH | 6.5-8 | 6.5-8.5 | 7.60 | 7.80 | 7.83 | 7.96 | 7.70 | 7.60 | 7.60 | 7.80 | 7.22 | 7.12 | 7.26 | 6.98 | |
Sodium | mg/L | 200 | 20 | 5.8 | 5.6 | 6.0 | 4.6 | 5.10 | 5.30 | 4.8 | 3.2 | 4.0 | 5.10 | 5.40 | 7.90 |
Sulfates | mg/L | 250 | 200 | 2.04 | 2.69 | 2.12 | 1.69 | 1.46 | 1.12 | 4.63 | 1.20 | 12.2 | 2.26 | 2.10 | 0.18 |
TDS | mg/L | 600 | 500 | 23 | 21 | 24 | 26 | 28 | 31 | 25 | 12 | 12 | 16 | 30 | 11 |
Turbidity | NTU | 5 | 1 | 1.4 | 1.0 | 1.10 | 2.20 | 1.62 | 2.98 | 3.0 | 12.6 | 32.7 | 16.9 | 3.9 | 10.0 |
Zinc | ug/L | 3 | 5 | 8.24 | 11.10 | 12.90 | 13.48 | 15.10 | 14.13 | 6.96 | 7.62 | 16.27 | 16.86 | 8.65 | 11.46 |
 | Figure 9: Results of Water Quality Analysis for Surface water- Netravati River (Thumbe Vented Dam) from Nov 2018 to Sep 2019.
|
In the current analysis EC values exceed the WHO and BIS acceptable limits as shown in Figure 9. This may be due to an increase charged particles (ions) and higher temperature.21,22
Table 22: Descriptive Statistics of Water Quality Parameters for Netravati River (Thumbe Vented Dam)
Number | Parameter | Unit | Mean | Median | Standard Deviation | Minimum | Maximum |
1 | Cadmium (Cd) | ug /L | 2.26 | 2.71 | 0.29 | 1.25 | 2.89 |
2 | Chlorides (Cl-) | mg/L | 10.17 | 11.50 | 3.06 | 8 | 14 |
3 | Copper(Cu) | ug /L | 5.17 | 6.67 | 3.44 | 2.63 | 8.98 |
4 | EC | uS /cm | 454.17 | 520.00 | 86.81 | 320 | 610 |
5 | DO | mg /L | 6.52 | 6.90 | 0.31 | 5.6 | 7.3 |
6 | Fluorides (F-) | mg/L | 0.05 | 0.03 | 0.00 | 0.010 | 0.090 |
7 | Hardness | mg/L | 18.67 | 24.00 | 32.24 | 10 | 25 |
8 | Iron( Fe) | mg/L | 0.50 | 0.15 | 0.73 | 0.08 | 2.86 |
9 | Lead(Pb) | ug /L | 5.24 | 7.25 | 2.26 | 3.21 | 8.24 |
10 | Manganese,Mn | ug /L | 1.51 | 2.22 | 1.63 | 0.04 | 4.02 |
11 | Nitrates, NO3 | mg/L | 2.10 | 1.08 | 1.70 | 0.06 | 5.0 |
12 | pH | 7.54 | 7.60 | 0.10 | 6.98 | 7.96 | |
13 | Sodium,Na | mg/L | 5.23 | 5.05 | 1.32 | 3.2 | 7.90 |
14 | Sulfates, SO4 | mg/L | 2.81 | 2.88 | 9.89 | 0.18 | 12.2 |
15 | TDS | mg/L | 21.58 | 28.00 | 51.54 | 11 | 31 |
16 | Turbidity | NTU | 7.45 | 2.99 | 90.21 | 1.0 | 32.7 |
17 | Zinc,Zn | ug /L | 11.90 | 10.55 | 11.81 | 6.96 | 16.86 |
Table 23: Temporal Distribution of Water Quality of Netravati River (Thumbe Vented Dam) By Weighted Arithmetic Index Method
Month & | Nov- | Dec- | Jan- | Feb- | Mar- | Apr- | May- | Jun- | Jul- | Aug- | Sep | Oct- |
WQI | 78.60 | 57.44 | 50.46 | 57.24 | 57.67 | 60.16 | 58.78 | 89.76 | 45.30 | 46.07 | 49.95 | 47.40 |
Status | Extremely | Poor | Poor | Poor | Poor | Poor | Poor | Extremely | Good | Good | Good | Good |
Table 24: Results of water quality analysis for Surface water - Nethravati River (Pane Mangalore Bridge ) (SW-07)
Parameter | Unit | WHO | BIS | Nov-2018 | Dec-2018 | Jan-2019 | Feb-2019 | Mar-2019 | Apr-2019 | May-2019 | Jun-2019 | Jul-2019 | Aug-2019 | Sep-2019 | Oct-2019 |
Cadmium | ug/L | 0.003 | 3 | 2.26 | 2.26 | 2.60 | 2.80 | 2.95 | 2.56 | 2.85 | 2.11 | 1.23 | 1.26 | 2.48 | 2.20 |
Chlorides | mg/L | 250 | 250 | 10 | 9 | 10 | 8 | 8 | 9 | 14 | 10 | 12 | 10 | 12 | 10 |
Copper | ug/L | 2 | 0.05 | 5.46 | 7.30 | 6.25 | 4.30 | 6.59 | 8.98 | 4.35 | 3.51 | 2.63 | 3.12 | 4.36 | 5.20 |
EC | uS /cm | 400 | 300 | 380 | 390 | 400 | 420 | 360 | 380 | 390 | 430 | 460 | 490 | 390 | 370 |
DO | mg /L | 6 | 6 | 6.1 | 6.3 | 6.1 | 6.0 | 6.5 | 7.1 | 6.8 | 6.2 | 6.3 | 6.1 | 6.1 | 6.1 |
Fluorides | mg/L | 1.5 | 1.0 | 0.04 | 0.02 | 0.06 | 0.07 | 0.01 | 0.02 | 0.03 | 0.02 | 0.08 | 0.06 | 0.08 | 0.08 |
Hardness | mg/L | 200 | 200 | 23 | 23 | 25 | 22 | 23 | 23 | 25 | 14 | 12 | 10 | 12 | 12 |
Iron(Fe) | mg/L | 0.3 | 0.3 | 0.120 | 0.120 | 0.140 | 0.130 | 0.080 | 0.160 | 0.140 | 1.63 | 2.86 | 0.19 | 0.20 | 0.24 |
Lead | ug/L | 10 | 10 | 5.40 | 4.12 | 6.25 | 3.21 | 7.15 | 8.24 | 6.25 | 5.20 | 4.32 | 3.62 | 4.13 | 4.96 |
Manganese | ug/L | 400 | 100 | 0.04 | 0.06 | 1.0 | 1.10 | 2.12 | 2.20 | 2.23 | 1.02 | 1.02 | 0.06 | 3.25 | 4.02 |
Nitrates | mg/L | 50 | 45 | 1.24 | 2.22 | 1.60 | 2.0 | 1.02 | 2.10 | 0.06 | 1.15 | 2.12 | 3.34 | 3.34 | 5.0 |
Ph | 6.5-8 | 6.5-8.5 | 7.80 | 7.80 | 7.86 | 7.98 | 7.70 | 7.60 | 7.60 | 7.80 | 7.22 | 7.12 | 7.26 | 6.96 | |
Sodium | mg/L | 200 | 20 | 5.8 | 5.6 | 6.0 | 4.6 | 5.10 | 5.30 | 4.8 | 3.2 | 4.0 | 5.10 | 5.40 | 7.90 |
Sulfates | mg/L | 250 | 200 | 2.04 | 2.69 | 2.12 | 1.69 | 1.46 | 1.12 | 4.63 | 1.20 | 12.2 | 2.26 | 2.10 | 0.18 |
TDS | mg/L | 600 | 500 | 23 | 21 | 24 | 26 | 28 | 31 | 25 | 12 | 12 | 16 | 30 | 11 |
Turbidity | NTU | 5 | 1 | 1.4 | 1.0 | 1.10 | 2.20 | 1.62 | 2.98 | 3.0 | 12.6 | 32.7 | 16.9 | 3.9 | 10.0 |
Zinc | ug/L | 3 | 5 | 8.24 | 11.10 | 12.90 | 13.48 | 15.10 | 14.13 | 6.96 | 7.62 | 16.27 | 16.86 | 8.65 | 11.46 |
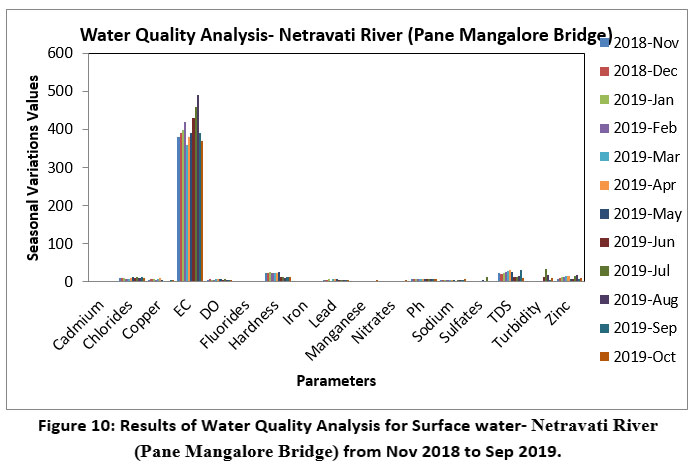 | Figure 10: Results of Water Quality Analysis for Surface water- Netravati River (Pane Mangalore Bridge) from Nov 2018 to Sep 2019.
|
In the current analysis EC values exceed the WHO and BIS acceptable limits as shown in Figure 10. This may be due increase charged particles (ions) and higher temperature and change in climate due to urbanization.21,22
Table 25: Netravati River Water Quality Parameter Descriptive Statistics (Pane Mangalore Bridge)
Number | Parameter | Unit | Mean | Median | Standard Deviation | Minimum | Maximum |
1 | Cadmium (Cd) | ug /L | 2.30 | 2.71 | 0.31 | 1.23 | 2.95 |
2 | Chlorides (Cl-) | mg/L | 10.17 | 11.50 | 3.06 | 8 | 14 |
3 | Copper(Cu) | ug /L | 5.17 | 6.67 | 3.44 | 2.63 | 8.98 |
4 | EC | uS /cm | 405.00 | 385.00 | 14.82 | 360 | 490 |
5 | DO | mg /L | 6.31 | 6.95 | 0.11 | 6.0 | 7.1 |
6 | Fluorides (F-) | mg/L | 0.05 | 0.03 | 0.00 | 0.01 | 0.08 |
7 | Hardness | mg/L | 18.67 | 24.00 | 36.06 | 10 | 25 |
8 | Iron( Fe) | mg/L | 0.50 | 0.15 | 0.73 | 0.08 | 2.86 |
9 | Lead(Pb) | ug /L | 5.24 | 7.25 | 2.26 | 3.21 | 8.24 |
10 | Manganese,Mn | ug /L | 1.51 | 2.22 | 1.63 | 0.04 | 4.02 |
11 | Nitrates, NO3 | mg/L | 2.10 | 1.08 | 1.70 | 0.06 | 5.0 |
12 | pH | 7.56 | 7.60 | 0.11 | 6.96 | 7.98 | |
13 | Sodium,Na | mg/L | 5.23 | 5.05 | 1.32 | 3.2 | 7.90 |
14 | Sulfates, SO4 | mg/L | 2.81 | 2.88 | 9.89 | 0.18 | 12.2 |
15 | TDS | mg/L | 21.58 | 28.00 | 51.54 | 11 | 31 |
16 | Turbidity | NTU | 7.45 | 2.99 | 90.21 | 1.0 | 32.7 |
17 | Zinc,Zn | ug /L | 11.90 | 10.55 | 11.81 | 6.96 | 16.86 |
Table 26: Temporal Distribution of Water Quality of Netravati River (Pane Mangalore Bridge) By Weighted Arithmetic Index Method
Month & | Nov- | Dec- | Jan- | Feb- | Mar- | Apr- | May- | Jun- | Jul- | Aug- | Sep- | Oct- |
WQI | 78.63 | 87.72 | 73.91 | 76.64 | 52.19 | 62.81 | 54.88 | 50.90 | 49.54 | 41.58 | 49.87 | 46.72 |
Status | Extremely Poor | Extremely Poor | Poor | Extremely Poor | Poor | Poor | Poor | Good | Good | Good | Good | Good |
The water quality of Netravathi River sample, shown in Table 25 and 26, collected in the location of pane Mangalore bridge varies from very poor and poor in pre -monsoon and post- monsoon but water quality is good in monsoon season because of the dilution.
Table 27: Overall Water Quality analysis by Weighed Arithmetic Method in Monsoon, post-monsoon, and pre-monsoon.
SEASON | Months | SW - 1 | SW - 2 | SW - 3 | SW - 4 | SW- 5 | SW-6 | SW-7 |
Pre Monsoon | Jan | 2 | 1 | 2 | 2 | 4 | 4 | 3 |
Feb | 4 | 1 | 4 | 4 | 4 | 4 | 4 | |
March | 4 | 1 | 4 | 4 | 3 | 3 | 3 | |
April | 4 | 1 | 4 | 4 | 3 | 3 | 3 | |
May | 4 | 1 | 4 | 3 | 4 | 4 | 3 | |
Monsoon | June | 4 | 2 | 4 | 4 | 4 | 4 | 2 |
July | 3 | 2 | 2 | 4 | 3 | 4 | 2 | |
August | 3 | 2 | 2 | 3 | 3 | 3 | 2 | |
September | 2 | 1 | 2 | 2 | 3 | 3 | 2 | |
Post Monsoon | October | 2 | 1 | 2 | 2 | 2 | 2 | 2 |
November | 2 | 1 | 2 | 2 | 3 | 4 | 4 | |
December | 2 | 2 | 2 | 2 | 3 | 3 | 4 |
From Table 27, the universal water quality indices for River Gurupura River ( Kulur Bridge ) (SW-01) is Good in monsoon and post- monsoon season. Water quality of Gurupura river (Maravoor) (SW-02) is vary from Excellent to Good.Water quality of Gurupura River (Gurupura Bridge)(SW-03) is categorized as Good in Monsoon and Post Monsoon. Water quality of Gurupura River (Addur Bridge) (SW-04) is Good in Monsoon and in Post Monsoon.Water quality of Netravathi River (Netravathi Bridge) (SW-05) is vary from Fair to Very Poor in all the seasons.Water quality of Netravathi River (Thumbe Dam) (SW-6) is also vary from Fair to Very Poor.Water quality of Netravathi River (Pane Mangalore/Old Bridge) (SW-07) is Good in Monsoon Season.
Supporting theories for Urbanization
Obtained results evaluated the quality of the water both in the Netravati and Gurupur river. However, waters are suitable for consumption during the monsoon season; nevertheless, during the pre- and post-monsoon periods, they require a certain degree of treatment before being deemed safe for consumption, because of rapid urbanization in the Mangalore city. Which details the Industrial Growth: Establishment of Land-use changes and population growth have been facilitated by industries such as Mangalore Chemicals & Fertilizers (MCF), Mangalore Refinery and Petrochemicals Ltd. (MRPL), and other Special Economic Zones.23 Port and Maritime Activities: The New Mangalore Port has boosted trade, transport, and industrial infrastructure, accelerating urban sprawl near the coastal belt and estuarine zones. Education and Health Hub:With institutions like NITK, KMC, and St. Aloysius College, Mangalore attracts students from across India, supporting rapid real estate and urban growth. Migration and Employment: In-migration from rural areas and other parts of India for jobs and education has caused increased demand for housing, transportation, and services. Transport Infrastructure: Development of highways (NH-66, NH-75), the international airport, and rail connectivity has enhanced urban-rural linkages and real estate development.24 The present study results are compared with the previous other relevant studies done in the same location is shown in the Table 28.
Table 28: Comparative Studies
Study Area | Discussion and Results |
River Nethravathi, Karnataka | The water quality was found to be declining during the festival season in November due to urbanization.25 |
Netravathi and Gurupura river estuary, in Dakshina Kannada District of Karnataka state, India. | Urban and agricultural runoff, industrial discharge, and polluted sewage effluents all enter the estuary of the Netravathi and Gurupura rivers. Thousands of people rely on this specific river, hence the ecosystem's quality is extremely important.26 |
Nethravathi, Kumaradhara and Gurupura (within the Gurupura sub-river basin) streams | The findings of the study show that anthropogenic activities cause considerable contamination during the pre-monsoon season. According to the evaluation, around 50% of the river from the mid-region to the downstream region was poisoned.27 |
Netravathi-Gurupur estuary located at latitude12° 51' N and longitude 74° 50' E in Mangalore, Karnataka, India. | The research aimed to evaluate the water quality of the Netravathi-Gurupur estuary as an indicator of environmental health across spatial and temporal scales, emphasizing the aquatic stress caused by surrounding industrial and agricultural activities. It also examined the trophic status of the estuary and the Water Quality Index (WQI) relevant to brackish water fisheries. Seasonal variations and human-induced inputs were found to significantly impact nutrient levels and salinity, with the results indicating elevated salinity in the region.28 |
Netravati and Gurupur River -Mangalore | Both Netravati and Gurupur river waters are suitable for consumption during the monsoon season; however, during the pre- and post-monsoon periods, they require a certain degree of treatment before being deemed safe for consumption |
Discussion
The above table 28 (Comparative Study) clearly shows that the quality of surface water resources degrading due to urbanization activities, and in 2024, even the aquatic bodies shrank to 32.2471 km². This is a result of both unplanned urbanization and population growth.29 Significant effects on nearby water sources, such as the contamination of the Netravathi-Gurupur estuary, are revealed by comparing the findings of earlier research with those of the current study. The Netravathi, Gurupur, and their estuary are Mangalore's main surface water supplies, and urban activities are making them more polluted. Municipal solid waste, organic waste from the city, and untreated or partially treated home sewage all contribute to the pollution of the Netravathi-Gurupur estuary. This has been identified as a primary cause of habitat degradation in both past and present research. Industries along riverbanks release pollution loads that include chemicals, heavy metals, and other wastes. These are known as industrial effluents. The companies close to the Baikampady industrial cluster and Mangalore's coastline emit a lot of pollutants, which are also found in the Netravathi and Gurupur rivers, according to earlier and current research. Development initiatives- Proposed and ongoing infrastructure initiatives near riverbanks provide environmental hazards as well. The following effective treatments are suggested for both Netravathi and Gurupur river for the usage, Upgrading STPs for nutrient removal, Bioremediation with aquatic organisms, Zero effluent discharge from industries, Strict waste management, Control of urban runoff, and Limit harmful household chemicals.
Conclusion
Based on theWeighted Arithmetic Index Method, the two main rivers in the research area had their universal water quality indexes calculated. However, the research area's surface water quality assessment falls below the cap limit of both before and after the monsoon, but it is satisfactory during the monsoon. Based on the aforementioned findings, we can say that the water quality of the two main rivers, Netravati and Gurupura, is good during the rainy season because the water level has increased and the river's saturation level has increased. According to the current study, the water is unsafe for human consumption during the pre-monsoon and post-monsoon seasons. As a result, it is advised that efficient treatment should be performed in conjunction with ongoing monitoring during both of these periods. Nevertheless, the town of Mangalore has had remarkable growth over the last ten years, and it currently boasts a population of roughly 7,24,159. The industrial and tertiary sectors close to Mangalore are still expanding and drawing a lot of visitors. The city is undergoing physical and socioeconomic changes as a result of the commercial, industrial, and educational activities that have caused its fast expansion. Additional demand will need to be created in light of this developing scenario of higher development. As a result, an attempt must be made to address the problems through appropriate urban planning and city policy. Predicting urban expansion aids policymakers and urban planners in offering improved infrastructural services to a large number of newly arrived urban people. It is the responsibility of society to keep the fresh water resources clean by avoiding the flow of drainage water or by avoiding the throw of plastics waste to river, and also government has to make strict policy to control the discharge of effluents from the industries.
Acknowledgement
I would like to acknowledge the VTU and VCET puttur for providing a laboratory facility. Materials from this journal may be reproduced for non-commercial or educational purposes without the need for prior permission, provided the source is properly credited
Funding Sources
The author(s) received no financial support for the research, authorship, and/or publication of this article
Conflict of Interest
The authors do not have any conflict of interest.
Data Availability Statement
All data generated or analyzed during this study are included in this article [and its supplementary information files].
Ethics Statement
This research did not involve human participants, animal subjects, or any material that requires ethical approval.
Informed Consent Statement
This study did not involve human participants, and therefore, informed consent was not required.
Permission to reproduce material from other sources
Not Applicable
Author contributions
Yogesha Doora Shivanna : Executed the experiment and analyzed the obtained results.
Umesh Chandra: Hypothesized and supervised the study.
Sandeep Nayak: Assisted in the interpretations of the results.
References
- Grimm NB, Grove J, Pickett STA, Redman CL. Integrated approaches to long-term studies of urban ecological systems. BioScience. 2000;50(7):571-584.
CrossRef - Agatemor C, Agatemor UM. Physico-chemical characteristics of well waters in four urban centers in Southern Nigeria. Environist. 2010;30(4):333-339.
CrossRef - Dewidar KHM. Detection of land use/land cover changes for the northern part of the Nile delta (Burullus region), Egypt. Int J Remote Sens. 2004;25(20):4079-4089.
CrossRef - Maillard P, Santos NAP. A spatial-statistical approach for modeling the effect of non-point source pollution on different water quality parameters in the Velhas river watershed—Brazil. J Environ Manag. 2006;86:158-170.
CrossRef - Ji CY, Liu Q, Sun D, Wang S, Lin P, Li X. Monitoring urban expansion with remote sensing in China. Int J Remote Sens. 2001;22(8):1441-1455.
CrossRef - HM Siddaram, Bharadi HH. Understanding the processes of urbanization and spatial concentration in India: A study of Karnataka. Int J Res Soc Sci. 2017;7(11):1-10.
- Kumar A, Pandey AC, Hoda N, Jeyaseelan AT. Evaluating the long-term urban expansion of Ranchi urban agglomeration, India using geospatial technology. J Indian Soc Remote Sens. 2011;39(2):213-224.
CrossRef - Pandit MK, Bhardwaj V, Pareek N. Urbanization impact on hydrogeological regime in Jaipur rban block: A rapidly growing urban center in NW India. Environist. 2006;26:165.
CrossRef - Population of cities in India 2021. Statistics Times. Published January 30, 2023.
- Ramachandra TV, Aithal BH. Spatio-temporal dynamics of urbanising landscape in twin cities in Karnataka, India. Int J Artif Intell Mechatronics. 2012;1(5):1-10.
- American Public Health Association (APHA). Standard methods for the examination of water and wastewater. 21st ed. APHA; 2005. Washington, DC.
- Brown RM, McClelland NI, Deininger RA, O’Connor MF. A water quality index—crossing the psychological barrier. In: Proceedings of the International Conference on Water Pollution Research. Jerusalem, Israel; June 18-24, 1972:173-182.
CrossRef - American Public Health Association (APHA). Standard methods for the examination of water and wastewater. 23rd ed. APHA; 2017. Washington, DC.
- World Health Organization (WHO). Guidelines for drinking-water quality: Fourth edition incorporating the first addendum. WHO; 2017. Geneva, Switzerland.
- Govindaraju P, Balasubrahmanian A, Nagaraju D, Krishnamurthy V. Water quality index (WQI) to evaluate groundwater quality in Chickmagaluru district, South Karnataka, India. Curr World Environ. 2022;17:197-212.
CrossRef - Bhatt MP, Gardner KH. Variation in DOC and trace metal concentration along the heavily urbanized basin in Kathmandu Valley, Nepal. Environ Geol. 2008;58:867-876.
CrossRef - Dewan AM, Yamaguchi Y, Rahman Z. Dynamics of land use/cover changes and the analysis of landscape fragmentation in Dhaka Metropolitan, Bangladesh. GeoJournal. 2012;77:315-330.
CrossRef - He H, Zhou J, Wu Y, Zhang W, Xie X. Modelling the response of surface water quality to the urbanization in Xi’an, China. J Environ Manag. 2008;86(4):731-749.
CrossRef - Vermeiren K, VanRompaey A, Loopmans M, Serwajja E, Mukwaya P. Urban growth in Kampala, Uganda: Pattern analysis and scenario development. Landscape Urban Plan. 2012;106(2):199-206.
CrossRef - Leung CM, Jiao JJ, Malpas J, Chan WT, Wang YX. Factors affecting the groundwater chemistry in a highly urbanized coastal area in Hong Kong: an example from the Mid-Levels area. Environ Geol. 2005;48:480-495.
CrossRef - Uttara S, Bhuvandas N, Aggarwal V. Impacts of urbanization on environment. Int J Res Eng Appl Sci. 2012;2(2):1-10.
- Mangalore city census 2011 data – Mangalore slums 2011. Census 2011. Published February 16, 2017.
- Urban agglomerations/cities having population 1 lakh and above. Census of India. Published August 13, 2019. Accessed September 8, 2025
- United Nations (UN). World urbanization prospects: The 2004 revision. United Nations Population Division; 2005. New York, NY.
- Avvannavar SM. Studies on pollution of River Nethravathi, Karnataka. Nat Environ Pollut Technol. 2007;6:541-542.
- Darshan MS, Shivanna, Siddaraju K, Madesh P. Water quality studies of Netravathi and Gurupura river estuary, Dakshina Kannada district, Karnataka state, India. World J Eng Res Technol. 2021;8(6):1-10.
- Suryawanshi V, H Ramesh, T Nasar. Rejuvenating Nethravathi River: The enhancement of water quality amidst the Covid-19 pandemic using remote sensing and GIS approach. Int J Eng Res Technol. 2022;12(4):1-10.
CrossRef - Sahoo S, Saha A, Vijaykumar ME, et al. Assessment of water quality of Netravathi-Gurupur estuary, India through chemometric approach for fisheries sustainability. Mar Pollut Bull. 2024;200:116043.
CrossRef - Yogesha DS, Nayak S, Chandra U. Assessing the land use/land cover changes due to urbanization in Mangalore, Karnataka, India. Int J Environ Sci. 2025;11(8s):1-10.
CrossRef


