Management of Urban Water Resources through AMRUT in Uttar Pradesh
Awadhesh Kumar Singh1
 , Priyansha Singh1
*
and Manoj Kumar Sharma2
, Priyansha Singh1
*
and Manoj Kumar Sharma2
1
Regional Centre for Urban and Environmental Studies,
University of Lucknow,
Lucknow,
Uttar Pradesh
India
2
Department of Statistics, Mathematics and Computer Science,
Sri Karan Narendra Agriculture University,
Jobner-Jaipur,
Rajasthan
India
http://dx.doi.org/10.12944/CWE.20.2.24
Copy the following to cite this article:
Singh A. K, Singh P, Sharma M. K. Management of Urban Water Resources through AMRUT in Uttar Pradesh. Curr World Environ 2025;20(2). DOI:http://dx.doi.org/10.12944/CWE.20.2.24
Copy the following to cite this URL:
Singh A. K, Singh P, Sharma M. K. Management of Urban Water Resources through AMRUT in Uttar Pradesh. Curr World Environ 2025;20(2).
Download article (pdf)
Citation Manager
Publish History

Introduction
The rapid urbanization in India has significantly impacted the quality of life in its cities, leading to a decline in the physical environment and overall urban living conditions. This deterioration is largely due to the growing gap between the demand for and supply of essential infrastructure and services. India's urban challenges are vast, complex, and diverse, characterized by social inadequacies, economic significance, and a large demographic footprint.1 Since independence, urban development strategies have evolved alongside the country's broader development philosophies, but the rapid pace of urbanization has far exceeded the expansion of public infrastructure, putting tremendous strain on the environment, metropolitan areas, and standard of living. To address these issues, the Indian government on June 25, 2015, established the Atal Mission for Rejuvenation and Urban Transformation (AMRUT). AMRUT focuses on improving urban infrastructure and governance, with a particular emphasis on water supply, sewerage, sanitation, urban transport, and the redevelopment of old city areas.2 The mission aims to ensure that every household has access to clean water and sewerage connections, enhance urban greenery and open spaces, and reduce pollution by promoting public and non-motorized transport. Through these efforts, AMRUT seeks to rejuvenate Indian cities, improve service delivery, and foster community participation and accountability in urban management.2 Water pollution is a major environmental and public health concern across the globe. In India, unchecked urbanization, industrial discharge, and improper waste disposal have led to the contamination of surface and groundwater sources. Polluted water bodies not only disrupt aquatic ecosystems but also endanger human lives by causing water-borne diseases such as cholera, dysentery, and typhoid. Inadequate treatment facilities and lack of proper sanitation further exacerbate the problem, especially in low-income urban areas. According to CPCB,3 more than 60 percent of the river stretches in India are polluted due to municipal and industrial effluents. Advanced materials play a transformative role in modern environmental engineering, particularly in water treatment technologies. These include nanomaterials, metal-organic frameworks (MOFs), membrane composites, and smart polymers, which offer superior efficiency in filtration, adsorption, and catalytic degradation of pollutants. Their high surface area, reactivity, and functional tunability enable targeted removal of heavy metals, pathogens, and organic compounds. By incorporating such materials into urban water management systems, cities can achieve higher purification standards, longer system lifespans, and energy-efficient solutions. Adsorption is a widely adopted and cost-effective method for water purification, involving the accumulation of contaminants on a solid surface from a liquid phase. Activated carbon, zeolites, biochar, and advanced adsorbent composites are commonly used materials. The technique is highly effective in removing dissolved organics, heavy metals, and other micro-pollutants. Its advantages include easy regeneration, scalability, and low operational cost. In urban water treatment frameworks, adsorption is often integrated with other technologies to enhance removal efficiency and ensure compliance with quality standards. Although various studies have evaluated the performance of urban water supply schemes in India, few have provided an integrated beneficiary-centric impact assessment of AMRUT. Most existing literature either focuses on technical performance or financial aspects. There is limited empirical evidence correlating citizen satisfaction with statistical performance indicators of infrastructure development. Moreover, existing studies often overlook regional disparities in mission outcomes. Recent works, such as Wankhade et al.4 and WaterAid,5 emphasize the need for participatory assessments that align mission outcomes with global benchmarks such as Sustainable Development Goals (SDGs).
Water Resource Management
Access to potable water is essential for good health and serves as a barometer of the socioeconomic standing of the neighborhood. Primary and secondary sources make up the majority of India's water supplies. Examples of main sources include rivers, ponds, lakes, tanks, precipitation, glacier melt, groundwater, hand pumps, bore and tube wells, covered and uncovered wells, seawater, and atmospheric water. Secondary sources include things like tap water from treated and untreated sources, tanker supplies, canals, dam reservoirs, bottled water, and tanker supplies.6 India is 46th in the world according to Versik Maplecroft's Water Stress Index, but Examining the situation more closely shows that 11 of the 20 largest cities in the nation are in grave danger as a result of their consumption approaching the point at which resources can no longer be used.7 India's cities still struggle with issues such as inadequate coverage, non-revenue water (NRW), inadequate infrastructure, and the prevalence of unofficial supply networks.8 In many Indian towns, over 40% of the water supplied is produced with no revenue, either through leakage or unbilled use. This results in low-cost recovery and, ultimately, low service quality, which leads to inadequate water supply.8 According to Desai,9 water produced at filtration or treatment plants passes via a variety of networks, and as it passes through trunk lines, distribution systems, etc., its quality deteriorates. The main causes of low water quality include inadequately maintained pipeline networks, sporadic water supply in pipelines close to city sewers, etc.10 Many studies have linked the prevalence of vector-borne and water-borne illnesses, including diarrhea, to poor sanitation and wastewater management. Additionally, one of the leading causes of death for children under five is diarrhea. Nearly 90 percent of pediatric diarrheal illness deaths are caused by tainted water, poor sanitation, or poor hygiene, according to UNICEF.11 According to Awasthi12 good sanitation is essential for leading a hygienic and civilized life. It has been a part of the evolution of humankind. Lack of sanitary facilities causes water-borne illnesses, reduced productivity, and a lack of dignity. Furthermore, severe and persistent diarrhea may result in child stunting, malnourishment, and missed school years. However, a meta-analysis of 25 studies looking at the relationship between sewerage and enteric infections indicated that the prevalence of diarrhea can be decreased by about 30% with sewerage systems, or by up to 60 percent in areas with extremely low baseline sanitation standards.15 Access to the toilet infrastructure is possible via a mix of IHHL, CT, and PT. According to NSS statistics, between 2012 and 2018, access increased by 5 percent, from 91.2 per cent to 96.2 per cent.13 According to Mishra's14 research, sanitation, cleanliness, and hygiene are given a lot of weight in the Sustainable Development Goals. There is strong evidence that improved cleanliness, hygiene, and sanitation contribute to the efficient management of parasite infections, nutritional deficiencies, and a variety of vector-borne illnesses. Improvements in sludge management and ecological sanitation are desperately needed in Indian cities.15
Policy Perspective
Infrastructure development, service delivery, and local government strengthening are the goals of urban development plans, initiatives, and programs. It also emphasized the state and ULB-level reform implementation. The program was put into effect in 65 carefully chosen towns and communities throughout the states between 2005 and 2012. One major government effort that provides water supply and sanitation facilities in urban areas is the Jawaharlal Nehru National Urban Renewal Mission (JNNURM). Its goals include strengthening municipal governments and their operations in compliance with the 74th Constitutional Amendment, improving and expanding the economic and social infrastructure facilities of the cities, and providing basic services, such as affordable tenure security, to the urban poor. Access to sanitation and water supplies are among the seven services provided to the urban poor, and these are mostly dependent on an efficient local government.16 The goal of JNNURM is for the cities to grow. This is a supplement to the 74th Constitutional Amendment Act, which demands that ULBs be given more authority over funding, functions, and employees. JNNURM's Essential Services to the Urban Poor (BSUP) program has placed a strong emphasis on the creation of essential services, like as water and sanitation, for the urban poor. One of the scheme's goals is to establish strong connections between asset generation and asset management so that these fundamental activities can eventually become self-sustaining.
During its first five-year plan era, India included sanitation and water supply as its national priority. However, the area received very little investment until 1979. The government has greatly increased its financial commitment to the sector, primarily to rural sanitation, since the start of the International Drinking Water Supply and Sanitation Decade in 1980.17 Because it not only granted urban sanitation distinct national status but also made it evident to states and cities how vital it is to plan and implement targeted improvements in urban sanitation, the government claims that the national policy represented a turning point in India's urban growth. A National Urban Sanitation Task Force created the National Urban Sanitation Policy, which is a set of comprehensive, exacting guidelines for sanitation. Providing sanitary services to the urban poor and those living in informal settlements became a distinct governmental objective for the first time in this period.18
The Ministry of Urban Development created a standard minimum Service Level Benchmarking framework in 2008 to monitor and report on service level indicators for significant service sectors. A benchmark is one of the key performance indicators. Cities are getting support to improve their urban services, such as sanitation, using the benchmarking system as a performance indicator.19
The 2012 revision of the Rajiv Awas Yojana sought to eliminate slums in India by the Twelfth Plan era by offering all Indians suitable housing and essential civic and social amenities. In order to provide them with the same standard of living as other city inhabitants, the plan calls for integrating all current slums—noticed and unnoticed—into the official system.20
This paper aims to review the AMRUT Mission's financial and physical performance in Uttar Pradesh, analyze the coverage, equity, accessibility, and sustainability of water infrastructure projects like water supply, and evaluate the mission's influence on urban transformation and revitalization, specifically in terms of enhancing the quality of life for city dwellers.
The present paper is based on a major research study conducted under the auspices of the This document presents the findings of a substantial research project carried out in 2023–24 by the Indian Council of Social Science Research, which is part of the Ministry of Education of the Government of India. The basic data used in this article came from a field survey of AMRUT recipients in the Uttar Pradesh cities of Varanasi and Lucknow. Beneficiaries of the various AMRUT Mission components are included in the survey. There are roughly 400 recipients in the sample. The State Annual Action Plan (SAAP) and official state and federal government sources were the primary sources of the secondary data. To extract conclusions and findings, pertinent statistical procedures like regression, ANOVA, f-test, and t-test have been used.
The study employed a cross-sectional design using both qualitative and quantitative research methods. The sampling procedure involved stratified random sampling to ensure representation from both tier I and tier II AMRUT cities, specifically focusing on Lucknow and Varanasi. A total of 400 beneficiaries were surveyed using structured questionnaires.
For statistical analysis, tools such as f-test, t-test, ANOVA, and regression analysis were employed. The rationale for using t-tests and ANOVA was to identify statistically significant differences between means across demographic groups and service satisfaction levels. Regression analysis was utilized to determine the predictive power of service components (e.g., water supply, sewerage) on overall satisfaction. Variables used in regression included service adequacy, infrastructure quality, frequency of supply, community participation, and demographic controls.
Atal Mission for Rejuvenation and Urban Transformation (AMRUT)
The AMRUT's components include urban transportation, stormwater drainage, water supply, sewerage and septage management, capacity building, reform implementation, and the creation of parks and green areas.21 The Urban Local Bodies (ULBs) will make an effort to incorporate some clever elements into the physical infrastructure components during the planning phase.
Results
Under AMRUT, five hundred cities were included. There are currently 61 AMRUT cities in Uttar Pradesh, including 14 Nagar Nigam/Municipal Corporations and 47 Nagar Palika Parishads. Later, NPP Ayodhya was added to the list as well.3 With a total budget of Rs. 50,000 crores from 2015–16 to 2019–20, the Atal Mission for Rejuvenation and Urban Transformation (AMRUT) functions as a Centrally Sponsored Scheme (CSS) and could continue after 2020, contingent on an assessment by the Ministry of Urban Development (MoUD).21 The mission's funds are allocated as follows: 80 percent for project funds, 10 percent for reform incentives, 8 percent for state administrative expenses, and 2 percent for Ministry of Urban Development’s administrative expenses, with adjustments in 2015-16 where project funds were 90 percent. The mission provides 50 percent central assistance for cities with populations up to 10 lakh and one-third for larger cities, with state governments and urban local bodies (ULBs) contributing the remaining costs. ULBs are improving revenue collection and seeking credit ratings to mobilize funds.21 Capacity building has exceeded targets, with 54,321 functionaries trained, including 3,540 in 2020. Rs. 24,306 crores have been released for projects, including Rs. 5,889 crores in 2020, with State Annual Action Plans (SAAPs) totaling Rs. 77,640 crores approved. The mission also emphasizes reforms, such as online services, single-window approvals, and municipal cadre establishment, with Rs. 1,865.36 crore awarded as incentives for reform implementation. Additionally, Rs. 207.34 crore was released to nine ULBs for raising funds through municipal bonds21
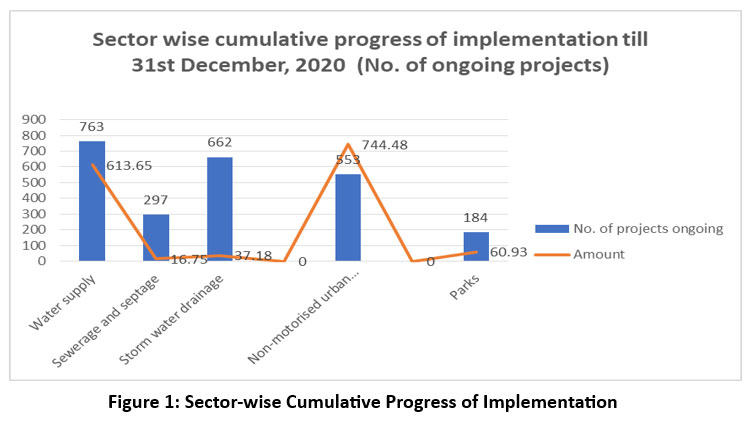 | Figure 1: Sector-wise Cumulative Progress of Implementation
|
Expenditure under AMRUT in Uttar Pradesh
Under the AMRUT Mission in Uttar Pradesh, significant progress has been made in improving water supply and sewerage networks, which are priority sectors.21 Sewerage network coverage was 31% and water supply coverage was 64% at the beginning of the project. By installing 139 lakh water tap connections and 145 lakh sewer connections, the project hopes to reach universal water supply coverage and raise sewerage network coverage to 62 percent in 500 chosen cities. With 30 lakh tap connections and 17 lakh sewer connections finished in 2020 alone, there are currently 95 lakh tap connections and 59 lakh sewer connections—including those under septage management—that have been given.21
The overall change in spending on drinking water projects was -0.79 percent, rising from Rs. 1059.53 crores in 2015–16 to Rs. 1109.03 crores in 2016–17 before falling to Rs. 1051.18 crores in 2017–20.21 Similarly, sewerage project expenditure rose from Rs.1692.17 crores in 2015-16 to Rs.2017.68 crores in 2016-17, with a slight decline to Rs.1988.4 crores in 2017-20, marking a 17.51 percent overall increase. Expenditure on green spaces and parks decreased by 15.14 percent from 2015 to 2020, with Rs.56.21 crores spent in 2015-16, Rs.48.5 crores in 2016-17, and Rs.47.7 crores in 2017-20, despite an overall 60.47 percent increase in the number of projects implemented. The mission has shown steady progress across its components, with detailed performance metrics outlined in Table 1.21
Table 1: Progress of AMRUT in Uttar Pradesh
Head of expenditure | Performance years | Percent change of | Percent change of 2016-17 | Overall Percent over2015-16 | ||
2015-16 | 2016-17 | 2017-20 | ||||
Expenditure on Drinking | 1059.53 | 1109.03 | 1051.18 | 4.67 | -5.22 | -0.79 |
Expenditure on sewerage | 1692.17 | 2017.68 | 1988.4 | 19.24 | -1.45 | 17.51 |
Expenditure on Green land | 56.21 | 48.5 | 47.7 | -13.72 | -1.65 | -15.14 |
No. of Beneficiaries under | 477565 | 298280 | 102741 | -37.54 | -65.56 | -78.49 |
No. of Beneficiaries under | 365759 | 138739 | 236898 | -62.07 | 70.75 | -35.23 |
Physical Green | 86 | 117 | 138 | 36.05 | 17.95 | 60.47 |
Existing Services Level of Water Supply in AMRUT Cities
The coverage of water supply services in AMRUT cities of Uttar Pradesh varies significantly. In Municipal Corporations (Nagar Nigams), coverage ranges from 32 percent in Saharanpur to 78 percent in Allahabad, which also has the highest per capita water availability at 226 LPCD, compared to Aligarh's 90 LPCD. Non-revenue water (NRW) levels are high in most cities, with Meerut reporting the highest NRW at 65 percent and Aligarh the lowest at 21 percent. Cities like Saharanpur, Jhansi, Meerut, Kanpur, Moradabad, and Varanasi show low coverage but high NRW levels.22
In Nagar Palika Parishads (Municipal Councils), water supply coverage ranges from 17 percent in Rampur to 72 percent in Modinagar, with most cities falling between 32 percent and 48 percent. Non-Revenue Water (NRW) levels are also high, with Sambhal reporting the highest at 75 percent and Shahjahanpur the lowest at 23 percent. Per capita water availability varies widely, from 45 Liter Per Capita/ Day (LPCD) in Amroha to 300 LPCD in Ghazipur. While 24 cities have per capita availability below the benchmark of 135 LPCD, 22 cities exceed it. Overall, most AMRUT cities have sufficient per capita water availability, but challenges like high NRW and uneven coverage persist.22
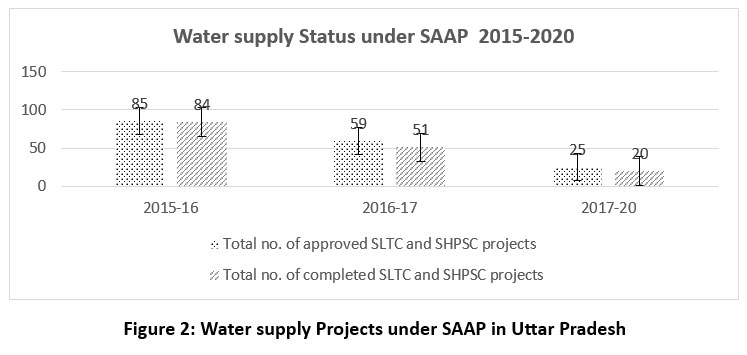 | Figure 2: Water supply Projects under SAAP in Uttar Pradesh
|
The financial allocations and expenditures on water supply projects in Uttar Pradesh are shown in Figure 3.22
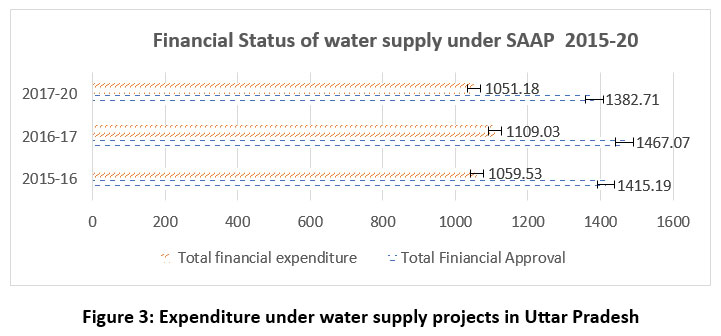 | Figure 3: Expenditure under water supply projects in Uttar Pradesh
|
There has been remarkable progress in number of beneficiaries under the water supply projects in Uttar Pradesh (Figure 4).22
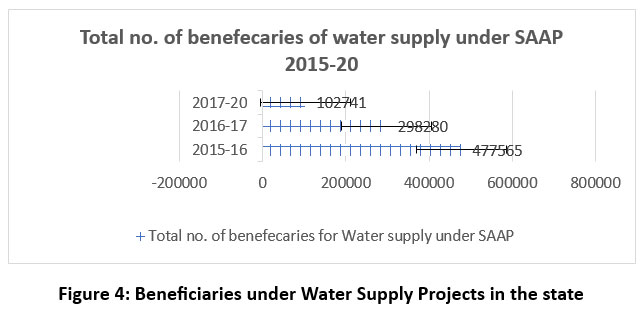 | Figure 4: Beneficiaries under Water Supply Projects in the state
|
Table 2 showcases per beneficiary expenditure on drinking water projects for the fiscal years from 2015-2020 under AMRUT. As per the data collected, it was showcased that in the year 2015-16, the per head expenditure costing was Rs. 22.16 thousand on the drinking water project, which increased to 37.18 thousand in the year 2016-17 and under SAAP III it summed up to around 102.31 thousand Rs. With the development of the projects, the expenditure increased per head for the beneficiaries.22
Table 2: The data on per beneficiary expenditure on drinking water projects for the fiscal years 2015-16, 2016-17, and 2017-20.
Head of expenditure | 2015-16 | 2016-17 | 2017-20 |
Per beneficiary Expenditure on Drinking water projects (Thousand in Rs.) | 22.19 | 37.18 | 102.31 |
Existing Services Level of Sewerage and Septage in AMRUT Cities
The analysis reveals varying levels of latrine and sewerage coverage across Municipal Corporations and Nagar Palika Parishads in India. Most Municipal Corporations have fair latrine coverage, ranging from 83 percent to 98 percent, while Nagar Palika Parishads show a wider range, from 39 percent in Akabarpur to 99 percent in Loni. Sewerage coverage in Municipal Corporations is highest in Ghaziabad (83.82 percent) and lowest in Aligarh (3.54 percent), with cities like Jhansi and Moradabad having no sewerage network.22 Among Nagar Palika Parishads, sewerage coverage ranges from 30 percent to as low as 0.05 percent, and over 34 AMRUT cities lack a sewerage network, relying only on septage. Efficiency in sewerage collection and treatment is below 60 percent in most cities, with Agra reporting the highest efficiency.22 In Nagar Palika Parishads, efficiency is generally low, except for Azamgarh (60 percent). Additionally, 35 out of 60 AMRUT cities reported zero efficiency in sewerage collection and treatment.
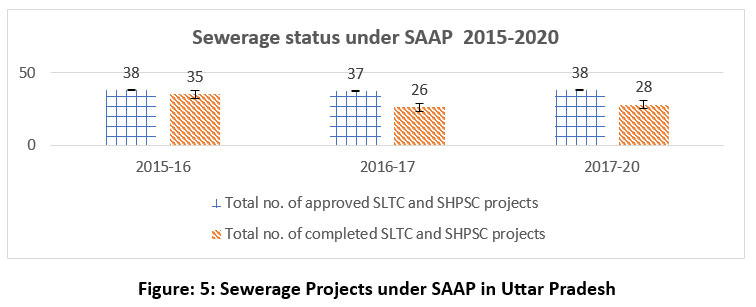 | Figure: 5: Sewerage Projects under SAAP in Uttar Pradesh
|
Expenditure under sewerage projects under the AMRUT Mission in the state of Uttar Pradesh is shown in Figure 6.22
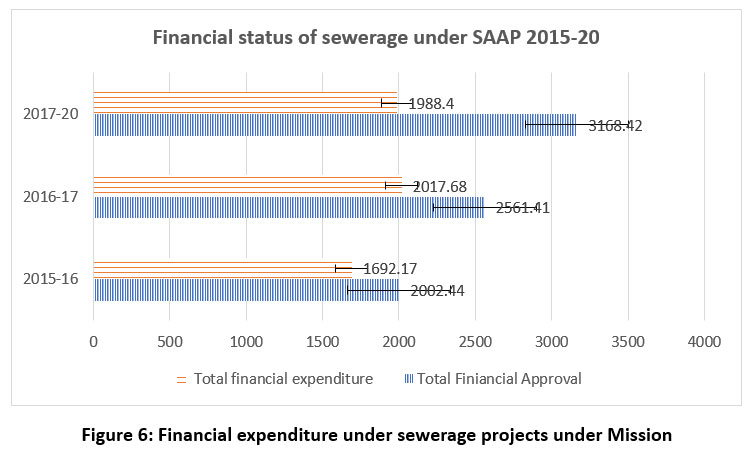 | Figure 6: Financial expenditure under sewerage projects under Mission
|
There has been a significant number of beneficiaries under sewerage projects in the state over the period of 2015-16 to 2019-20 (Figure 7).22
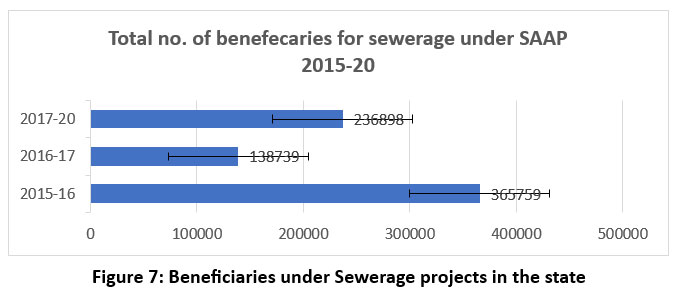 | Figure 7: Beneficiaries under Sewerage projects in the state
|
The data on beneficiary expenditure for sewerage projects from fiscal years 2015-16 to 2017-20 shows that the per beneficiary expenditure was Rs. 46.26 thousand in 2015-16, increased significantly to Rs. 145.43 thousand in 2016-17 and then decreased in 2017-20. This decline was primarily due to the completion of most projects and the allocation and spending of funds under SAAP-I (2015-16) and SAAP-II (2016-17). A table provides detailed per-beneficiary expenditure figures for these fiscal years.22
Table 3: Per beneficiary Expenditure on sewerage (Thousand in Rs.)
Head of expenditure | 2015-16 | 2016-17 | 2017-20 |
Per beneficiary Expenditure on sewerage (Thousand in Rs.) | 46.26 | 145.43 | 83.93 |
Capacity Building Programme
The Capacity Building Programme, initiated by the state government, aimed to train and enhance the skills of elected representatives and municipal officials. Training was primarily conducted by the Regional Centre for Urban and Environmental Studies (RCUES) in Lucknow. However, there was a significant gap between the targets and actual achievements in training from 2015-16 to 2019-20. During 2015-16 to 2016-17, approximately 1,000 individuals were trained. The number of training programs and participants is detailed in Figures 8 and 9.22
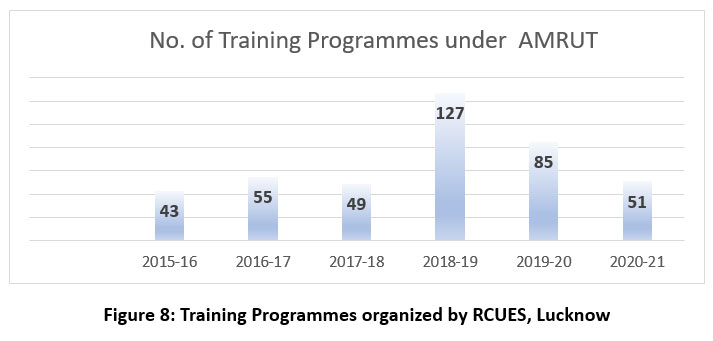 | Figure 8: Training Programmes organized by RCUES, Lucknow
|
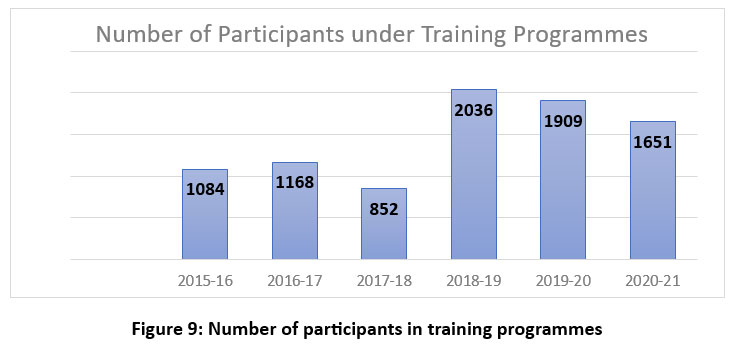 | Figure 9: Number of participants in training programmes
|
Performance Indicators
The data highlights significant progress in access to safe drinking water in urban India, with 90 percent of households having facilities for it, according to the 2001 Census and a 2010 WHO-UNICEF study. However, challenges persist, including inconsistent municipal water supply, wastage of 40-45 percent of water, and limited access to sustainable and affordable services. Uttar Pradesh, despite abundant water resources, faces issues like low per capita water availability, poor service quality, and limited daily supply duration.22 The state's urban water supply system is managed by Jal Sansthan and Uttar Pradesh Jal Nigam, but inefficiencies like improper metering and low user charges hinder improvements. Public willingness to pay for better services exists, but political will to enforce charges is lacking. While progress has been made, disparities remain, with lower coverage in some areas compared to cities like Lucknow and Varanasi.
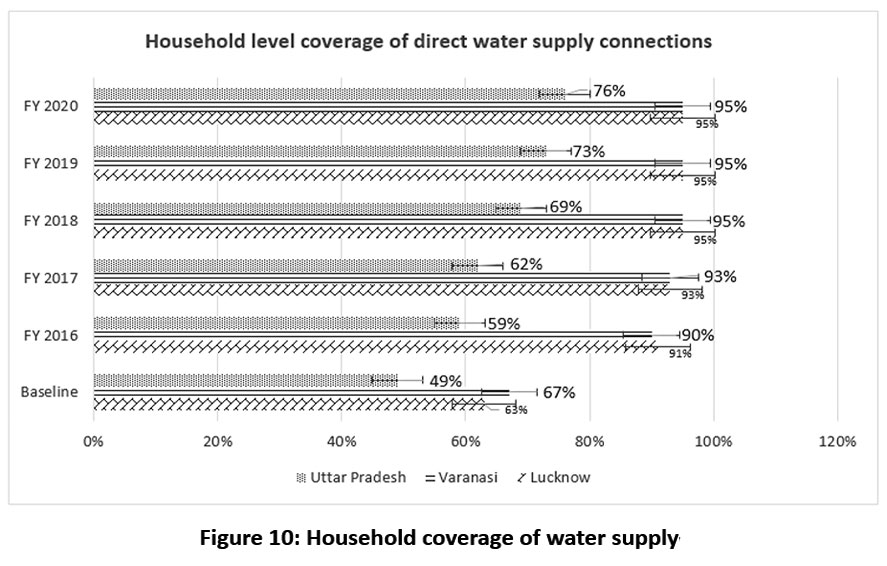 | Figure 10: Household coverage of water supply
|
There has been remarkable progress in the quantum of water supply under the Mission. The per capita water supply has significantly increased over the period (Figure 11).22
 | Figure 11: Per Capita Water Supply in the state
|
The 2030 Water Resources Group-2009 report23 warns that nearly half of India's water demand will go unmet by 2030 if current consumption trends continue. Effective water management, particularly through wastewater reuse and recycling, is critical to addressing this crisis. India already faces water scarcity, with urbanization worsening the issue by increasing demand, expanding water footprints, and contaminating freshwater sources. Technological advancements have made wastewater treatment feasible and cost-effective, offering a viable solution. However, poor urban wastewater management, where 80 percent of water becomes wastewater, has led to pollution, environmental damage, and health risks. Uttar Pradesh exemplifies these challenges, with rapid growth depleting groundwater and contaminating rivers. Innovative strategies like rainwater harvesting and wastewater recycling are essential, supported by policies promoting wastewater as a resource for non-potable uses. A proposed state policy in Uttar Pradesh aims to treat and reuse wastewater for irrigation and industry, reducing pollution and conserving freshwater. While water quality has improved, disparities remain, with Municipal Corporations outperforming the state average.24
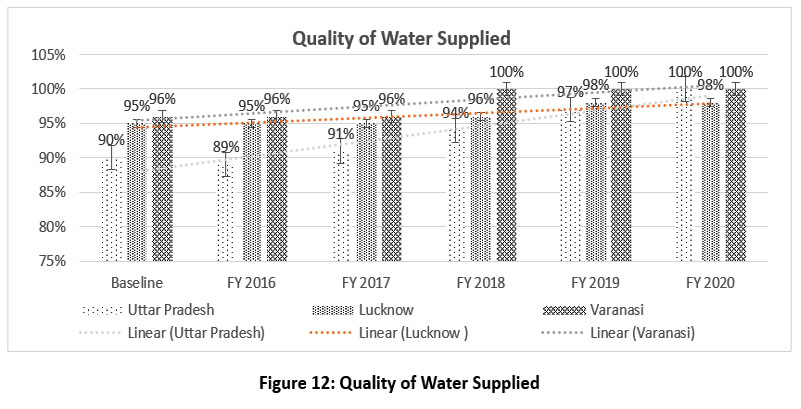 | Figure 12: Quality of Water Supplied
|
The coverage of the sewerage network is shown in Figure 13. There has been a significant increase in the coverage of sewerage and septage facilities.22
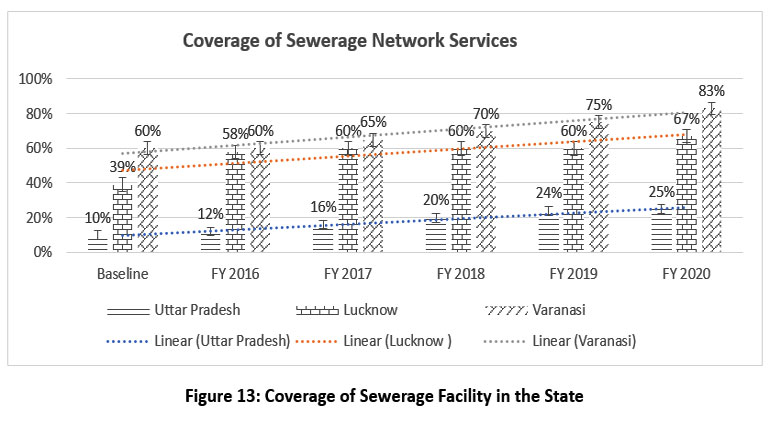 | Figure 13: Coverage of Sewerage Facility in the State
|
There has been a remarkable increase in the collection efficiency of wastewater in the state. This shows the positive impact of the AMRUT Mission in the state (Figure 14).22
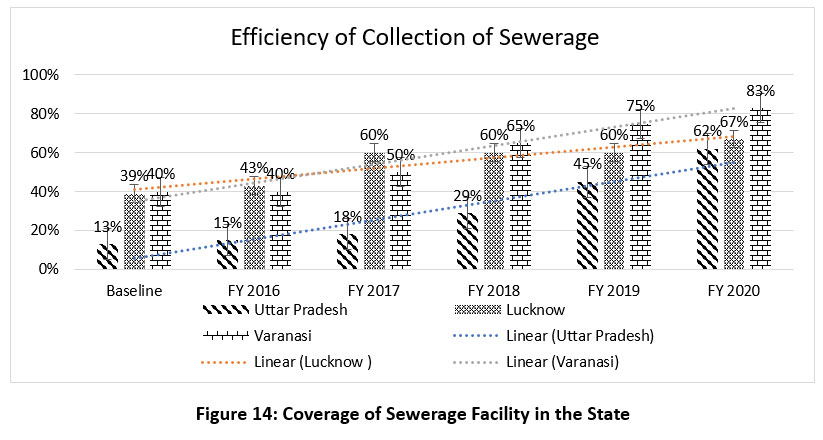 | Figure 14: Coverage of Sewerage Facility in the State
|
The efficiency of treatment of wastewater has significantly increased over the period (Figure 15).
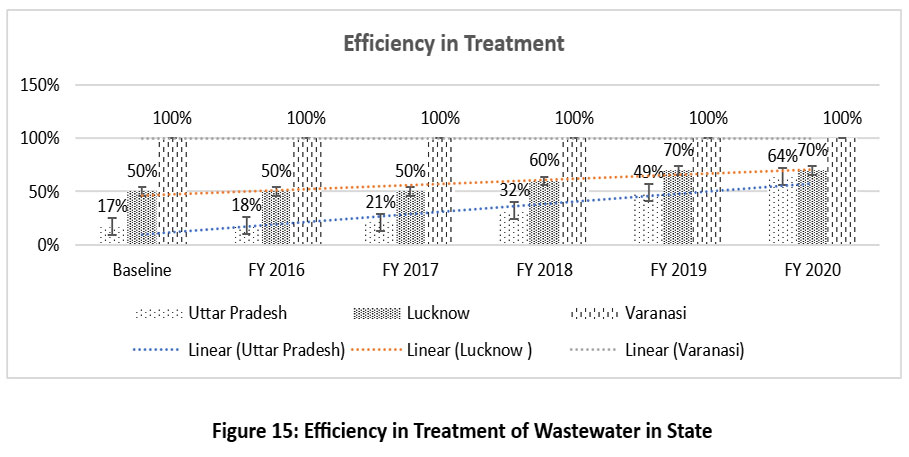 | Figure 15: Efficiency in Treatment of Wastewater in State
|
Indexing of AMRUT Cities Based on Their Performance
The performance of 61 cities in Uttar Pradesh under AMRUT, based on water supply and sewage indicators, was analyzed from 2016 to 2020. These cities were distributed across regions: 29 in the Western Region, 18 in the Eastern Region, 9 in the Central Region, and 5 in Bundelkhand. They were evaluated on metrics like water supply coverage, per capita supply, water quality, sewerage network coverage, and wastewater treatment efficiency. Overall, 45 cities showed medium performance, 9 achieved high performance, and 7 were classified as low-performing.
Table 4: Economic Region-wise Performance Based on AMRUT Indicators for Overall Assessment Period
Region | FY 2016 to 2020 | Total | ||
Low | Medium | High | ||
Western Region | 1 | 25 | 3 | 29 |
3.4% | 86.2% | 10.3% | 100.0% | |
Central Region | 3 | 4 | 2 | 9 |
33.3% | 44.4% | 22.2% | 100.0% | |
Eastern Region | 3 | 11 | 4 | 18 |
16.7% | 61.1% | 22.2% | 100.0% | |
Bundelkhand Region | 0 | 5 | 0 | 5 |
0.0% | 100.0% | 0.0% | 100.0% | |
Total | 7 | 45 | 9 | 61 |
11.5% | 73.8% | 14.8% | 100.0% | |
In Uttar Pradesh, 61 cities were covered under the AMRUT mission, divided into Western (29), Eastern (18), Central (9), and Bundelkhand (5) regions. These cities were evaluated based on performance indicators like water supply, sewerage coverage, and wastewater treatment. From 2016 to 2020, most cities consistently fell into the medium performance category (45 cities), while 9 were high-performing and 7 were low-performing. Over the years, the number of high-performing cities decreased, and low-performing ones increased slightly. Overall, the mission positively impacted the quality of life in these cities.
Discussions
Analysis of Views of Beneficiaries
Sanitation is a fundamental aspect of human development and a cornerstone of a healthy, civilized life, closely linked to environmental health. Inadequate sanitation facilities, particularly in urban areas, lead to water-borne diseases and poor health outcomes. While sewer lines are primarily available in larger cities, most urban populations rely on individual septic tanks, highlighting the urgent need for improved infrastructure and service delivery, including water supply, toilets, drainage, and solid waste management, especially in slums. The lack of sewer networks, poorly functioning treatment plants, and insufficient sanitation services have resulted in dire conditions, with many slum dwellers resorting to open defecation. Government initiatives like AMRUT aim to enhance urban infrastructure, extend basic services to the poor, and strengthen municipal governance.21 Reforms at the state and Urban Local Body (ULB) levels have been introduced to improve service delivery, with cities required to develop Service Level Improvement Plans and Detailed Project Reports under AMRUT. This chapter evaluates the accessibility, utilization, and impact of sanitation infrastructure, such as water and sewerage networks, public toilets, and municipal services, emphasizing the critical role of effective local governance in addressing urban sanitation challenges.21
In Lucknow, the male population constitutes a significant majority, accounting for 74.0 percent of the total population, while females make up the remaining 26. In Varanasi, the male population comprises 69.4 percent of the total, leaving 30.6% for the female population. Combining the populations of both districts, the overall distribution shows that the male population constitutes the majority at 71.9 percent, while the female population makes up 28.1 percent of the total. Major key findings include that in Lucknow, 54.4 percent of households use tap water, 38.4 percent use submersible pumps, and 7.2 percent rely on hand pumps. In Varanasi, 100% of households use tap water. Lucknow has 83.6 percent piped water coverage, while Varanasi has 100 percent. Lucknow saw a significant increase in water connections from 2015-2022, peaking in 2021-2022. Varanasi had most connections established in 2015-2016, with a decline in subsequent years. Lucknow faces irregular supply, with 47.4 percent receiving water for 4-8 hours daily. Varanasi has a more consistent supply, with 73.6 percent receiving water for 8-12 hours. In Lucknow, 37.8 percent experience medium pressure, while 34.9 percent lack data. In Varanasi, 82.9 percent receive medium-pressure water. Lucknow households mostly consume 500-1000 litres daily (53.6 percent). Varanasi households predominantly consume 500-1000 litres (99.1 percent). 92 percent of Lucknow respondents report adequate supply, compared to 50 percent in Varanasi. 67.2 percent of Lucknow respondents never face shortages, while 97.2 percent in Varanasi experience shortages: About 54.8 percent in Lucknow always have quality water, compared to 5.6 percent in Varanasi. About 45.6 percent in Lucknow receive free connections, versus 91.2 percent in Varanasi. About 22 percent in Lucknow report complaints, with only 12.7 percent resolved timely. Varanasi reports no complaints. About 24 percent in Lucknow pay regularly, compared to 55.6 percent in Varanasi. About 41.2 percent of buildings in Lucknow implement RWH, while none in Varanasi do. About 54.8 percent in Lucknow believe conservation is necessary, compared to 2.3 percent in Varanasi. Both districts report 100 percent access to toilet facilities. Overall, the data highlights disparities in water infrastructure, supply reliability, and conservation efforts between Lucknow and Varanasi, with Varanasi showing better-piped water coverage but more frequent shortages and lower conservation awareness. Lucknow, while having a more irregular supply, shows higher adoption of rainwater harvesting and conservation awareness.
Impact of AMRUT Services Under AMRUT
As per the data collected from the respondents, it was observed that there were various service impacts of AMRUT, around 37.60 percent of the respondents agreed that AMRUT impacted and led to significant improvement in infrastructure. 24.20 percent agreed that AMRUT led to the accessibility of basic services, 20.80 percent said that it led to the involvement of the community, 15 percent of the respondents agreed that AMRUT has improved their quality of life, and 12.70 percent of the respondent’s found improvement in Inclusive and citywide sanitation infrastructure and services (Figure 16).
Source: Field Survey
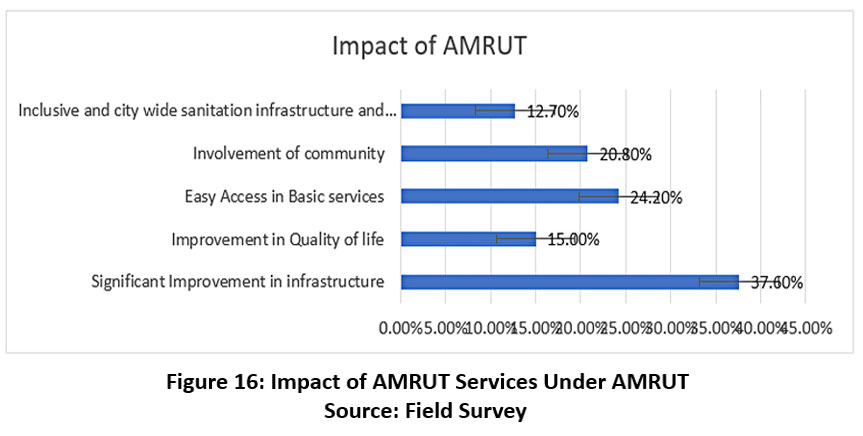 | Figure.16: Impact of AMRUT Services Under AMRUT
|
The respondents were found satisfied with the services provided under the AMRUT Scheme. 92 percent of respondents were satisfied with the services provided under AMRUT which were Pressure of Water supply, Adequacy of water and Flow of water. 91 percent respondents said that they were satisfied with the duration of the water supply provided to them. The satisfaction percentage of respondents for other services like Maintenance of sewerage system (78.30 percent), Quality of water (76.60 percent), and Conservation and Rejuvenation of water bodies (77.90 percent). A slightly lower satisfaction of respondents was seen in online municipal services and maintenance of green parks and green spaces (Table 5).
Table 5: Satisfaction with services under AMRUT
Satisfaction with services under AMRUT | Percentage of Satisfaction with services under AMRUT |
Duration of water supply | 91% |
The pressure of Water supply | 92% |
Adequacy of water | 92.90% |
Flow of water | 92.50% |
Quality of water | 76.60% |
Maintenance of the sewerage system | 78.30% |
Online municipal services | 9.90% |
Maintenance of parks and green spaces | 7.90% |
Conservation and Rejuvenation of water bodies | 77.90% |
Source: Field Survey
Sanitation in India is primarily managed by Urban Local Bodies (ULBs) at the state level, with support from the Ministry of Housing and Urban Affairs (MoHUA) through initiatives like the National Urban Sanitation Policy. Despite efforts, the sector faces challenges due to fragmented institutional responsibilities and issues such as poor sanitation, unsafe drinking water, and inadequate waste disposal, which contribute to public health problems like high infant mortality. The concept of sanitation has broadened to include solid and liquid waste management, food hygiene, and environmental cleanliness. The Atal Mission for Rejuvenation and Urban Transformation (AMRUT), launched during the 12th Five Year Plan, aims to enhance urban infrastructure and civic services in 500 cities, focusing on water supply, sewerage, and urban transport. AMRUT has improved basic infrastructure, strengthened ULBs, and emphasized the importance of septage and faecal sludge management, aligning with national goals to enhance quality of life, especially for disadvantaged populations.25
The regression analysis was conducted to assess the relationship between the predictor variables and the outcome variable. The R-value was found to be 0.878, indicating a strong positive correlation between the variables. The R Square value of 0.771 suggests that approximately 77.1 percent of the variance in the outcome variable can be explained by the predictor variables. The Adjusted R Square value of 0.769 takes into account the number of predictors in the model and indicates that the model still explains a substantial portion of the variance. The Standard Error of the Estimate is 3.38240, indicating the average distance that the observed values fall from the regression line. The ANOVA results suggest that the regression model explains a significant portion of the variation in the dependent variable (Table 6 and table 7).
Table 6: AMRUT Scheme
Model Summary
R | R Square | Adjusted R Square | Std. Error of the Estimate |
0.878a | 0.771 | 0.769 | 3.38240 |
Table 7: ANOVA table
Sum of Squares | df | Mean Square | F | |
Regression | 17745.511 | 4 | 4436.378 | 387.774** |
Residual | 5274.131 | 461 | 11.441 | |
Total | 23019.642 | 465 |
** value indicated that significant at 1% level of significance
Source: Field Survey
The regression analysis reveals significant relationships between various factors and the dependent variable. The constant term is 83.164, with a highly significant t-value of 40.731. Among the predictor variables, responses about the water supply facility have a negative impact, with a coefficient of -0.133 and a significant t-value of -4.150. Similarly, responses about the toilets, sewerage, and septage facility show a negative relationship, with a coefficient of -0.049 and a t-value of -2.470, significant at the 5% level. In contrast, responses regarding solid waste management have a strong positive effect, with a coefficient of 1.830 and a highly significant t-value of 13.982. Finally, responses related to parks and green spaces show a significant negative impact, with a coefficient of -0.945 and a t-value of -31.714, indicating that these factors are inversely related to the dependent variable (Table 8).
Table 8: Parameters of Responses
Factors | Coefficients | Std. The error of the coefficient | “t” value |
Constant | 83.164 | 2.042 | 40.731** |
Responses scores about Water Supply facility | -0.133 | 0.032 | 4.150** |
Responses score about Toilets, Sewerage and Septage facility | -0.049 | 0.020 | 2.470* |
Responses scores about Solid Wastes Management facility | 1.830 | 0.131 | 13.982** |
Responses scores about Park and Green Spaces facility | -0.945 | 0.030 | 31.714** |
** value indicated that significant at 1% level of significance
* value indicated that significance at a 5% level of significance
Source: Field Survey
A moderate to high positive correlation between the independent and dependent variables is shown by the regression analysis's R-value of 0.740. With a R Square value of 0.547, the independent variables in the model may account for around 54.7% of the variance in the dependent variable. The number of predictors in the model is taken into consideration by the Adjusted R Square value of 0.538, which modifies the R Square value somewhat. The degree of uncertainty in predicting the dependent variable is indicated by the Standard uncertainty of the Estimate, which is 4.78130 and calculates the average distance between the observed values and the regression line (Table 9).
Table 9: Socio-economics Factors Affecting the Responses of Rate the Overall Impact of the AMRUT Scheme
Model Summary
R | R Square | Adjusted R Square | Std. Error of the Estimate |
0.740 | 0.547 | 0.538 | 4.78130 |
The F-statistic tests whether the independent variables as a group significantly explain the variation in the dependent variable. Since the F-value is 61.216 and it is statistically significant (p < 0.01), it indicates that the overall regression model is statistically significant, meaning the independent variables together explain a significant portion of the variance in the dependent variable.
Table 10: ANOVA Table
Source of Variation | Sum of Squares | df | Mean Square | F |
Regression | 12595.111 | 9 | 1399.457 | 61.216** |
Residual | 10424.531 | 456 | 22.861 | |
Total | 23019.642 | 465 |
** value indicated that significant at 1% level of significance
Source: Field Survey
The regression analysis reveals several significant factors influencing the dependent variable. The constant is highly significant, indicating a strong intercept. The age of respondents has a negative but significant impact, suggesting that as age increases, the dependent variable decreases. Religion of the respondent also has a significant negative effect, while educational level similarly shows a negative relationship, with higher education corresponding to a lower dependent variable. The type of family respondents belongs to has a significant positive effect, indicating that those from joint or nuclear families are likely to report a higher dependent variable. Ownership of a house is negatively significant, meaning that those who own their homes tend to have a lower dependent variable. The location of the house has a very strong negative impact, suggesting that location is a key factor in determining the dependent variable. Other factors such as social class, occupation, and type of house do not show a significant effect, as their t-values are not statistically significant. This analysis highlights that factors such as age, religion, educational level, family type, house ownership, and location of residence play a crucial role in shaping the outcome, while social class, occupation, and house type have limited influence (Table 11).
Table 11: Parameters of Responses
Factors | Coefficients | Std. Error | “t” value |
Constant | 92.656 | 3.233 | 28.661** |
Age of Respondents | -0.455 | 0.219 | 2.080* |
Social Class/ Category | 0.103 | 0.278 | 0.372 |
Religion of Respondent | -2.491 | 0.523 | 4.765** |
Educational Level | -0.423 | 0.135 | 3.140** |
Occupation of Respondent | -0.070 | 0.050 | 1.391 |
Type of Family of Respondents | 1.397 | 0.483 | 2.890** |
Type of Ownership of House | -1.097 | 0.371 | 2.955** |
Location of House | -6.231 | 0.321 | 19.437** |
Type of House | -1.642 | 1.364 | 1.204 |
** value indicated that significant at 1% level of significance
* value indicated that significance at a 5% level of significance
Source: Field Survey
Policy Recommendations
Effective water resources management in India requires the establishment of the National Bureau of Water Use Efficiency (NBWUE) as a central authority, despite challenges due to water being a state subject. State-level councils should be formed to promote water conservation in metropolitan areas, with collaboration among agencies and groups involved in water provision and resource preservation.19
To address last-mile connectivity issues in urban poor areas, the government under AMRUT should allocate more funding to slums and vulnerable regions, offering subsidies or incentives for individual water connections, similar to the Swachh Bharat Mission.26
Illegal water connections are a significant barrier to coverage, and authorities must conduct drives to legalize them, ensuring city-wide coverage. Online systems for water connections should be implemented to streamline the process, supported by awareness campaigns.
Rainwater harvesting (RWH) is crucial for sustainable water management, and municipal corporations should mandate RWH structures in all buildings, with public awareness campaigns to promote their adoption.27
Wastewater reuse and recycling are essential, requiring coordination among stakeholders, technological advancements, and data monitoring to ensure sustainable solutions. Inclusive sanitation infrastructure, including public restrooms and faecal sludge treatment plants, must be developed, particularly in slums and underdeveloped areas.27
Private sludge operators should be integrated into the design and operation of desludging facilities, with ULBs regulating the system and ensuring the safety of sanitation workers.
Public-private partnerships and user fees for sanitation services are vital for maintaining infrastructure and promoting behavioural change. Community septic tanks and strategically located public toilets are necessary to improve urban living conditions and reduce open defecation.28
ULBs must enhance their capacity for septic tank management, conduct surveys, and develop business models involving various stakeholders for sustainable sanitation solutions.
Regular training and capacity-building programs for sanitation workers are essential, along with the installation of community septic tanks in densely populated areas. Information kiosks at ULB levels can improve service delivery, and NGOs should be involved in beneficiary identification and awareness campaigns.
Addressing the disconnect between infrastructure and services, promoting public-private partnerships, and ensuring affordability are key to improving sanitation practices and urban living conditions.28
Conclusion
Rapid urbanization and population growth, particularly in countries like India, have placed significant strain on urban infrastructure and services, leading to a decline in the quality of essential services such as housing, transportation, healthcare, water supply, sanitation, and education. Despite cities being vital to economic growth and GDP contributions, the surge in demand has created both challenges and opportunities for improving basic services. Addressing these issues is a key development priority, with a focus on enhancing the quality of life, especially for the poor and marginalized. Past initiatives emphasize the importance of infrastructure projects that directly address critical needs, such as access to clean water and sanitation. The Atal Mission for Rejuvenation and Urban Transformation (AMRUT), launched by India's Ministry of Urban Development, aims to build essential infrastructure in 500 cities, including water supply, sewerage networks, storm-water drainage, transportation, and green spaces. Extended until 2025-26 as AMRUT 2.0, the mission has already improved living conditions through better infrastructure and services. To further strengthen AMRUT 2.0 and ensure sustainable urban development, policy measures and suggestions have been proposed across various sectors, aiming to create healthier, more comfortable living environments and support long-term urban growth.
This study establishes that AMRUT has significantly improved urban water and sanitation infrastructure in Uttar Pradesh. With measurable gains in water supply coverage, sewerage network expansion, and beneficiary satisfaction, the mission showcases a scalable model for integrated water resource management. The analysis reveals a strong correlation between infrastructure development and service satisfaction, underlining the scheme's operational effectiveness. These findings serve as a foundation for AMRUT 2.0, recommending a targeted focus on underperforming regions, enhanced funding for septage management, and integration of IoT-based monitoring. The framework and results can be replicated across other states to promote equitable and sustainable urban water governance.
Acknowledgement
We sincerely acknowledge to the concerned officials of Indian Council of Social Science Research (ICSSR), the Ministry of Education, Government of India for entrusting the present study to us and providing the necessary financial support. We are thankful to Shri P. K. Srivastava, Additional Director, and Mission Director (AMRUT), Directorate of Urban Local Governments, Government of Uttar Pradesh, Lucknow for providing the desired information/data to enrich the quality of the study. We wish to acknowledge the contribution of the Research Team comprising for taking pains to complete the research tasks within the stipulated time.
Funding Sources
Indian Council of Social Science Research (ICSSR), Ministry of Education, Government of India for entrusting the present study with wide letter F.No. 160/CIS-2023-2679/AMRUT/SCD dated September 29,2023 to us and providing financial support.
Conflict of Interest
The authors do not have any conflict of interest.
Ethics Statement
This research did not involve human participants, animal subjects, or any material that requires ethical approval.
Informed Consent Statement
The informed consent was obtained for The Primary Data Collection from the questionnaires of the officials and household surveys.
Data Availability Statement
The manuscript incorporates all datasets produced or examined throughout this research study.
Author Contributions
Awadhesh Kumar Singh: Overall Project Direction, Supervision, Monitoring, Visualization and Project Administration.
Manoj Kumar Sharma: Application of relevant statistical tools for drawing out inferences, results and overall impact assessment of AMRUT Mission.
Priyansha Singh: Data Collection, Field Survey, Analysis of secondary data and review of pertinent literature, assisting in drafting of report.
References
- Ackerman JM. Human rights and social accountability: participation and civic engagement. Social Development Dept., Environmentally and Socially Sustainable Development Network, World Bank; 2005.
- Ministry of Housing and Urban Affairs (MoHUA). (2023). AMRUT 2.0 Dashboard Reports.
- CPCB. Status of water supply, wastewater generation and treatment in Class-I cities & Class-II towns of India. New Delhi: Central Pollution Control Board; 2009.
- Wankhade, K. (2022). Urban Water Supply in Post-AMRUT India. Environment & Urbanization Asia.
- WaterAid (2021). Urban Water Crisis in Indian Cities. Retrieved from www.wateraid.org.
- Wankhade K, et al. Urban water supply and sanitation in India. Indian Institute for Human Settlements; 2014.
CrossRef - Verisk Maplecroft. Chennai is the tip of the iceberg for India’s water-stressed cities. 2019. https://www.maplecroft.com/insights/analysis/chennai-is-the-tip-of-the-iceberg-for-indias-water-stressed-cities/.
- Government of India. Handbook on accessible household sanitation for persons with disabilities (PwDs). Ministry of Drinking Water & Sanitation, Swachh Bharat Mission (Gramin). New Delhi: Government of India; 2015.
- Desai D. Quality of water in India's state capitals. ORF; 2019.
- NIUA. Status of water supply, sanitation and solid waste management in urban areas. New Delhi: National Institute of Urban Affairs; 2005.
- Water Aid, WSUP, UNICEF. Female-friendly public and community toilets: a guide for planners and decision-makers. Water Aid, WSUP, UNICEF; 2018.
- Awasthi A, et al. Environmental changes in India. Madhav Books Pvt. Ltd.; 2018.
- Unit level data & Report on NSS 76th Round for Schedule 1.2, July-December, 2018 (Drinking Water, Sanitation, Hygiene and Housing Condition)- https://www.mospi.gov.in/unit-level-data-report-nss-76th-round-schedule-12-july-december-2018-drinking-water-sanitation
- Mishra DS. Sustainable sanitation in the cities. Yojana. January 2020.
- Mishra DS. Sanitation revolution: cleaning urban India. Yojana. November 2018.
- MoHUA. Operational guidelines for individual capacity building. MoHUA, Government of India. New Delhi; 2016.
- Wankhade K. Urban sanitation in India: key shifts in the national policy frame. Environment & Urbanization. 2015;27(2). Sage Publications.
CrossRef - Gangwar SK. Sanitation economy and dignity of the sanitation workers. Yojana. November 2019.
- Ahluwalia IJ. Report on Indian urban infrastructure and services. Government of India; 2011. https://icrier.org/pdf/FinalReport-hpec.pdf.
- Wankhade K, et al. Urban water supply and sanitation in India. Indian Institute for Human Settlements; 2014.
CrossRef - Ministry of Housing and Urban Affairs (MoHUA). (2023). AMRUT 2.0 Dashboard Reports.
- Regional Centre for Urban and Environmental Studies, Lucknow from SAAP Report, Uttar Pradesh- https://localbodies.up.nic.in/ DLBGO/STATE%20ANNUAL %20ACTION%20PLAN%202016-17%20(UP)%20UNDER%20AMRUT.pdf. Permission granted from: Directorate 0f Urban Local Bodies, Government of Uttar Pradesh
- World Bank (2023). State of Urban Infrastructure in South Asia.
- NITI Aayog (2022). Progress and Challenges in India’s Urban Sanitation.
- SCBP. Training module on integrated wastewater management and septage. Sanitation Capacity Building Programme, NIUA, New Delhi and Eco-San Foundation, Pune; 2017.
- IIHS. Urban water supply and sanitation in India. IIHS RF Paper on Water Supply and Sanitation; 2014.
- WaterAid. Technical brief: urban pit waste management. WaterAid; 2013. Accessed from www.wateraid.org/~/media/Publications/Urban-pit-waste-management.ashx.
- United Nations. Towards participatory and transparent governance: reinventing government. United Nations; 2007.


