Seasonal and Diurnal Patterns of Air Pollutants in Faridabad: A 2024 Urban Air Quality Assessment
Prashant Ravish
*
 and Urvashi Kashyap
1
Institute of Environmental Studies,
Kurukshetra University,
Kurukshetra,
Haryana
India
http://dx.doi.org/10.12944/CWE.20.2.8
Copy the following to cite this article:
Ravish P, Kashyap U. Seasonal and Diurnal Patterns of Air Pollutants in Faridabad: A 2024 Urban Air Quality Assessment. Curr World Environ 2025;20(2). DOI:http://dx.doi.org/10.12944/CWE.20.2.8
Copy the following to cite this URL:
Ravish P, Kashyap U. Seasonal and Diurnal Patterns of Air Pollutants in Faridabad: A 2024 Urban Air Quality Assessment.Curr World Environ 2025;20(2).
Download article (pdf)
Citation Manager
Publish History

Introduction
Air pollution has become a major public health and environmental issue in many urban centers across India, notably places such as Faridabad. Studies have repeatedly shown that air pollutants, including PM2.5, NOx, SO2, and CO, severely harm both human health and ecological systems. Different studies across northern India confirmed consistent elevations in these pollutants, especially during the winter and postmonsoon seasons, due to meteorological inversions and stagnant air conditions.1–3 Faridabad, within the NCR, ranks among India’s most polluted cities because of its combination of substantial urban pollutants and considerable particulate matter from agricultural sources, particularly from crop residue burning.4,5 Seasonal dynamics play a critical role, with pollutant levels peaking in the postharvest burning months and winter, a trend validated in local investigations.6 The dual impact of anthropogenic emissions.1–3,7 and meteorological constraints further exacerbates the air quality challenges faced by the region.8
Pollutants in Faridabad exhibit daily changes in concentration, with recognizable diurnal peaks typically coinciding with traffic hours and industrial activities. These fluctuations are significantly influenced by meteorological factors, such as temperature inversions and wind patterns, and are further exacerbated by crop residue burning (CRB) during the postmonsoon season.8 Despite numerous studies focusing on annual or seasonal air quality variation, there remains a marked research gap in the examination of hourly pollutant dynamics, an essential element for refining air quality forecasts and interventions. Recent studies underscore the importance of high-resolution temporal monitoring in understanding pollution dynamics across NCR cities such as Faridabad. For example, Prakriti8 conducted a diurnal and seasonal air quality analysis over the Delhi NCR, revealing that PM2.5 and NOx concentrations peak during early morning and late evening hours and are strongly influenced by traffic and stable boundary layers during winter. Their work confirmed that ozone (O3) peaks in the afternoon due to photochemical reactions involving NO2 and VOCs under intense solar radiation, with titration suppressing O3 during morning rush hours. Similarly, Kaushik9 highlighted that ozone formation is VOC dependent in the NCR region, with the NOx concentration significantly impacting its temporal distribution. Furthermore, a 2023 study by Masood10 applied machine learning to model PM2.5 fluctuations across Delhi, confirming the diurnal pollution cycle and the predictive value of meteorological parameters such as wind speed and temperature inversions. These studies collectively validate the need for hourly resolution assessments, as pursued in the current study, to inform actionable mitigation aligned with both WHO guidelines and NAAQS benchmarks. While hourly PM2.5 and NOx concentrations have been linked to peak commuting times and temperature-driven inversion layers, integrated studies capturing daily variation across all seasons remain scarce in cities such as Faridabad.11
Faridabad's pollution profile is shaped not only by local urban emissions but also by regional contributions from CRB in Haryana and Punjab. These emissions, which exhibit strong diurnal and seasonal variations, have been studied in the context of their downwind effects on urban centers.12 A recent source-attribution study traced carbon monoxide emissions directly to cropland fires, showing daily spikes consistent with burning practices.13 However, many of these efforts focus on monthly averages, neglecting hour-by-hour resolutions that could guide actionable mitigation strategies. Ultimately, effective policy design requires an understanding of how urban emissions, crop burning, and meteorological dynamics interact over daily timescales. Without this, efforts to reduce human exposure remain generalized and less effective. Advancing this research is critical for tailoring pollution control measures to match both diurnal activity patterns and seasonal environmental conditions in rapidly urbanizing areas such as Faridabad.
This study suggests that the daily patterns of pollutants in Faridabad are shaped by a synchronous interplay between urban emissions, agricultural residue burning, and meteorological conditions. Research has demonstrated that postmonsoon crop burning in Punjab and Haryana significantly elevates the levels of PM2.5, NOx, and CO in downwind cities such as Faridabad, particularly during winter inversion events that trap pollutants close to the ground.12,13 The planned investigation of hour-by-hour pollutant trends across seasons, especially in the winter and post monsoon periods, targets an underexplored temporal scale essential for adaptive policy design. While several studies have analyzed seasonal air quality patterns in the Delhi NCR, few have offered high-resolution, hourly assessments for rapidly urbanizing cities such as Faridabad.1,5,6,11,12 Existing work has largely relied on daily or monthly averages, overlooking intraday dynamics that are critical for exposure forecasting and policy targeting. This study addresses that gap by analyzing hourly pollutant data from 2024, capturing diurnal peaks and seasonal fluctuations across six major air pollutants. The incorporation of real-time monitoring data, seasonal meteorology, and pollutant interrelationships provides a detailed temporal profile of urban air pollution, which is rarely documented at this resolution in Tier-II Indian cities. The key contribution of this study lies in its integrated analysis of hourly pollutant variation, source indicative ratios (PM2.5/PM10), and inter-pollutant correlations, contextualized within both the Indian NAAQS standards and the WHO (2021) standards. This approach not only reveals pollutant exceedances but also reveals how temporal emission patterns and meteorological dynamics interact to shape air quality. The use of high-frequency data enables the identification of health-critical time windows, such as morning traffic and winter evenings, offering actionable insights for time-sensitive regulatory strategies in Faridabad and similar urban regions.
This study aims to generate insight into diurnal and seasonal air pollution variability, which will inform the development of dynamic air quality management strategies. These factors would account for transient peaks in pollutant concentrations, thereby offering more effective exposure mitigation than annual averages or seasonal aggregates typically used in policymaking.13 A detailed assessment of daily changes in pollutants such as PM2.5 and NOx, which are shaped by vehicular traffic, crop residue combustion, and surface weather patterns, has thus far been limited, especially in highly polluted Tier-II cities such as Faridabad.11,14 Ultimately, this study will close critical data gaps by mapping how pollutants fluctuate daily under varying seasonal contexts. The findings will enhance public health outcomes by supporting time-specific control policies aimed at minimizing exposure during daily peak hours. Such interventions are increasingly vital not only for Faridabad but also for urban areas across India and other regions confronting similar pollution burdens.
Materials and Methods
This study investigates how patterns of air pollution manifest differently across various times of the day and across the four seasons in Faridabad. Secondary data from air quality monitoring stations, meteorological information, and satellite images of agricultural fires were analyzed to assess variations in air quality over a range of hours and seasons.
Study Area
Faridabad, a part of southeast Haryana, India, is a fast-developing metropolis in the northern Indian state of Haryana and is a part of the National Capital Region as shown in Figure 1. It is located strategically along NH 48 and is located between Delhi to the north, Gurugram to the west, and Uttar Pradesh to the east, possessing a 742.90 square kilometer area. The population of the district is 79.5% urban due to industrialization and its proximity to Delhi. The city also suffers from motor vehicle exhaust, industrial emissions, and the combustion of postharvest agricultural leftovers, which are particular sources of air pollution. Faridabad is one of several Indian cities suffering from suboptimal air quality: it experiences hot summers, cool winters, and a monsoon season, with atmospheric conditions, including temperature inversions and low wind movement, that aggravate pollution during the winter and postmonsoon periods.5,9 The industrial base, which includes major sectors of automobile manufacturing, textiles, and engineering, emits a wide array of pollutants, including NOx, PM2.5, CO, and VOCs, which severely affect air quality. The nearby Yamuna River and its floodplains, which drive local soil and water retention, also feed into agricultural runoff and burn, exacerbating pollution levels. In addition, building work and road dust are likely to be consistent genera of particulate emissions. Although development of the city is taking place at a fast pace, the transportation infrastructure is not improving correspondingly, thus leading to chaos on the roads, which are seen getting further torturous due to a rise in the number of vehicles and incessant air pollution, especially during rush hour.
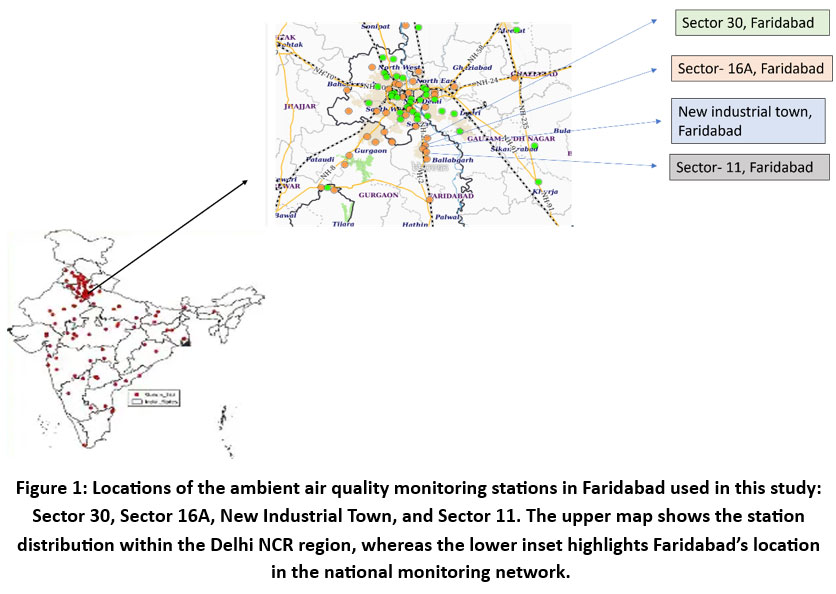 | Figure 1: Locations of the ambient air quality monitoring stations in Faridabad used in this study: Sector 30, Sector 16A, New Industrial Town, and Sector 11. The upper map shows the station distribution within the Delhi NCR region, whereas the lower inset highlights Faridabad’s location in the national monitoring network.
|
Data collection
This study utilized a comprehensive set of data from multiple sources to analyze air quality patterns in Faridabad. Hourly concentrations of key pollutants, PM2.5, PM10, NOx, SO2, CO, and O3, were obtained from air quality monitoring stations managed by the Central Pollution Control Board (CPCB). This study utilized hourly air quality data for six pollutants, PM2.5, PM10, NO2, SO2, CO, and O3, from four continuous ambient air quality monitoring stations (CAAQMS) in Faridabad: Sector 30, Sector 11, Sector 16A, and the new industrial town, as maintained by the Haryana State Pollution Control Board (HSPCB) and reported via the CPCB portal. Instead of relying on a single station, the analysis was based on the citywide hourly average computed from all available stations. This approach minimizes spatial bias and provides a more holistic representation of air quality conditions across Faridabad. Sector-wise differences were minor, with Sector 30 and Sector 11 consistently reporting higher PM10 and PM2.5 concentrations. However, using an integrated average across stations ensures that intracity variation is reflected while still enabling high-resolution diurnal and seasonal analysis. Data for the year 2024 were analyzed across all four seasons to capture seasonal variations and trends in pollutant levels. Additionally, the CPCB database provides data from the Continuous Ambient Air Quality Monitoring System (CAAQMS) stationed in the Yamunanagar district.27 The real-time air quality data from this system were cross-referenced with historical pollution trends to ensure consistency with prior studies. The open-source data were further validated by incorporating quality control measures as outlined by the CPCB guidelines, which helped to increase the accuracy and reliability of the findings.
PM2.5 and PM10 were monitored via a filter-based gravimetric technique and light scattering instruments. NOx was measured via chemiluminescence, SO2 was measured via fluorescence, CO was measured via the NDIR detector, and ozone (O3) was measured via the UV absorption method according to the CPCB methods. Interpolation methods were used to accommodate missing data. Although such differences in measurement setup and ambient conditions might lead to some errors, the CPCB quality control procedure has limited them. Moreover, satellite remote sensing data on the burning of agricultural residue were utilized, but cloudiness and other disturbances sometimes restricted coverage. Meteorological data such as temperature, humidity, wind speed, and atmospheric pressure data were also collected from the Indian Meteorological Department (IMD), in addition to air quality data. These climatic conditions are of primary interest for ascertaining their impact on the prevalence of dispersion and accumulation of pollutants in the area.
Seasonal and Daily Characterization
The seasonal groups in Faridabad were in accordance with the specific monsoons that the region experiences. The city has summer (March to June), monsoon (July to September), postmonsoon (October, November), and winter (December to February) seasons. The seasonal groups in Faridabad were classified as summer (March–June), monsoon (July–September), postmonsoon (October–November), and winter (December–February), following the climatological norms of the Indian Meteorological Department (IMD). These divisions reflect distinct meteorological regimes that significantly affect pollutant dispersion and accumulation patterns in northern India.
These seasons play a major role in determining the quality of the air, as climatic factors such as fluctuations in temperature, humidity,precipitation, and agricultural burning in the postmonsoon and winter months all contribute to increasing pollution levels. Ozone is a photochemical gas; hence, warm summer temperatures and strong solar radiation increase these photochemical processes. The particulate pollution also decreases during the monsoon season due to rain, which washes down the pollution and results in better atmospheric dispersion. However, the adjoining regions face agricultural residue burning in both the postmonsoon season and the Winter season, which results in an increase in the emission of pollutants.
The levels of pollutants were assessed at three times of the day: morning (6:00 AM - 10:00 AM), afternoon (12:00 PM - 4:00 PM), and evening (6:00 PM - 10:00 PM). These time windows were chosen on the basis of prevailing traffic schedules, human activity patterns, and daily meteorological cycles in northern India. The morning period (6:00 AM -10:00 AM) corresponds with commuting hours and thermal inversion events; the afternoon (12:00 PM - 4:00 PM) corresponds to maximum solar radiation and vertical mixing; and the evening (6:00 PM -10:00 PM) captures a second traffic peak and the onset of nighttime cooling, which typically reduces dispersion. This categorization could be used to compare the average concentration of pollutants during the grouped hours of the day to evaluate the daily variation in air pollution. The morning time of the day usually has elevated pollutant levels due to traffic and industrial activities, and pollutants are trapped in a stable atmosphere. In the afternoon, when the atmosphere is more unstable, due to increased solar radiation, which enhances vertical mixing and causes dispersion of pollutants, O3 levels diminish. In the evening, there is another peak in pollution levels as the wind speed decreases, traffic emissions increase, and home heating is switched on. The investigation of these diurnal phases can aid in the determination of the periods of the day that experience the highest pollution levels and can be targeted for interventions to alleviate peak pollution.
Statistical analysis
Data were collected on an hourly basis, and the concentrations of pollutants were averaged across the diurnal periods and for the entire administrative year. To analyze the data, several statistical measures were applied, including the calculation of the mean, median, and standard deviation, to capture the overall pattern and variation in pollutant levels. Statistical tests were performed to assess the significance of differences (ANOVAs) between pollutant concentrations across different diurnal segments and seasons. Pearson correlation was used to examine how pollutant concentrations correlated with meteorological factors, helping to identify key factors influencing air quality. Pearson correlation was selected because of its ability to quantify linear relationships between continuous variables such as pollutant concentrations and meteorological factors. Although alternatives such as Spearman rank correlation could capture nonlinear trends, preliminary analysis revealed that most of the inter-pollutant relationships in this dataset were approximately linear. Future work may explore nonlinear models or machine learning methods for more complex associations.3,6,11 The PM2.5/PM10 ratio was used as an indicator of pollution source characteristics. Ratios above 0.5 typically suggest dominant contributions from combustion sources such as vehicular exhaust and biomass burning, whereas lower ratios indicate greater influence from coarse particles such as road dust or construction emissions. This ratio helps infer temporal source dominance across seasons and time periods.
QC/QA and Data Validation
To ensure the accuracy and reliability of the data, quality assurance (QA) and quality control (QC) measures were implemented throughout the research process. The air quality data were cross-verified with secondary sources to confirm their consistency. Any missing or inconsistent data points were addressed via interpolation methods to maintain continuity and avoid data gaps. On average, less than 5% of the hourly data were missing across all pollutants. Missing values were filled via linear interpolation for short gaps (under 3 hours), following the CPCB-recommended quality control guidelines. Longer data gaps were flagged and excluded from correlation or time series analysis to preserve statistical integrity. These QC/QA procedures ensured that the data were accurate, reliable, and truly reflective of the prevailing atmospheric conditions in Faridabad.
Results
The air pollutant analysis for Faridabad revealed significant variation in pollutant levels seasonally and diurnally, as shown in Table 1 and Figure 2.
Seasonal and diurnal variations in PM2.5
The analysis of the PM2.5 concentrations in Faridabad revealed significant seasonal and diurnal variations, as shown in Table 1 and Figure 2, reflecting the combined impact of emission sources and meteorological factors. The highest PM2.5 concentrations were consistently observed in the winter and postmonsoon seasons, and the monsoon season had the lowest levels because of the frequent precipitation and enhanced atmospheric transport. During winter, PM2.5 had an hourly average of 171.85 µg/m³ and decreased to 101.74 µg/m³, accounting for 68.9% of the intraday fluctuations. In the postmonsoon season, it varied between 50.92 µg/m³ and 114.73 µg/m³, with 125.3% being the maximum daily percentage variation for all seasons. The summer season presented moderately elevated values, with concentrations ranging from 108.35 µg/m³ to 168.48 µg/m³, indicating a 55.5% difference. The monsoon season resulted in the cleanest air, with PM2.5 levels ranging between 29.93 µg/m³ and 58.53 µg/m³; however, a notable 95.6% variation was detected within a day. These differences affirm that meteorological stability and external regional influences, particularly agricultural residue burning during the postmonsoon season, significantly exacerbate particulate pollution in Faridabad.
The PM2.5 concentrations in Faridabad exhibited a distinct bimodal diurnal pattern across all the seasons. The morning peak, observed between 6:00 AM and 10:00 AM, was driven primarily by vehicular emissions during rush hour, industrial startup activities, and the formation of shallow atmospheric boundary layers. During the afternoon, between 12:00 PM and 4:00 PM, the PM2.5 level decreased, which was attributed to increased solar radiation and the expansion of the boundary layer, which facilitated the vertical dispersion of pollutants. The evening peak, from 6:00 PM to 10:00 PM, resulted in an increase in PM2.5 levels, driven by increased vehicular traffic, domestic cooking activities, and reduced wind speeds, which hindered the dispersion of pollutants. The sharpest reduction from morning to afternoon was recorded in the postmonsoon season, with a decrease of over 63.8 µg/m³, reflecting dynamic atmospheric conditions. In contrast, winter evenings sustained high pollutant levels due to persistent temperature inversions and minimal wind movement, which trapped pollutants close to the ground. The postmonsoon season, despite not having the highest absolute peak, presented the greatest relative intraday change, suggesting a strong influence of short-term emissions (e.g., stubble burning) and dynamic boundary layer behavior. The temporal peaks in PM2.5 align closely with human activity patterns and meteorological stagnation events. During the winter and postmonsoon seasons, the combination of low temperature, high humidity, and weak winds led to reduced vertical mixing and significant pollutant entrapment near the surface. Additionally, the postmonsoon period coincided with intensive agricultural residue burning in neighboring Punjab and Haryana. The prevailing northwesterly winds transport fine particulate matter into the NCR, including Faridabad, thereby influencing PM2.5 levels independently of local emissions. This regional phenomenon is supported by previous research that documented increased PM2.5 concentrations on days with confirmed fire counts from satellite imagery.21 The PM2.5 concentrations observed in Faridabad during winter (~172 µg/m³) are comparable to those reported in Delhi (~180–200 µg/m³) during similar periods.6,8,15 Comparable peak levels in Gurugram and Noida also suggest a regional air quality crisis during postharvest burning and inversion-prone months. Internationally, these values are 3–4 times higher than average winter concentrations in polluted cities such as Beijing or Lahore, highlighting the severe nature of particulate pollution in NCR cities.
PM10 concentration patterns
The PM10 concentrations across Faridabad demonstrated strong seasonal and diurnal variability, as shown in Table 1 and Figure 2, which was largely driven by coarse particulate sources such as road dust, construction activity, and industrial emissions. Seasonal analysis revealed that the winter and postmonsoon periods presented the highest PM10 levels, whereas the monsoon period presented the lowest values because of frequent rainfall and greater atmospheric cleansing. In winter, the PM10 concentration ranged from a minimum of 149.13 µg/m³ to a maximum of 271.48 µg/m³, reflecting an 81.99% increase throughout the day. During the postmonsoon season, the concentrations varied from 124.83 to 222.62 µg/m³, resulting in a 78.3% intraday change. In the summer season, the recorded values were between 138.01 and 218.13 µg/m³, with 57.99% fluctuation. The monsoon period displayed the lowest concentration range, with values ranging from 62.62 to 110.00 µg/m³, yet still demonstrated a 75.67% diurnal difference. These variations underscore the role of dry season resuspension of dust and regional transport of particles, particularly from agricultural and industrial activities.8
PM10 followed a bimodal diurnal pattern, similar to that of PM2.5, with elevated concentrations observed during the morning (6:00 AM – 10:00 AM) and evening (6:00 PM – 10:00 PM) across all seasons. These peaks were most pronounced during the winter and postmonsoon seasons and were driven primarily by traffic-induced dust resuspension during peak commuting hours, industrial emissions, and reduced wind speeds coupled with lower atmospheric mixing heights. The afternoon period (12:00 PM – 4:00 PM) consistently resulted in a decrease in concentrations, particularly in the summer and monsoon seasons, as increased solar radiation and vertical dispersion facilitated the dilution of pollutants.
Despite relatively high peak values, summer presented the least intraday fluctuations, suggesting more stable atmospheric conditions, whereas postmonsoon and winter were characterized by highly dynamic air quality profiles. Meteorological conditions significantly influence PM10 behavior. During winter, low wind speeds and frequent inversion layers hinder dispersion, allowing particulates to accumulate near the surface. In the postmonsoon season, high concentrations were partly linked to regional biomass burning and dry soil conditions that increased dust mobility. In contrast, the monsoon season experiences reduced PM10 levels due to wet deposition from rainfall and stronger horizontal wind speeds, both of which improve the air cleansing capacity. Additionally, construction and road dust were identified as key contributors to PM10 spikes, particularly in rapidly developing zones such as Sector 30 and the new industrial town (NIT).
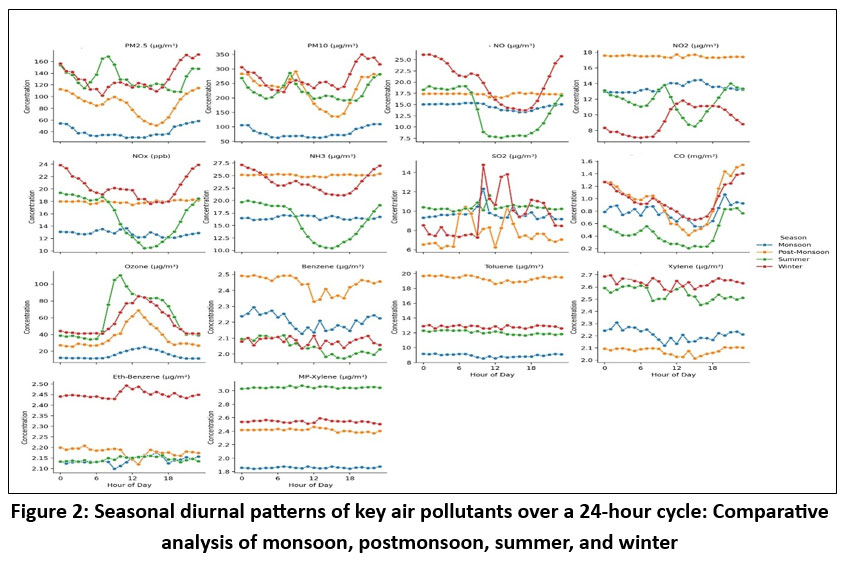 | Figure 2: Seasonal diurnal patterns of key air pollutants over a 24-hour cycle: Comparative analysis of monsoon, postmonsoon, summer, and winter
|
NOx concentration patterns
Nitrogen oxides (NOx), which are primarily emitted from combustion processes such as vehicular traffic and industrial operations, exhibited significant seasonal and diurnal fluctuations in Faridabad, as shown in Table 1 and Figure 2. NOx concentrations were highest during the winter and postmonsoon seasons, reflecting both increased emissions and unfavorable meteorological conditions that hindered dispersion. During the winter, NOx levels ranged from 30.46 ppb to 58.84 ppb, with a substantial 93.2% intraday variation, the highest observed for NOx across all seasons. During the postmonsoon season, the NOx concentration varied between 24.15 ppb and 45.81 ppb, corresponding to an 89.7% fluctuation. The summer levels were moderately elevated, fluctuating between 18.84 ppb and 34.51 ppb, indicating 83.2% variation throughout the day. The monsoon season exhibited the lowest NOx levels overall, with concentrations ranging from 12.64 ppb to 24.79 ppb, but still showed a 96.1% variation due to sharp early morning peaks. Despite the lower absolute concentrations during the monsoon season, the relative change was significant because of the abrupt increase in NOx levels during the early hours of the day.
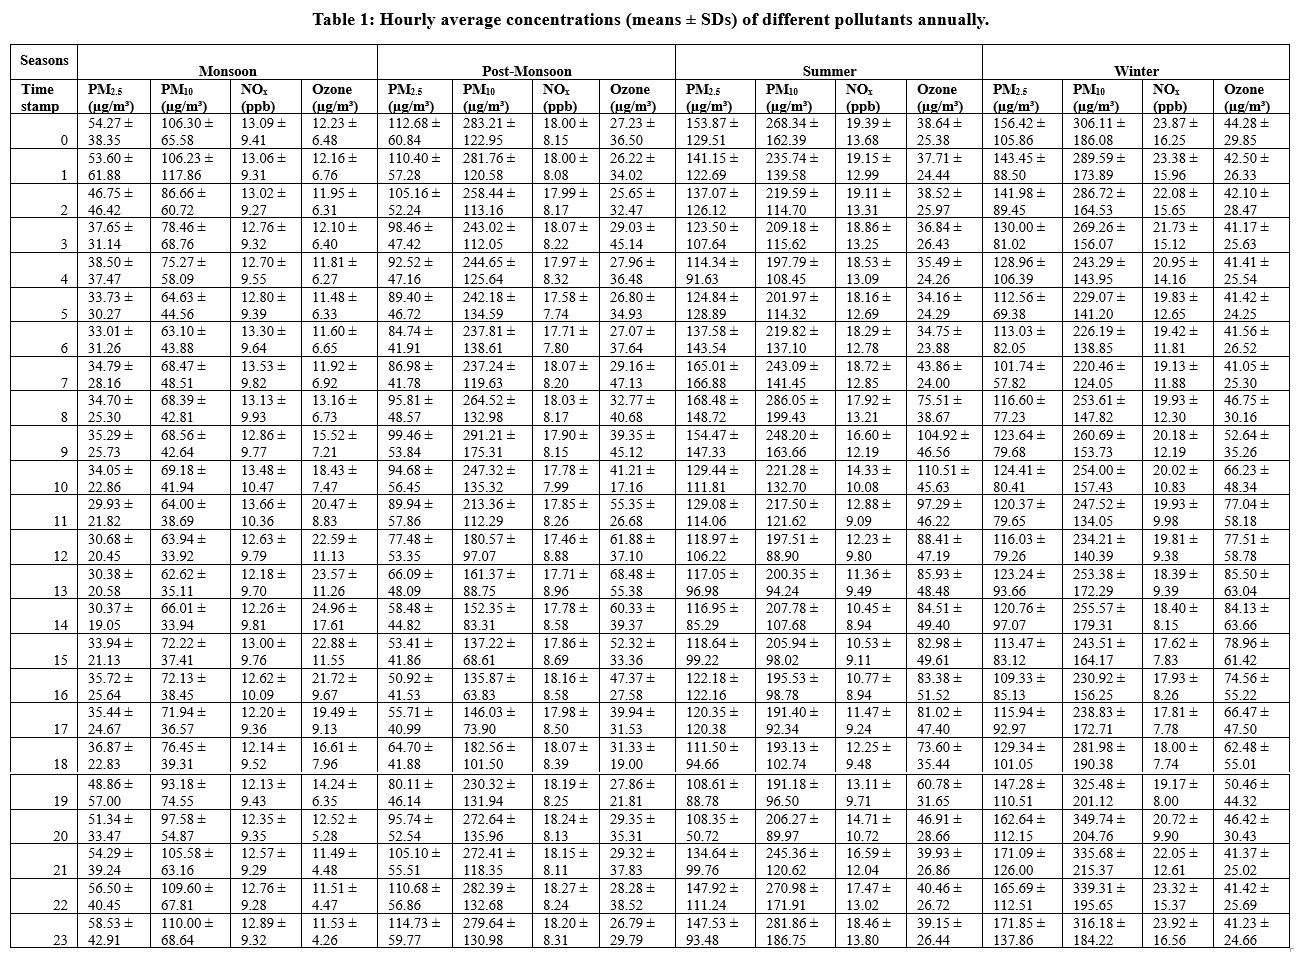 | Table 1: Hourly average concentrations (means ± SDs) of different pollutants annually.
|
NOx followed a distinct bimodal diurnal pattern, with peaks observed during the morning (6:00 AM - 10:00 AM) and evening (6:00 PM - 10:00 PM) commuting hours. This pattern is driven primarily by vehicular emissions during rush hour traffic congestion, as well as combustion from industrial and domestic heating, particularly in the colder months. A noticeable afternoon trough (12:00 PM - 4:00 PM) was observed across all seasons, which was attributed to reduced vehicular activity and increased atmospheric dispersion. During this period, photochemical reactions involving NOx led to its conversion into ozone, especially under intense solar radiation. This midday dip was particularly pronounced in summer because of stronger photolytic activity, which facilitated the breakdown of NOx and contributed to lower concentrations during the afternoon. The winter season presented the highest absolute NOx levels due to limited vertical mixing, whereas the monsoon season presented the sharpest diurnal variation relative to its low baseline, suggesting dynamic shifts in pollutant dispersion.
NOx accumulation is highly sensitive to meteorological conditions. During winter, stable atmospheric conditions, including inversion layers, limit vertical pollutant dispersal, causing emissions from diesel and gasoline engines to persist near ground level. Postmonsoon conditions trap pollutants similarly because of cool, dry air and light winds. In summer, although emission rates remain high, strong solar radiation and convection enhance vertical mixing and accelerate the breakdown of NOx compounds. The monsoon season, characterized by frequent rainfall and high humidity, supports pollutant washout, keeping background NOx levels lower despite ongoing urban activity. The major sources of NOx in Faridabad include urban traffic congestion, diesel-powered generators, and industrial units, which are significant contributors to emissions in the region. Additionally, agricultural burning in surrounding districts, particularly during the postmonsoon season, exacerbates NOx levels, as the regional transport of pollutants from crop residue burning significantly influences air quality in Faridabad.
SO2 concentration patterns
Sulphur dioxide (SO2), a pollutant primarily emitted from the combustion of sulphur-containing fuels, particularly in industrial and power-generating facilities, exhibited moderate yet significant seasonal and diurnal variability across Faridabad, as shown in Table 1 and Figure 2. During the postmonsoon season, the SO2 concentrations ranged from 6.43 µg/m³ to 12.61 µg/m³, showing a substantial 96.1% diurnal variation, the highest among all the seasons. In winter, SO2 levels ranged from 6.87 µg/m³ to 11.80 µg/m³, reflecting a 71.7% increase throughout the day. The summer season fluctuated between 5.91 µg/m³ and 10.10 µg/m³, amounting to a 70.9% difference. The monsoon season had the lowest variation, with concentrations ranging from 5.64 µg/m³ to 9.31 µg/m³, indicating 65.1% variation. While SO2 concentrations stayed below national hourly limits, the observed intraday changes point to active emission sources and the influence of meteorological conditions on pollutant dispersion.
Compared with those of other pollutants such as NOx and PM, the SO2 concentrations followed a gentler diurnal pattern. Moderate peaks were observed during the morning hours (6:00 AM - 10:00 AM), likely due to fuel combustion for heating and the initiation of industrial operations. Smaller spikes were observed in the evening (6:00 PM - 10:00 PM), possibly linked to industrial shift changes and domestic fuel usage. Unlike PM or NOx, SO2 did not sharply decrease in the afternoon, indicating that it is less influenced by photolysis and more stable in ambient air. However, a small midday dip was recorded, likely due to convective mixing and slight dilution from increased solar radiation. The postmonsoon period presented the most dynamic intraday behavior, whereas the winter and summer periods presented consistent patterns of moderate fluctuation. Monsoon levels, although lowest overall, displayed steadier values due to rainfall and wind dispersion. The behavior of SO2 is primarily determined by combustion activities and low atmospheric dispersion during cooler seasons. In winter, calm wind conditions and shallow mixing layers trap SO2 near emission sources, whereas in the postmonsoon season, increased use of fossil fuels for early industrial restarts and stubble burning contribute to elevated concentrations. The key sources of SO2 in Faridabad include industrial clusters that rely on coal or oil-based furnaces, backup diesel generators, and traffic-related fuel combustion, although the latter is a minor contributor compared with industrial sources. During the monsoon season, the lower SO2 concentrations can be attributed to scavenging by rainfall and enhanced atmospheric mixing, both of which facilitate the removal of SO2 from the air. This process helps reduce the pollutant levels, providing some relief from the otherwise higher concentrations observed during the drier seasons.
CO concentration patterns
Carbon monoxide (CO), a colorless and odorless gas primarily emitted from the incomplete combustion of carbon-based fuels, exhibited clear seasonal and diurnal variations across Faridabad, as shown in Table 1 and Figure 2. The concentration of CO closely followed human activity cycles, particularly traffic and domestic fuel usage, and was significantly influenced by meteorological conditions, particularly in winter when atmospheric stagnation was prevalent. During winter, CO levels ranged from 1.32 mg/m³ to 2.29 mg/m³, resulting in 73.5% intraday fluctuations. During the postmonsoon period, the CO concentration fluctuated between 1.04 mg/m³ and 1.83 mg/m³, with a 76.0% variation, whereas during the summer, the CO concentration ranged from 0.91 to 1.56 mg/m³, corresponding to a 71.4% intraday change. The monsoon period had the lowest CO concentration, ranging from 0.69 to 1.22 mg/m³, but still indicated a 76.8% fluctuation throughout the day. Although CO concentrations mostly remained below the 8-hour average permissible limit of 2.0 mg/m³, hourly peaks during winter occasionally exceeded this threshold, posing localized exposure risks.
CO concentrations followed a bimodal diurnal pattern with morning and evening peaks. The morning peak, between 6:00 AM and 10:00 AM, coincided with high vehicular traffic and lower combustion efficiency during cold starts. The evening peak, between 6:00 PM and 10:00 PM, was linked to increased road traffic, cooking activities, and industrial shift transitions. In contrast, the afternoon period, from 12:00 PM to 4:00 PM, showed a noticeable decrease in concentration, reflecting reduced emission intensity and improved atmospheric mixing. The winter morning peak was particularly sharp, likely due to poor dispersion conditions and lower combustion efficiency in colder engines and domestic stoves.
A seasonal comparison of CO concentrations revealed that winter had the highest levels, with the maximum mean value reaching 2.29 mg/m³ and a percentage difference of 73.48%. The postmonsoon concentrations ranged from 1.04 mg/m³ to 1.83 mg/m³, indicating 76.00% variation, whereas the summer levels fluctuated between 0.91 and 1.56 mg/m³, indicating a 71.43% change. The monsoon season recorded the lowest concentrations, varying from 0.69 to 1.22 mg/m³, but still showed 76.81% intraday variation, suggesting the influence of peak emission hours and varying weather conditions.
Meteorological conditions play a significant role in CO behavior. Temperature inversions, low wind speeds, and high humidity during the winter and postmonsoon seasons hinder the vertical dispersion of CO, causing even moderate emissions to result in elevated ground-level concentrations. The primary sources of CO in Faridabad included private vehicle emissions, particularly from two-wheelers and diesel-powered autos; diesel generators used during power shortages; biomass and coal-based domestic cooking and heating; and agricultural residue burning, especially during postmonsoon periods. During the monsoon season, heavy rainfall and strong winds help disperse CO, leading to the lowest seasonal concentrations.
Ozone (O3) concentration patterns
Ozone (O3) is a secondary pollutant formed through photochemical reactions involving nitrogen dioxide (NO2), nitric oxide (NO), and volatile organic compounds (VOCs) under the influence of solar radiation. The O3 concentrations in Faridabad, as shown in Table 1 and Figure 2, were not directly emitted but rather shaped by the availability of NOx precursors and sunlight, leading to distinct seasonal and diurnal variations.
In summer, O3 concentrations ranged from 28.64 µg/m³ to 69.48 µg/m³, exhibiting a 142.6% intraday increase, the highest among all pollutants. During the postmonsoon season, the concentrations ranged from 17.38 µg/m³ to 40.29 µg/m³, representing 131.7% variation, followed by those during the monsoon season, with concentrations ranging from 12.16 µg/m³ to 27.38 µg/m³ (125.2% variation). Winter recorded the lowest range, from 11.53 µg/m³ to 20.38 µg/m³, with a 76.8% fluctuation, reflecting limited photochemical activity. Despite remaining below the 1-hour average national standard of 100 µg/m³, afternoon ozone levels in summer reached moderate health concern thresholds, especially for sensitive groups.
Ozone concentrations displayed a distinct inverse diurnal pattern compared with their precursors (NO, NO2, and NOx). The morning and evening periods (6:00 AM - 10:00 AM and 6:00 PM - 10:00 PM) presented troughs in ozone levels, driven by the "ozone formation" process, where fresh NO emitted by vehicles reacts with ozone, reducing its ambient concentration:
![]()
In contrast, the afternoon peaks (12:00 PM - 4:00 PM) were due to increased photolysis of NO2 under sunlight, resulting in ozone formation through a two-step process:
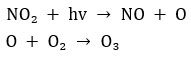
The highest daily ozone concentrations occurred in summer because of intense solar radiation. Conversely, high NOx levels in winter and reduced sunlight suppressed ozone formation. During the summer, ozone concentrations ranged from 28.64 µg/m³ to 69.48 µg/m³, with a 142.6% fluctuation. The postmonsoon levels ranged from 17.38 µg/m³ to 40.29 µg/m³ (131.7% variation). The monsoon season had values between 12.16 µg/m³ and 27.38 µg/m³ (125.2% variation), whereas the winter season had smaller fluctuations, from 11.53 µg/m³ to 20.38 µg/m³, a 76.8% difference. These variations demonstrate the complex interplay between NOx levels and ozone formation processes.
Meteorologically, ozone behavior is influenced by several factors. High temperatures and solar radiation favor ozone formation during the summer and postmonsoon seasons. NOx emissions from vehicular exhaust and industrial activities serve as precursors to ozone but also contribute to its suppression via titration, especially in winter. Monsoon rains help moderate precursor emissions and photochemical activity, maintaining relatively low ozone levels despite regional transport. Given the secondary nature and complex chemistry of ozone, ozone control requires a multipronged approach. This should include targeted reduction of VOC emissions from sources such as solvents, paints, and fuels, particularly during summer. Furthermore, balanced NOx control is essential to prevent unintentional ozone spikes in low-VOC environments. Real-time ozone advisories during summer afternoon and the promotion of urban greenery can also help lower ozone concentrations through deposition and VOC uptake. Ozone management in Faridabad should be integrated into a regional photochemical smog control framework, taking into account transboundary precursor transport, solar intensity, and urban emissions. Such an approach will help mitigate ozone's negative health impacts, particularly on vulnerable populations such as children and individuals with respiratory conditions.
Volatile organic compounds (VOCs) and other pollutants
The analysis of volatile organic compounds (VOCs), including benzene, toluene, xylene, ethylbenzene, and MP-xylene, and ammonia (NH3) revealed substantial seasonal differences in ambient concentrations across Faridabad, as shown in Table 1 and Figure 2. These pollutants are emitted primarily from vehicular exhaust, industrial emissions, fuel evaporation, and waste decomposition, and they play crucial roles in the formation of secondary pollutants, such as ozone and particulate matter. The ammonia concentrations were highest during the postmonsoon (25.09 µg/m³) and winter (23.73 µg/m³) seasons. The peak hourly concentration was observed in winter (27.15 µg/m³), which was attributed to limited atmospheric dispersion and increased volatilization from urban and peri-urban waste sources. The summer concentrations were lower, with an average of 15.69 µg/m³ and a broader intraday range (10.47 to 19.97 µg/m³), which was likely influenced by dynamic volatilization due to temperature variations. During the monsoon, ammonia levels remained relatively stable at 16.57 µg/m³, benefiting from atmospheric cleansing via precipitation.
Benzene, a known human carcinogen, presented the highest seasonal mean during the postmonsoon season (2.44 µg/m³), with hourly concentrations ranging between 2.33 and 2.50 µg/m³. During the winter, summer, and monsoon seasons, the benzene concentrations were relatively low, with means of 2.08, 2.05, and 2.21 µg/m³, respectively. This suggests a consistent baseline contribution from fuel combustion and solvent evaporation, with higher stability during colder, low-wind conditions. Toluene, an industrial solvent and a marker of vehicular emissions, showed significant seasonal variation. The postmonsoon season recorded the highest mean concentration (19.35 µg/m³), with a narrow range between 18.62 and 19.78 µg/m³, likely reflecting accumulation due to low dispersion and active industrial sources. The winter, summer, and monsoon concentrations were progressively lower (12.83 µg/m³, 12.04 µg/m³, and 8.94 µg/m³, respectively), which is consistent with the seasonal patterns of ambient mixing and emission activity. Xylene concentrations displayed a notable seasonal inversion. Winter (2.64 µg/m³) and summer (2.54 µg/m³) presented the highest mean concentrations, whereas monsoon levels were the lowest (2.21 µg/m³). The summer peak likely reflects the temperature-enhanced volatility of fuels and solvents, whereas the winter peak corresponds to increased combustion emissions and atmospheric stagnation. The postmonsoon levels were moderate (2.07 µg/m³). The ethylbenzene levels were highest in winter (mean: 2.45 µg/m³, maximum: 2.49 µg/m³), which was likely due to stable atmospheric layers and increased urban activities. The postmonsoon and monsoon means were 2.18 and 2.14 µg/m³, respectively. MP-xylene peaked in summer (3.05 µg/m³), with a range of 3.03 to 3.08 µg/m³. This trend highlights the temperature sensitivity and photoreactive nature of aromatic VOCs, which contribute to ozone and secondary organic aerosol formation during hot periods.
The concentrations of VOCs and NH3 are closely linked to both anthropogenic and meteorological factors. Major emission sources in Faridabad include vehicular exhaust, especially during peak traffic hours; solvent use and industrial processes (e.g., paints, coatings); biogenic and waste-related NH3 emissions; and fuel storage and evaporation, particularly in high-temperature seasons. Seasonal and diurnal variations were shaped by postmonsoon and winter, characterized by lower mixing heights, temperature inversions, and weak wind speeds, which promoted pollutant accumulation. During summer, high ambient temperatures enhance VOC evaporation but also accelerate photodegradation, resulting in dynamic concentration shifts throughout the day. During the monsoon season, precipitation-driven scavenging and strong atmospheric circulation reduced overall concentrations but preserved a degree of early-morning accumulation. VOCs, particularly benzene and toluene, are linked to a wide range of adverse health effects. Benzene exposure is associated with hematologic disorders, including leukemia. Toluene and xylene cause neurological impairment, respiratory irritation, and chronic toxicity with prolonged exposure. Ammonia, while not acutely toxic at ambient levels, reacts with atmospheric acids to form secondary fine particulate matter, contributing indirectly to cardiorespiratory morbidity. Additionally, all the VOCs evaluated contribute to tropospheric ozone formation, particularly under high-radiation, VOC-limited regimes observed in the summer and postmonsoon seasons. Effective regulation of VOCs and ammonia requires the adoption of low-VOC solvent technologies in paint, printing, and industrial operations; stringent vehicular emission standards, particularly those targeting cold-start emissions; public education on fuel handling and the use of household products with volatile compounds; regulated fertilizer application with emphasis on timing, quantity, and formulation to reduce NH3 volatilization; and the implementation of real-time air monitoring in urban-industrial zones to flag VOC spikes and enforce local controls. Long-term control strategies should integrate VOC and NH3 emissions into ozone and PM2.5 management plans, especially given their role in secondary pollution formation.
Correlation Matrix and Inter-Pollutant Dynamics
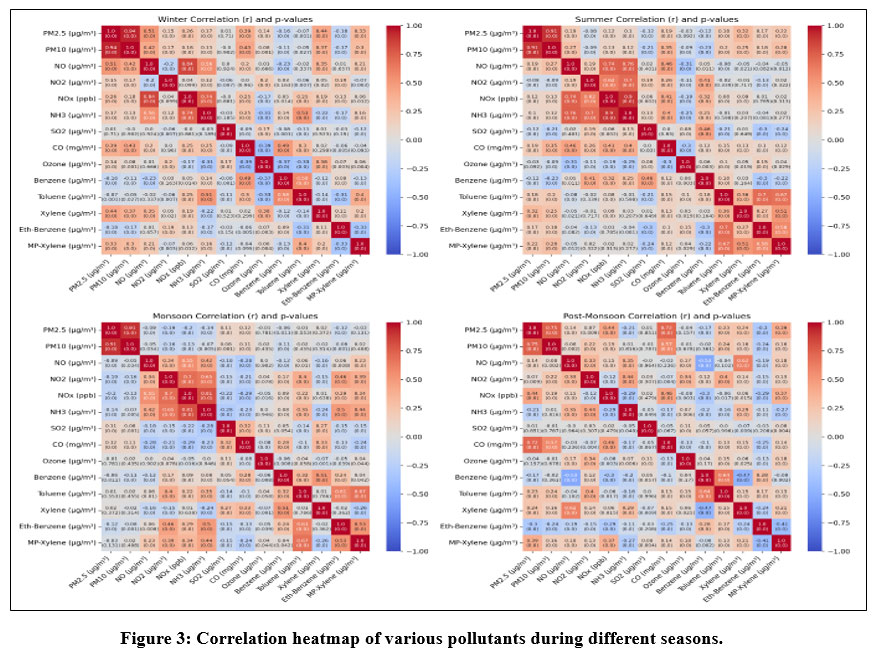
The correlation analysis consistently revealed strong relationships between primary pollutants originating from combustion and resuspension sources, as shown in Figure 3. Across all four seasons, PM2.5 and PM10 demonstrated robust and statistically significant correlations (r > 0.88), confirming their shared origins in vehicular emissions, construction dust, road resuspension, and industrial combustion. These associations were strongest during the winter and postmonsoon seasons, where limited dispersion and frequent inversions contributed to pollutant accumulation near the ground. Similarly, NO, NO2, and NOx showed very strong mutual correlations (r > 0.90), reflecting their common emission pathways, primarily from motor vehicles and industrial fuel burning. CO, another byproduct of incomplete combustion, exhibited a strong correlation with NOx, particularly during winter (r = 0.85) and postmonsoon, further underscoring traffic emissions as a dominant source during periods of low atmospheric mixing.
 | Figure 3: Correlation heatmap of various pollutants during different seasons.
|
Unlike the primary pollutants, O3 displayed a seasonally dependent, inverse relationship with its precursors, particularly NOx. This dynamic was most pronounced in the summer (r = –0.63) and postmonsoon (r = –0.52) seasons, when high solar radiation facilitates the photolysis of NO2, producing ozone as a secondary pollutant. During these seasons, lower ambient NO concentrations in the afternoon reduce the titration effect, allowing ozone levels to rise. Conversely, in winter, the abundance of NO combined with weaker sunlight limits photochemical activity, leading to a reduced inverse correlation (r = –0.36). These patterns align with the photo-stationary state theory, highlighting ozone's dependence not only on precursor emissions but also on solar intensity and atmospheric chemistry.
VOCs, such as benzene, toluene, xylene (BTX), ethylbenzene, and MP-xylene, had high intercorrelations (r = 0.70–0.91), which suggests that they share similar sources of emissions, such as automobile exhaust, fuel evaporation, solvent use, and industrial processes. These relationships were consistently high throughout the seasons, with the highest values occurring in the winter and postmonsoon seasons, when emissions prevail in stable and cool air. Most interestingly, in summer, some VOCs, particularly toluene and xylene, also presented moderate positive correlations with ozone levels (r = 0.35–0.42), indicating their participation in the formation of photochemical ozone under strong solar radiation. This highlights the importance of VOCs as toxic air pollutants as well as intermediates in the formation of secondary pollutants via photochemical smog formation.
Among the gaseous precursors to secondary particulate matter, SO2 and NH3 showed more moderate and seasonally variable associations with other pollutants. SO2 was moderately correlated with NOx during the winter and postmonsoon seasons (r = 0.45–0.61), reflecting their joint emission from industrial fuel combustion and thermal power generation. Moreover, NH3 exhibited weak to moderate positive correlations with PM2.5 during the postmonsoon season and summer (r = 0.29–0.36), which is consistent with its role in the formation of ammonium nitrate and sulfate aerosols. However, its relatively weak overall correlations suggest that NH3 contributions to particulate matter may be spatially or temporally decoupled or influenced by localized emission sources such as agriculture, sewage, and municipal waste.
The correlation matrices demonstrate that pollutant interrelationships are not static but vary significantly by season in response to meteorological conditions and source activity.1,3,8,11 During winter, stable atmospheric conditions lead to widespread pollutant accumulation and stronger correlations among combustion-related emissions. In summer, when dispersion increases, enhanced photochemistry strengthens the link between VOCs and ozone. Owing to its high humidity and rainfall, the monsoon season generally has weak correlations, except for PM2.5–PM10, which remain tightly linked because of consistent resuspension processes between wet intervals. The postmonsoon season, which is influenced by regional biomass burning and light winds, presents a unique mix of elevated primary emissions and emerging photochemical activity, leading to distinctive correlation structures. The observed inter-pollutant dynamics have direct implications for air quality management in Faridabad. The strong correlations among combustion-related pollutants (PM2.5, PM10, NOx, and CO) suggest that targeted vehicle and industrial emission control policies could yield substantial co-benefits. However, the complex relationships among ozone, NOx, and VOCs highlight the need for seasonally adaptive and chemically informed strategies. For example, summer ozone mitigation requires simultaneous VOC and NOx reductions, whereas winter strategies may prioritize NOx control to suppress ozone titration and reduce PM2.5 formation. Additionally, the high mutual correlation among VOCs suggests that regulating specific volatile compounds, such as toluene or xylene, could have broader benefits across the VOC family. Finally, addressing NH3 and SO2 emissions, particularly from agriculture and industry, is essential for the long-term control of secondary aerosols and their health impacts. These insights underscore the need for a multipollutant, multiseasonal policy framework tailored to the unique chemical and meteorological context of urban India.
Comparison with National and WHO Air Quality Standards
A comparison of the observed pollutant concentrations in Faridabad with the air quality thresholds defined by the National Ambient Air Quality Standards (NAAQS, CPCB, India) and the World Health Organization’s Global Air Quality Guidelines (2021) reveals significant exceedances for several key pollutants, particularly during the winter and postmonsoon seasons. While the Indian NAAQS is relatively lenient and reflects socioeconomic considerations, the WHO’s revised 2021 guidelines are stricter and are based purely on health criteria.
For PM2.5, the Indian 24-hour standard is 60 µg/m³, whereas the WHO guideline is 15 µg/m³. During the winter season, the hourly PM2.5 concentrations in Faridabad routinely exceeded 170 µg/m³, far above both benchmarks. Similar patterns were observed for PM10, where the observed values reached 271.5 µg/m³, compared with the NAAQS limit of 100 µg/m³ and the WHO’s tighter guideline of 45 µg/m³. NO2 and SO2 levels remained within Indian limits but still exceeded WHO recommendations during peak hours, particularly in colder months. CO concentrations occasionally crossed the WHO 8-hour standard of 4 mg/m³, although they generally remained within the Indian threshold of 2 mg/m³ for 1-hour averages. Ozone (O3) values, while below the Indian limit of 100 µg/m³, regularly surpassed the WHO’s recommended 8-hour maximum of 60 µg/m³ during summer afternoons. CO values remain within the WHO’s 8-hour limit for most hours but may exceed it during peak winter episodes, especially in traffic-dense zones.
These findings indicate that PM2.5 and PM10 are regularly in violation of both national and international standards, clearly indicating how critical they are in the air quality burden of Faridabad. Ozone and NO2 exceedances concerning WHO levels indicate potential long-term health risks even if the national levels are satisfied. The difference between conforming to national regulations and more health-based global standards, such as these, has implications for India’s air quality benchmarks, especially in high-risk urban locations such as Faridabad.
PM2.5/PM10 ratio: Implications for source identification
The PM2.5/PM10 ratio serves as a diagnostic indicator for understanding the composition and origin of airborne particulates. A higher ratio suggests a greater contribution of fine particles, which are typically associated with combustion sources such as vehicular emissions, biomass burning, and industrial processes. In contrast, a lower ratio indicates a greater presence of coarse particles, often resulting from resuspended road dust, construction activity, or natural sources such as soil and dust storms.
In the context of Faridabad, the PM2.5/PM10 ratio varies seasonally, reflecting the dynamic influence of meteorology and emission sources. On the basis of the seasonal average concentrations:
In winter, the ratio was 0.63 (PM2.5 mean: 171.85 µg/m³; PM10 mean: 271.48 µg/m³), indicating fine particulate dominance, which is consistent with low-temperature combustion and stagnant dispersion conditions.
During the postmonsoon season, the ratio was 0.52 (PM2.5: 114.73 µg/m³; PM10: 222.62 µg/m³), reflecting elevated combustion-related PM, likely from agricultural residue burning in nearby regions.
The summer season had a lower ratio of 0.57, with higher coarse particle contributions attributed to resuspension and construction dust, alongside high temperatures that support the dispersion of finer particles.
The monsoon season presented the lowest ratio at 0.53, largely because of the dominance of coarse-mode particles during intermittent dry spells and the washout effect of rainfall, which more effectively removes finer particles from the atmosphere.
A PM2.5/PM10 ratio greater than 0.5, as observed in all four seasons, implies a significant presence of combustion-derived fine particulates in Faridabad's atmosphere. The highest ratio in winter corroborates the dominance of traffic and household heating emissions under inversion conditions.3,11,16 The slightly reduced ratios in the postmonsoon season and summer indicate a mixed influence of combustion and mechanical sources such as dust and soil resuspension.
These findings are consistent with previous urban air quality assessments in northern India, where PM2.5/PM10 ratios between 0.5 and 0.7 have been documented as typical of urban-industrial environments with dense vehicular activity.2,3,16 The persistence of high fine particle fractions across all seasons in Faridabad highlights the critical need for targeted regulation of fine particulate sources, particularly vehicular and biomass combustion.
Health Implications of Air Pollution and Policy Recommendations for Faridabad
Air pollution in Faridabad, driven by traffic emissions, industrial discharge, and agricultural residue burning, poses significant health risks, particularly during high-concentration periods. The seasonal and diurnal fluctuations in pollutants such as PM2.5, PM10, NOx, SO2, CO, and O3, as observed in this study, reveal acute exposure times that exacerbate public health conditions.9,17,18 The highest concentrations of PM2.5 observed during the winter and postmonsoon seasons are notably linked to respiratory diseases, cardiovascular issues, and long-term health risks,17 with levels frequently surpassing the National Ambient Air Quality Standards (NAAQS) and World Health Organization (WHO) guidelines. Prolonged exposure to high levels of fine particulate matter and nitrogen oxides increases the risk of asthma,19 lung cancer,20 and other chronic respiratory conditions.21 Furthermore, ozone, a secondary pollutant, although not emitted directly, poses a substantial risk to lung health, particularly for vulnerable populations such as children, elderly individuals, and those with preexisting respiratory conditions.9,22 On the basis of WHO 2021 exposure–response functions, the observed PM2.5 levels in Faridabad could contribute to an estimated 10–15% increase in annual all-cause mortality risk, assuming population-wide chronic exposure above 100 µg/m³. Short-term spikes above 150 µg/m³, as recorded in winter mornings, are also associated with an increased incidence of respiratory hospital admissions, particularly among children and elderly individuals. These health burdens are consistent with findings from Delhi, Kanpur, and Patna, where elevated PM2.5 exposure is correlated with excess mortality estimates ranging from 12,000–25,000 deaths per year.17,19,22
Key Policy Recommendations
Traffic Control Measures
Time-bound restrictions, such as odd–even vehicle schemes and congestion pricing, are implemented during peak pollution periods to reduce vehicular emissions, especially in the winter and postmonsoon seasons.
Promotion of Electric Mobility
Encouraging the shift to electric vehicles and enhancing public transportation infrastructure to reduce emissions from diesel-powered vehicles.
Stricter Emission Standards
Enforce stringent regulations on diesel generators, industrial activities, and the use of fossil fuels in industries, particularly during high-pollution seasons.
Regional Coordination on Agricultural Residue Burning
Strengthening cross-border cooperation with neighboring states to regulate and reduce crop burning, which contributes significantly to seasonal air pollution.
Public Awareness Campaigns
Launch initiatives to educate the public about the health risks of air pollution and encourage changes in behavior, such as reduced use of private vehicles, cleaner cooking methods, and avoidance of open waste burning.
Integrated Air Quality Monitoring
Expanding the network of real-time monitoring stations and issuing timely alerts during peak pollution periods to safeguard vulnerable populations.
The air pollution challenge in Faridabad demands a full range of project(s) that address city-specific diurnal and seasonal pollution patterns. These actions, combined with work across regions, air quality monitoring, and engagement with our community, reduce a city’s exposure to harmful pollutants and help protect the people within the city. This study reveals the substantial seasonal and diurnal variations in air pollutant concentrations in Faridabad, atmospheric PM2.5 and PM10, with monotonically increasing peaks in winter and postmonsoon durations. These spikes are largely due to automotive pollution, industrial activities, and the clearing of agricultural residues, all of which increase in the cooler season. PM2.5 µg/m3 in winter, more than double those prescribed by the Indian NAAQS and WHO, and finally indicating substantial heavy pollution in the city. The results highlight the seasonal variability in air quality and highlight the importance of adopting season-specific policies for protection from prolonged exposure to particulate matter. The study also revealed marked diurnal changes in pollutant concentrations, with peaks in the morning and evening for PM2.5, NOx, and CO, which are associated with emissions under traffic conditions, followed by afternoon minima due to enhanced photolysis and atmospheric scattering. Strong correlations between PM2.5, PM10, NOx, and CO indicate that combustion sources are the major sources of fine particles. The PM2.5/PM10 ratio (ranging from 0.52 to 0.63) further supports this attribution, with higher values indicating that fine particles, often from combustion and biomass burning, dominate the particulate load in the region. The positive correlation between PM2.5 and NOx is particularly striking, underscoring the role of vehicular emissions in fine particulate pollution during high-traffic hours, particularly in winter and postmonsoon hours, when stagnant atmospheric conditions limit pollutant dispersion. Ozone, on the other hand, showed an inverse relationship with NOx, particularly in the summer and postmonsoon seasons, confirming the NOx titration effect in urban environments. The inverse correlation suggests that, while NOx emissions contribute to ozone formation through photochemical reactions, high NOx concentrations during rush hours and colder seasons inhibit this process, leading to reduced ozone levels. Several recent investigations across Indian urban centers echo the temporal pollution dynamics documented in this study, particularly concerning the diurnal and seasonal behavior of PM2.5, NOx, and O3,16 highlighted how PM2.5 concentrations in Delhi are highly responsive to wind speed and direction, with morning and evening peaks driven by poor dispersion during thermal inversions—closely mirroring the bimodal patterns observed in Faridabad. These trends further underscore the role of meteorological suppression during the winter and postmonsoon seasons. Similarly, Krishnaveni23 provided a comparative analysis across urban and rural sites in India, which revealed strong correlations between O3 levels and NOx under solar-driven photochemical regimes. Their work emphasized that ozone’s inverse relationship with NOx is especially pronounced in summer, aligning with their findings of afternoon O3 peaks and suppressed morning levels due to titration. This photostationary behavior, which is dependent on precursor availability and radiation, was also noted by Yadav,24 who observed consistent O3 build-up during midday hours across urban regimes and reported that short-term exposure to PM2.5 and O3 jointly elevated health risks. Expanding on NCR-specific evidence, Bhadauria25 analyzed Gurugram’s pollution profile and reported hourly pollutant cycles nearly identical to those reported by Faridabad, with PM and NO2 peaks tied to commuting and industrial shifts. These findings support the conclusion that emission sources and meteorological stagnation work synergistically to amplify diurnal pollution. Additionally, Suthar26 reported similar seasonal and hourly behaviors in Bengaluru, validating the universality of such dynamics across Indian metros while warning that pollution routinely exceeds both the NAAQS and WHO thresholds, particularly in the postmonsoon season and winter.
The high correlation between combustion-based pollutants (PM2.5, NOx, and CO) and the inverse trend of O3 confirms the photochemical and dispersion-related mechanisms. These results strengthen the case for targeted, time-sensitive policies, including restrictions during peak hours, seasonal crop-burning coordination, and dynamic air quality governance rooted in real-time meteorological data. A critical aspect of this study is the comparison of observed pollutant concentrations with national and international air quality standards. The findings revealed that the PM2.5 and PM10 concentrations consistently exceeded the Indian NAAQS and WHO guidelines, especially during the winter and postmonsoon seasons. For example, the PM2.5 levels during winter (ranging from 101.74 to 171.85 µg/m³) were almost three times higher than the Indian limit of 60 µg/m³ and more than ten times the WHO guideline of 15 µg/m³. Similarly, ozone levels frequently exceeded the WHO’s 8-hour guideline of 60 µg/m³, although they remained within the Indian NAAQS limit of 100 µg/m³. These exceedances point to the limitations of the NAAQS in protecting public health, particularly in urban areas where pollution levels regularly surpass global safety thresholds. The persistent exceedance of both the PM2.5 and ozone levels, despite compliance with Indian standards, indicates a disparity between national regulations and the health risks associated with air pollution. This gap reflects the need for stronger and more comprehensive air quality standards, particularly those aligned with the WHO’s health-based recommendations, to mitigate long-term health impacts in highly polluted urban environments such as Faridabad. These findings underscore the need for multipollutant, time-sensitive interventions tailored to the seasonal and diurnal variability of pollutants. The following policy recommendations are crucial for addressing the air quality challenges in Faridabad:
Real-time air quality monitoring should be expanded, with more stations covering areas of high exposure, such as commercial zones and traffic hotspots, particularly during peak hours.
Emission control strategies should target vehicular emissions, especially diesel-powered vehicles, which contribute significantly to both PM2.5 and NOx. Implementing low-emission zones during high-traffic hours and promoting electric vehicle adoption will be vital.
Strengthened regulation of biomass burning in nearby agricultural areas is essential, particularly during the postmonsoon season, when regional biomass burning significantly impacts Faridabad’s air quality.
Ozone management requires a balanced approach, focusing not only on reducing NOx emissions but also on addressing VOCs from industrial and residential sources, as these contribute to ozone formation in warmer months.
Public health campaigns are needed to raise awareness about the dangers of air pollution and to promote behaviors that reduce exposure, particularly during high-pollution periods (e.g., morning and evening rush hours).
Although the present study provides significant findings regarding the air pollution dynamics in Faridabad, several limitations need to be addressed. First, the analysis was based on measurements made at the monitoring station only, which may not represent the entire spatial variability of the concentration of pollutants in the city. In the future, the monitoring network may also be extended to other sites for different land-use types (e.g., residential, industrial, and agricultural areas). While the study provides high-resolution temporal insights, several limitations must be acknowledged. First, the analysis is based on data from 4 monitoring stations, which may not capture microspatial variability across Faridabad. Second, VOC data were limited to a few species and lacked continuous hourly records, which restricted their integration into ozone modeling. Third, satellite-based fire detection is subject to cloud interference, potentially underestimating the intensity or timing of burning events. Finally, missing values (although <5%) were interpolated via linear methods, which may smooth out some sharp pollution events. Future studies should integrate multi-station data, incorporate health surveillance datasets, and apply source-apportionment tools to increase attribution accuracy.
Discussion
The present study provides a high-resolution temporal assessment of air pollution dynamics in Faridabad, an industrializing NCR city with complex urban and regional emission sources. Our analysis of hourly and seasonal pollutant patterns, spanning PM2.5, PM10, NOx, CO, SO2, O3, VOCs, and NH3, reveals marked temporal variability shaped by anthropogenic activity and meteorological conditions. These results reinforce the importance of targeted air quality interventions aligned with specific times of day and seasons. The fine particulate matter (PM2.5) concentration consistently exceeded both the NAAQS and the WHO guidelines, particularly during the winter and postmonsoon seasons. The PM2.5/PM10 ratio ranged from 0.52 to 0.63 across seasons, suggesting that combustion sources such as vehicular emissions, biomass burning, and industrial activity were the dominant contributors. The elevated winter concentrations are largely attributable to stagnant meteorological conditions, low wind speeds, temperature inversions, and shallow boundary layers, which trap pollutants near the surface. In contrast, the improved dispersion and washout processes during the monsoon season yielded relatively cleaner air, although transient peaks persisted during nonrainfall intervals. NOx and CO followed bimodal diurnal trends, with peaks during the morning and evening rush hours, underscoring the contribution of vehicular emissions. Strong correlations among PM2.5, PM10, NOx, and CO (r > 0.85) further validate their shared combustion origin. CO levels were especially concerning during winter mornings, often nearing or exceeding the WHO 8-hour threshold in densely trafficked zones. Ozone dynamics contrast with those of primary pollutants, exhibiting afternoon maxima, particularly in summer, due to photochemical formation under high solar radiation. Its inverse correlation with NOx (r = –0.63 in summer) aligns with titration theory and highlights the dual role of NOx as both a precursor and a scavenger of O3. This seasonal NOx–O3 interplay illustrates the necessity for differentiated ozone management strategies on the basis of precursor availability and sunlight intensity. VOCs, including benzene, toluene, and xylene, showed seasonally elevated concentrations during the postmonsoon season and winter. Their positive correlation with ozone during high-radiation periods (r = 0.35–0.42) underscores their photochemical reactivity. Notably, ambient benzene levels remain within Indian limits but pose chronic health risks, given their carcinogenicity, especially under sustained exposure in winter. Ammonia concentrations peaked in the postmonsoon and winter seasons, likely because of fertilizer volatilization and urban waste emissions. Although not acutely toxic, the role of NH3 in secondary aerosol formation makes it a critical contributor to PM2.5 levels, particularly under cool, stagnant conditions. Critically, the majority of monitored pollutants, particularly PM2.5, PM10, and ozone, exceeded the WHO health-based thresholds during at least one season. These findings reflect the inadequacy of India’s current air quality standards in mitigating health risks in high-burden cities such as Faridabad. Moreover, the dynamic pollutant behavior across time underscores the limitations of static, annual average-based policy interventions. The results of this study corroborate earlier studies across the Indo-Gangetic Plain that emphasized the interplay between urban emissions, regional transport (e.g., stubble burning), and meteorological suppression. Similar pollutant cycles have been documented in Delhi, Gurugram, and Bengaluru, confirming the universality of the diurnal “double peak” in the PM2.5 and NOx concentrations. This study contributes to air quality policy by highlighting the need for real-time, location-specific mitigation strategies. For example, peak-hour traffic restrictions, staggered industrial operations, and alerts during postmonsoon crop burning events could significantly reduce acute exposure. Moreover, the correlation heatmap offers actionable insights for coregulation: interventions targeting combustion sources may yield cobenefits across PM, NOx, CO, and VOCs simultaneously. Nonetheless, some limitations persist. Spatial resolution was constrained by reliance on single-station monitoring; expanding the sensor network to capture intracity variability across industrial, residential, and peri-urban zones would increase representativeness. Further integration of satellite-based fire data and low-cost sensors could enrich temporal and spatial coverage, whereas health surveillance data could substantiate exposure disease linkages.
Conclusion
This study presents a detailed analysis of the diurnal and seasonal variations in air pollution in Faridabad, focusing on key pollutants such as PM2.5, PM10, NOx, SO2, CO, O3, NH3, and VOCs. The findings revealed that the air quality in Faridabad deteriorated significantly during the winter and postmonsoon periods, primarily due to a combination of vehicular emissions, industrial activity, regional agricultural residue burning, and adverse meteorological conditions that limit pollutant dispersion. The diurnal analysis highlights distinct morning and evening peaks for primary pollutants such as PM2.5, PM10, NOx, and CO, which correlate with traffic rush hours and domestic heating. In contrast, O3 concentrations peak during the afternoon, driven by photochemical reactions involving NOx and VOCs. Quantitative data indicate that PM2.5 levels consistently exceed the national permissible limits, especially during winter, when concentrations approach 170 µg/m³, far surpassing the Indian NAAQS and WHO health-based guidelines. The study also underscores the dominance of fine particulate pollution (PM2.5) over coarse particulate matter (PM10), with a PM2.5/PM10 ratio above 0.5 across all seasons, indicating that combustion-related activities, including vehicular emissions and biomass burning, are major sources of particulate pollution. While SO2 and CO concentrations largely remained within Indian standards, ozone levels frequently exceeded the WHO’s recommended thresholds, particularly during summer afternoons, revealing the ongoing challenge of managing secondary pollutants. The correlation analysis further established that PM2.5, NOx, and CO are closely linked, primarily through combustion sources, whereas the formation of O3 is governed by complex interactions between NOx and VOCs, modulated by solar radiation. NH3 and SO2, although not primary pollutants, contribute to secondary aerosol formation, especially during the cooler months. The findings emphasize the complexity and seasonal dynamics of air pollution in Faridabad. The city’s air quality challenges are not limited to a single pollutant or emission source but are shaped by a combination of urban emissions, meteorological conditions, and regional agricultural practices. Addressing these issues requires targeted, multipollutant strategies that consider both primary and secondary pollutant control while also accounting for seasonal and diurnal variations. In conclusion, improving air quality in Faridabad demands a comprehensive, multisectoral approach that includes stricter regulations on emissions from vehicles, industrial units, and biomass burning, as well as increased public awareness and community engagement. Time-sensitive interventions, such as traffic restrictions, low-emission zones, and real-time air quality monitoring, are essential to mitigate exposure during peak pollution periods. Furthermore, aligning India’s air quality standards with more stringent WHO guidelines will help safeguard public health. Effective air quality management requires ongoing collaboration among government authorities, industries, and the public to implement sustainable and impactful solutions.
Acknowledgments
The authors gratefully acknowledge the Central Pollution Control Board (CPCB), India, for providing publicly accessible air quality data through the Central Control Room for Air Quality Management portal (https://airquality.cpcb.gov.in). The data accessed in February 2025 has been instrumental in supporting the analysis and findings presented in this study.
Funding Sources
The author(s) received no financial support for the research, authorship, and/or publication of this article.
Conflict of Interest
The authors do not have any conflict of interest
Data Availability statement
Data examined throughout this study are provided within the manuscript.
Ethics Statement
This research did not involve human participants, animal subjects, or any material that requires ethical approval.
Informed Consent Statement
This study did not involve human participants, and therefore, informed consent was not required.
Permission to reproduce material from other sources
Not Applicable
Author Contributions
Prashant Ravish: Conceptualization, Methodology, Software, Data curation, Writing- Original draft, Reviewing and Editing.
Urvashi Kashyap- Reviewing and Editing.
References
- Ravindra K, Singh T, Mor S. COVID-19 pandemic and crop residue burning in India: Issues and prospects for sustainable management. Environmental Science and Pollution Research. 2022;29:9871-9884.
CrossRef - Ravish P, Chaudhry S. Impact of sugarcane trash burning on ambient air quality in agricultural regions of Northern Haryana, India. Int J Environ Sci Technol. Published online November 25, 2024. doi:10.1007/s13762-024-06192-5
CrossRef - Kumar A, Ramesh R. Impact of industrial emissions and small-scale businesses on urban air pollution in Haryana. Environmental Science & Technology. 2022;47(8):1603-1610. doi:10.1021/acs.est.2c01028
CrossRef - Sahu LK, Bhattacharya A. Vehicular emissions and their impact on air quality in North India: A study of Haryana and Delhi NCR. Journal of Environmental Management. 2020;258:109921. doi:10.1016/j.jenvman.2019.109921
- Soni PS, Singh V, Gautam AS, et al. Temporal dynamics of urban air pollutants and their correlation with associated meteorological parameters: an investigation in northern Indian cities. Environ Monit Assess. 2024;196(6):505. doi:10.1007/s10661-024-12678-z
CrossRef - Jain N, Bhatia A, Pathak H. Emission of air pollutants from crop residue burning in India. Aerosol Air Qual Res. 2014;14(1):422-430.
CrossRef - Prakriti, Siddiqui A, Kannemadugu HBS, et al. Deciphering Seasonal Variability and Source Dynamics of Urban Pollutants Over Delhi Under Surface Meteorological Influence Using Ground-Based and Trajectory Modeling Techniques. Earth Syst Environ. Published online December 7, 2024. doi:10.1007/s41748-024-00541-7
CrossRef - Kaushik N, Mishra AK, Das RM. Assessment of benzene and toluene emissions in National Capital Region (NCR): Implications for health risks and ozone formation. Air Qual Atmos Health. 2024;17(12):3015-3029. doi:10.1007/s11869-024-01618-y
CrossRef - Masood A, Ahmad K. Data-driven predictive modeling of PM2.5 concentrations using machine learning and deep learning techniques: a case study of Delhi, India. Environmental Monitoring and Assessment. 2022;195. doi:10.1007/s10661-022-10603-w
CrossRef - Mor S, Singh T, Bishnoi NR, Bhukal S, Ravindra K. Understanding seasonal variation in ambient air quality and its relationship with crop residue burning activities in an agrarian state of India. Environ Sci Pollut Res. 2022;29(3):4145-4158. doi:10.1007/s11356-021-15631-6
CrossRef - Saharan US, Kumar R, Singh S, et al. Hotspot driven air pollution during crop residue burning season in the Indo-Gangetic Plain, India. Environmental Pollution. 2024;350:124013. doi:10.1016/j.envpol.2024.124013
CrossRef - Sharma A, Srivastava S, Kumar R, Mitra D. Source attribution of carbon monoxide over Northern India during crop residue burning period over Punjab. Environmental Pollution. 2024;359:124707. doi:10.1016/j.envpol.2024.124707
CrossRef - Hari M, Sahu RK, Tyagi B, Kaushik R. Reviewing the Crop Residual Burning and Aerosol Variations during the COVID-19 Pandemic Hit Year 2020 over North India. Pollutants. 2021;1(3):127-140. doi:10.3390/pollutants1030011
CrossRef - CPCB. National Air Quality Monitoring Programme (NAMP) Annual Report 2021–22. CPCB. Published online 2022.
CrossRef - Vaishali, Das RM. Seasonal and diurnal variability of PM2.5 concentration along with the role of wind patterns over different locations of Delhi during the year 2018 to 2022. Environ Monit Assess. 2025;197(4):350. doi:10.1007/s10661-025-13761-9
- Alamgir W, Shan H. Air pollution: a challenge to public health and healthcare systems. Life Sci. 2024;5(1):02-02.
CrossRef - Health Effects Institute. State of Global Air 2020: A Special Report on Global Exposure to Air Pollution and Its Health Impacts. Health Effects Institute; 2020. https://www.stateofglobalair.org
CrossRef - Tigala S, Sharma A, Sachdeva K. Health risk assessment due to biomass smoke exposure in Indian indoor environment: An empirical approach using lung deposition model. The Science of The Total Environment. 2018;640:935. doi:10.1016/j.scitotenv.2018.05.323
- Amre DK, Infante-Rivard C, Dufresne A, Durgawale PM, Ernst P. Case control study of lung cancer among sugarcane farmers in India. Occupational and Environmental Medicine. 1999;56(8):548-552.
CrossRef - Amato-Lourenço LF, others. An emerging class of air pollutants: Potential effects of microplastics to respiratory human health? The Science of the Total Environment. 2020;749:141676.
CrossRef - Ghosh S, Agrawal S, Sinha V. Ozone pollution in India: Background, dynamics, and policy implications. Atmospheric Environment. 2021;252:118361. doi:10.1016/j.atmosenv.2021.118361
CrossRef - Krishnaveni AS, Madhavan BL, Jain CD, Venkat Ratnam M. Spatial, temporal features and influence of meteorology on PM2.5 and O3 association across urban and rural environments of India. Atmospheric Environment: X. 2024;22:100265. doi:10.1016/j.aeaoa.2024. 100265
CrossRef - Yadav RK, Gadhavi H, Arora A, et al. Relation between PM2.5 and O3 over Different Urban Environmental Regimes in India. Urban Science. 2023;7(1):9. doi:10.3390/urbansci7010009
CrossRef - Bhadauria N, Chauhan A, Ranjan R, Jindal T. An assessment of seasonal, monthly and diurnal variations of ambient air quality in the Gurugram city (Haryana). JANS. 2023;15(1):306-313. doi:10.31018/jans.v15i1.4142
CrossRef - Suthar G, Singhal RP, Khandelwal S, Kaul N, Parmar V, Singh AP. Annual and seasonal assessment of spatiotemporal variation in PM2.5 and gaseous air pollutants in Bengaluru, India. Environ Dev Sustain. 2024;26(8):20629-20652. doi:10.1007/s10668-023-03495-4
CrossRef - Central Pollution Control Board. Central Control Room for Air Quality Management - Delhi NCR. Delhi: CPCB; 2025 [Accessed on 2025, Feb]. Available from: https://airquality.cpcb.gov.in/ccr/#/caaqm-dashboard-all/caaqm-landing/caaqm-data-repository
CrossRef


