Seasonal Variation of Physicochemical Parameters of Manjalar Reservoir on Western Ghats, Tamil Nadu, India
Sudhanthira Lingammal Maruthalingam
*
 , Suruli Kannan
, Karamurgan Sanjeevi
and Mathar Fathima Masoodu Mydeen
, Suruli Kannan
, Karamurgan Sanjeevi
and Mathar Fathima Masoodu Mydeen
1
Department of Environmental Studies,
School of Energy,
Environment and Natural Resources,
Madurai Kamaraj University, Madurai,
Tamil Nadu
India
http://dx.doi.org/10.12944/CWE.20.2.14
Copy the following to cite this article:
Maruthalingam S. L, Kannan S, Sanjeevi K, Mydeen M. F. M. Seasonal Variation of Physicochemical Parameters of Manjalar Reservoir on Western Ghats, Tamil Nadu, India. Curr World Environ 2025;20(2). DOI:http://dx.doi.org/10.12944/CWE.20.2.14
Copy the following to cite this URL:
Maruthalingam S. L, Kannan S, Sanjeevi K, Mydeen M. F. M. Seasonal Variation of Physicochemical Parameters of Manjalar Reservoir on Western Ghats, Tamil Nadu, India. Curr World Environ 2025;20(2).
Download article (pdf)
Citation Manager
Publish History

Introduction
Water also exists in liquid and crystal states on the surfaces of the Earth. Earth is 96.5% water-covered; 71% is found in oceans and 1.7% in groundwater. 1.7 % in glaciers. Reservoirs are water bodies that facilitate the study, the effect of the relative state of that determines the diversity of the organisms and fish fauna.1 There reservoir water basically used for agricultural uses, domestic purposes, and fisheries management. The survival and growth of all living organisms depend on water and resources.2 Water from different resources directly or indirectly benefits human welfare and enriches the environment.3 About 80% of freshwater is used mainly for irrigation and other purposes of use.4 Physicochemical parameters are the characteristics of water sources.5 Physicochemical parameters are one of the important components in aquatic systems to indicate water quality of aquatic ecosystems.6 The natural environmental conditions are like the climatic conditions, vegetation, and lithology.7
The quality of surface water depends on the physical, chemical, and biological characteristics and changing seasonal climatic conditions. The ecosystem and their support on water quality parameters.8 The physical and chemical properties of water are important to the composition of aquatic organisms.9 Living organisms that are present in the ecosystem can withstand their current environment when they are within permissible limits. Western Ghats is the rich source of India’s freshwater fishes. Their observation of physicochemical parameters of the water quality parameters plays an important role in the water environment and ecosystem.10 Various researchers around the world have assessments to reveal its water quality.11
Materials and Methods
Manjalar Reservoir
In sampling sites selected at Manjalar Dam. Fresh water will be collected in the Manjalar reservoir at Devadanapatti town in Theni district. It was started from Palani hills and towards joining the Vaigai River. There are four small streams that join the Manjalar reservoir.
Manjalar Reservoir
Sampling Sites:
Manjalar, is a reservoir which was constructed for the benefits of agricultural, drinking and Pisiculture activities of the people living in Theni district. Four sampling sites were considered, based on the water inflow, zones and activities of the people. Sampling were located in the Southern, Eastern, Northern and Western side of the reservoir as Site A, B, C, and D respectively.
Methodology
Surface water samples were collected from the Manjalar Reservoir. Water samples were collected fortnightly on a monthly basis. Water samples were collected from four sites: A, B, C, and D from January 2022 to December 2022.Surface water samples were collected in clean plastic containers for the analysis of various physicochemical parameters. Their sample observations were made in the morning.water samples analysis laboratory immediately. pH of water sample measured with a pH meter, temperature measured with a thermometer, conductivity measured with a conductivity meter, and total dissolved solids (TDS) measured with a TDS meter; total alkalinity determined by acid-base titration method; DO and BOD measured Winkler’s method, COD Open refluxed method, Chloride AgNo3 method, Nitrate Brucine method, total hardness EDTA method, Sulphate (Turbidiometric method), according to this sample analysis, the following method was followed APHA, 200512 and Trivedy and Goel.13
Results
Water is vital solvents essential to all living beings for their survival. The physicochemical parameters that were analyzed, such as AT, WT, pH, EC, DO, TH, BOD, COD, nitrate, nitrite, sulfate, phosphate, and free CO2, were analyzed, and results were compared with Indian standard values BIS, 2012,14, WHO 2017,15 and statistical analysis for SPSS using this package (version 21) of the results was tested with an ANOVA test depicted in the figures. Following Physico-chemical parameters were analyzed from four different sites of Manjalar reservoir fromJanuary2022 to December 2022. There all the monthly data were classified into four different seasons, Post-monsoon, Summer, Pre-monsoon, Monsoon.
.jpg) | Figure 1: Seasonal variation of pH from January 2022 to December 2022
|
pH of freshwater that important on the aquatic life and maintains the aquatic ecosystem. Its process from photosynthetic activity,16,32 and the physiological function of plants and animals.17 The maximum pH of 8 mg/l was observed during the month of May, summer, and the minimum pH value of 6 mg/l, July, Pre-monsoon 2022 (Figure1).
Atmospheric temperature
In aquatic system the flora and fauna affect by the temperature.18 The highest atmospheric temperature of 380C in the site- II, March, the season Post-monsoon and lowest temperature of was found at the site-IV, November during the Monsoon 2022. (Figure-2). Permissible limit 350C.WHO BIS, ISI (2017). 15,19,20,21
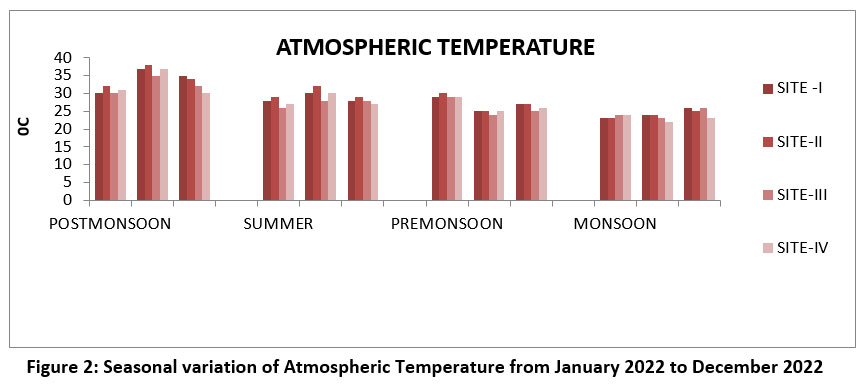 | Figure 2: Seasonal variation of Atmospheric Temperature from January 2022 to December 2022
|
Water temperature
Water temperature is important as well as biological productivity.22 The highest water temperature23,24 360°C, February, post-monsoon and summer, and lowest water temperature 20°C, October ,monsoon 2022. (Figure 3),
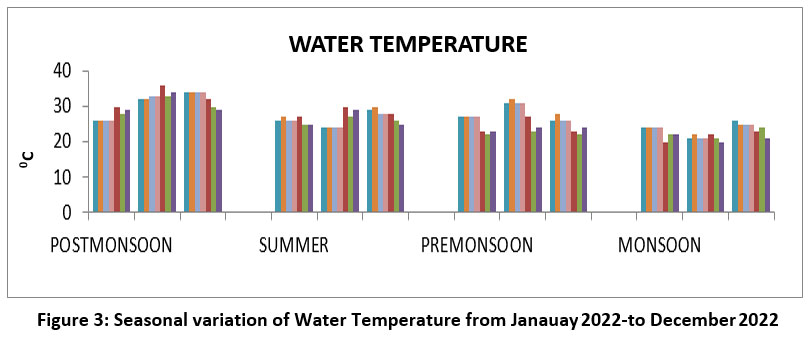 | Figure 3: Seasonal variation of Water Temperature from Janauay 2022 to December 2022
|
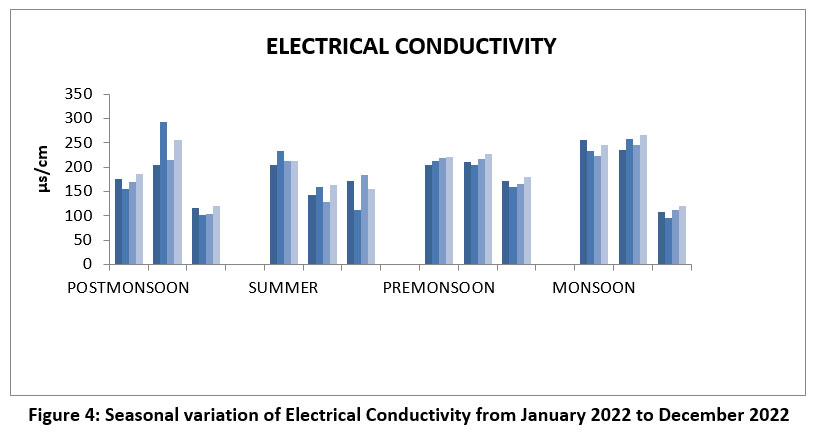 | Figure 4: Seasonal variation of Electrical Conductivity from January 2022 to December 2022
|
Electrical conductivity depends upon the concentration of electric current and temperature of the solution, it’s purity of water. It’s measure the quality of aquatic biota of water resource.25 The highest electrical conductivity was observed at 293 µs/cm, February, Post-monsoon season at site II, and lowest electrical conductivity was observed at 96 µs/cm at site II, December during the monsoon season of 2022. Permissible limit: 750-1500 µs/cm. (Figure 4),
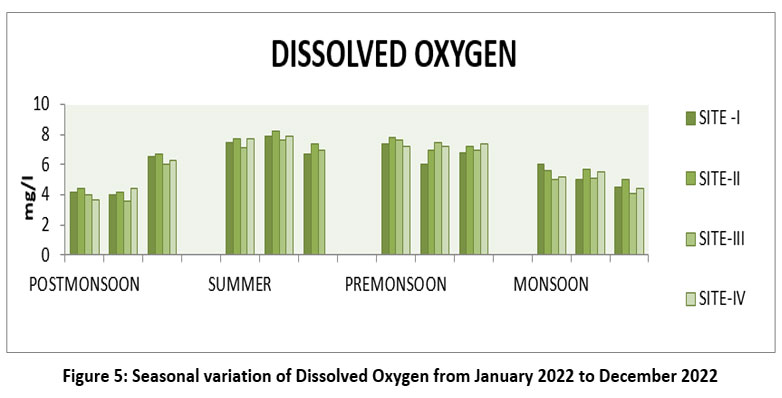 | Figure 5: Seasonal variation of Dissolved Oxygen fromJanaury 2022 to December 2022
|
DO is one of the most important parameter and quality of water, its maintain aquatic and biotic forms.26 The highest Dissolved Oxygen value 8.2 mg/l at the site II, May, Summer and lowest 3.6 mg/l, SIII, February, Post-monsoon 2022. (Figure-5).DO Permissible limit 6mg/l WHO,2017,15 BIS 2012.14
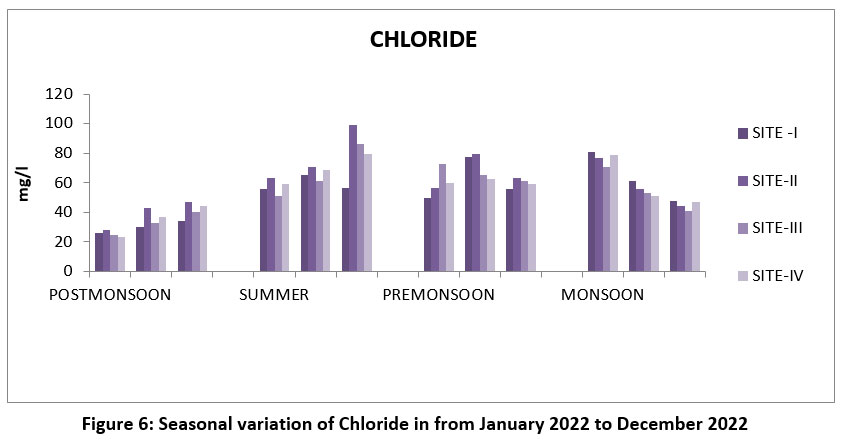 | Figure 6: Seasonal variation of Chloride in from January 2022 to December 2022
|
CL are usually from water is a soluble than natural activities, and salts present in minerals.27 The maximum Chloride 99.4 mg/l, site-II, June, Pre-monsoon and lowest 23, S- IV, January Post-monsoon. (Figure-6), Chloride permissible limit 250 mg/l.
Total Dissolved Solids
TDS include organic and inorganic salts present in universal solvent of water.28 TDS the highest 166mg/l S–II, October, Monsoon, and lowest 50 mg/l, S-I, January, Post-monsoon 2022. (Figure-7) TDS permissible limit 250mg/l WHO 2017,15 ISI 2017,20,21 and BIS 2012,14 500- 1000mg/l.
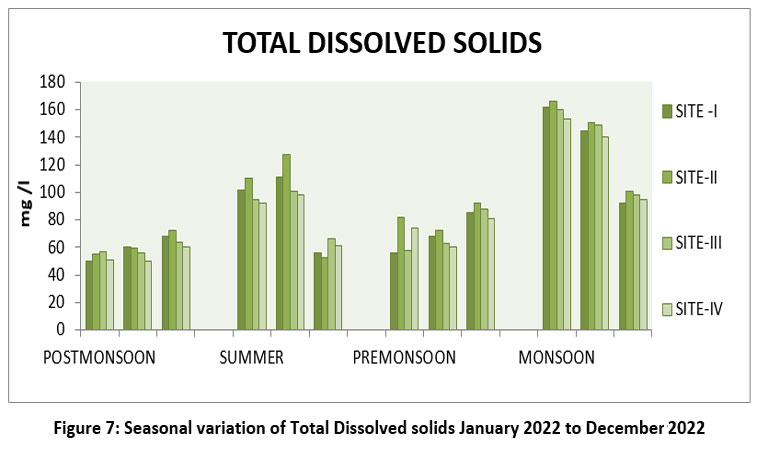 | Figure 7: Seasonal variation of Total Dissolved solids January 2022 to December 2022
|
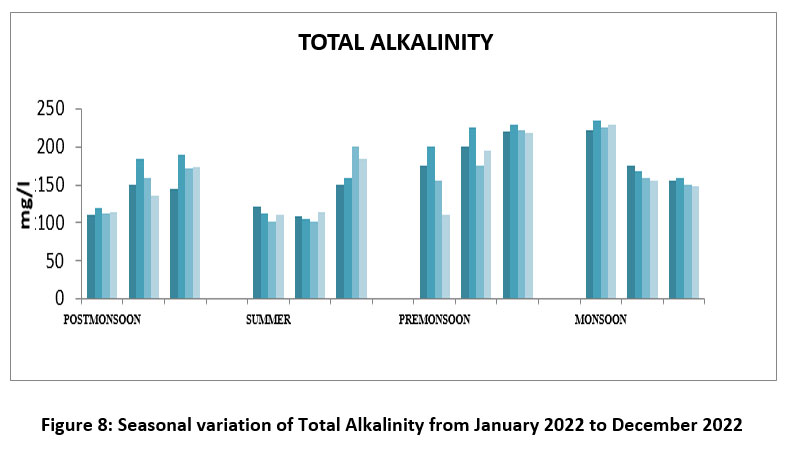 | Figure 8: Seasonal variation of Total Alkalinity from January 2022 to December 2022
|
Total Alkalinity measure water capacity to neutralize acids include carbonates and bicarbonates and hydroxides. Its maintain water quality and aquatic life. The highest Total Alkalinity 235 mg/l,site-II, October, Monsoon, and lowest 101mg/l, S-III, May, Summer season 2022. (Figure-8). TA Permissible limit ISI 2017,20,21 BIS,2012,14 200-600 mg/l.
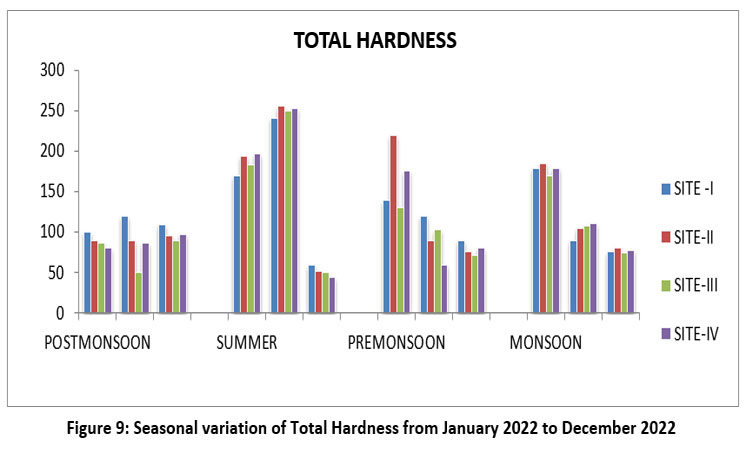 | Figure 9: Seasonal variation of Total Hardness from January 2022 to December 2022
|
Total Hardness is the presence of calcium and magnesium and the mineral content of the water. The highest 255 mg/l, site II, May, summer, and lowest 44 mg/l, S-IV, June 2022. (Figure-9). The permissible of Total Hardness limit is 200-600 mg/l according to WHO 2012,30 CPCB12, and ISI 2017,20,21 BIS (2017).11
Biological oxygen demand
BOD measures the amount of oxygen and the organic matter in water. The highest BOD, 8.7 mg/l, Site-II, May, summer, and lowest 4.5 mg/l, S-III, January, Post-monsoon 2022.(Figure-10). BOD Permissible limit 5mg/l (WHO 201715, BIS14, ISI,20,21 2017, EPA, 20 mg/l, 2024)31.
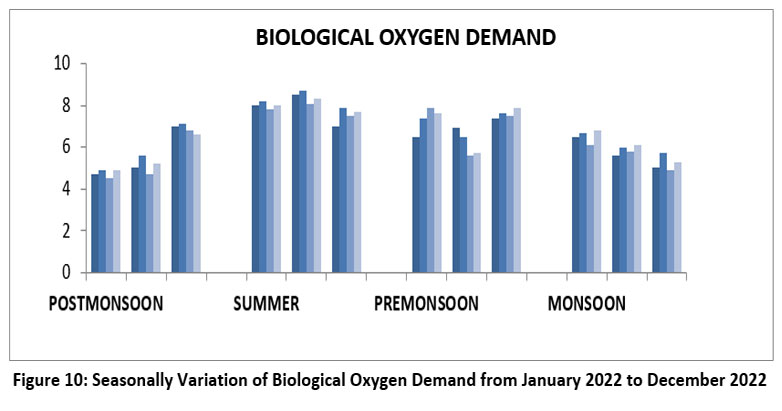 | Figure 10: Seasonally Variation of Biological Oxygen Demand from January 2022 to December 2022
|
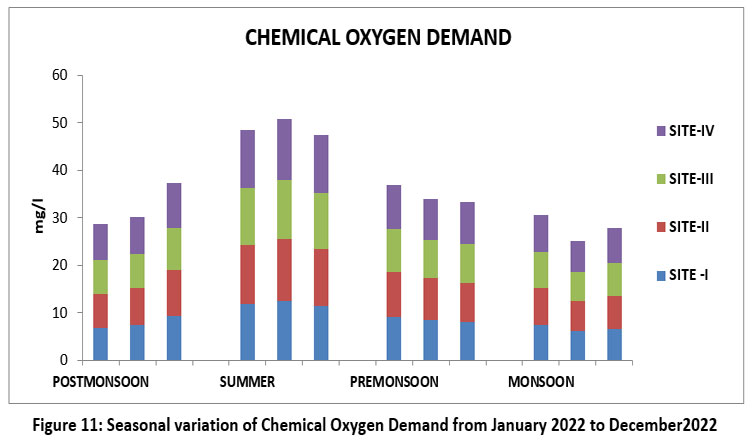 | Figure 11: Seasonal variation of Chemical Oxygen Demand from January 2022 to December2022
|
COD is a measure amount of oxygen required to organic and inorganic matter the indicator of water.33 The highest 12.9 mg/l, Site II, May, Summer and lowest 6.0 mg/l, S-III, November, Monsoon 2022 (Figure 11). Permissiblelimit20mg/l.
Nitrate
Nitrate is mainly comes through Fertilizers, and sewage and waste from other activities.34 The highest Nitrate value 8.6 mg/l, site II, September, Pre-monsoon and lowest 2.0mg/l, site-I, May, Summer2022. (Figure-12), Nitrate permissible limit 45 mg/l.
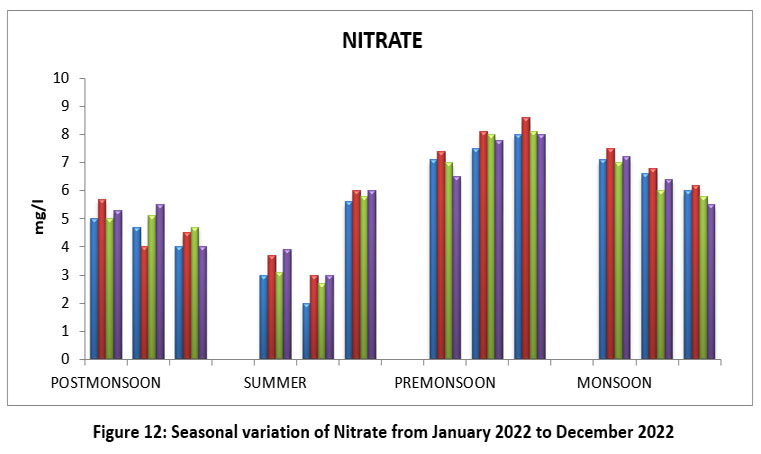 | Figure 12: Seasonal variation of Nitrate fromJanuary2022 to December 2022
|
Nitrite
Nitrite is a nitrogen compound, and it’s more the toxic humans and aquatic life. The highest Nitrite 0.9 mg/,l Site-II, April, monsoon season and lowest 0.0 mg/l, S-I, and III July, pre-monsoon 2022. (Figure-13), Nitrite permissible limit <1 mg/l (WHO 2017,15 ISI 2017,20,21 BIS,14 EPA, 2024).31
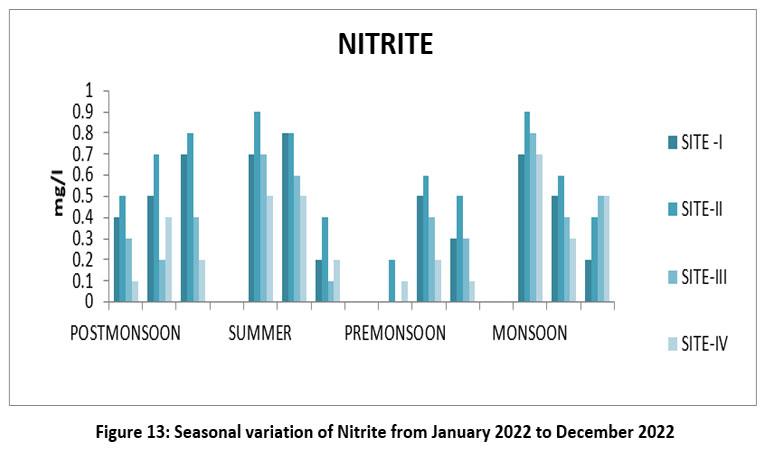 | Figure 13: Seasonal variation of Nitrite from January 2022 to December2022
|
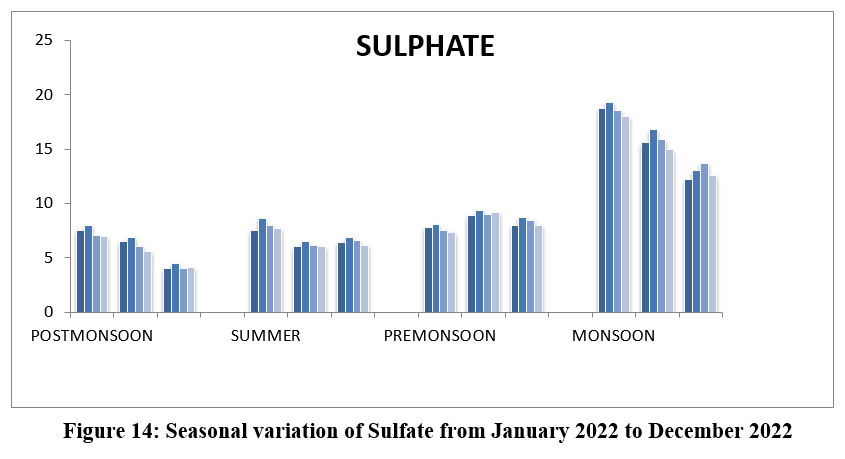 | Figure 14: Seasonal variation of Sulphate from January 2022 to December2022
|
Sulfate naturally occurring ion found in the soil, rocks and water, its supplies through the industrial discharge watering minerals, or agricultural runoff. The highest 19.3 mg/l, site II, October, Monsoon and lowest 4.0 mg/l, S-I, and III, March, Post-monsoon 2022. (Figure-14), Permissible limit 200 mg/l.
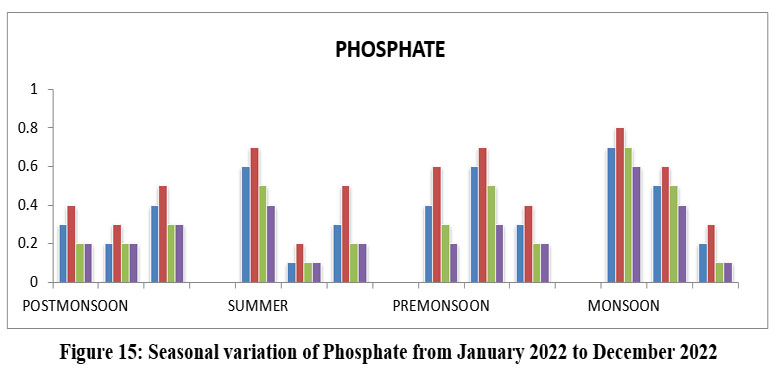 | Figure 15: Seasonal variation of Phosphate from January 2022 to December 2022
|
Phosphates are essential for growth of organisms and nutrients that its primary productivity of water, its key nutrient causing eutrophication to excess of algal growth. 72. High phosphate level to associate with organic pollution. The highest Phosphate 0.8 mg/l, Site-II, the October, Monsoon, and lowest 0.1mg/l, Site-I, III, and IV, May, and December, Monsoon 2022. (Figure-15), Phosphate permissible limit 0.5 WHO 201715, ISI 201720,21 BIS (2017)14.
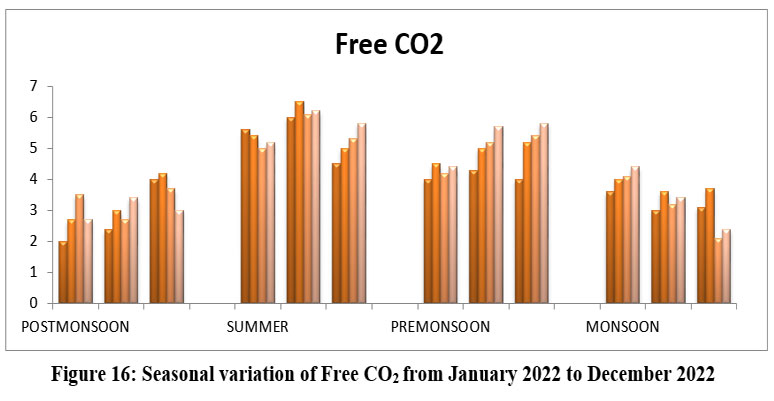 | Figure 16: Seasonal variation of Free CO2from January 2022 to December 2022
|
Free CO2, it might refer to avail for photosynthesis. The highest Free CO2 6.5, site -II, May, Summer and lowest 2.0 mg/l, S-I, January, Post-monsoon season 2022. Free CO2 Permissible limit < 15mg/l.
Statistical Analysis
The data collected on physicochemical parameters were analyzed using descriptive statistics to determine the mean and standard deviation and were visualized with bar charts. Seasonally study of all the parameters were pooled to get a single value representing the reservoir of the season, Additionally, one-way (ANOVA) test differences among parameters.(Table1).
Table 1: Physicochemical parameters analyzed and descriptive Statistic for the variations in ANOVA-(one-way) from Jan-2022-Dec-2022.
Physicochemical parameters | Highest (mg/l) | lowest | Mean± SD | F Value | P value |
PH | 8.2 | 6.0. | 7.089 ± .421 | 1.159 | .350 |
AT | 320C | 280C | 28.6458 ± 3.78 | 9.333 | .000 * |
WT | 360C | 200C | 26.583 ± 3.954 | 8.330 | 000* |
EC | 293 µs/cm | 96 µs/cm | 187 ± 50.647 | .206 | .999 |
DO | 8.20 | 3.6 | 6.14 ± 1.39 | 7.279 | 000* |
CL | 99.4 | 23 | 56.22 ± 17.4 | 3.754 | .001* |
TDS | 166 | 50 | 88.86 ± 34.72 | 4.933 | .000* |
TA | 235 | 101 | 163.47 ± 41.30 | 1.763 | .087 |
TH | 255 | 44 | 121.47 ± 59.04 | 585 | .865 |
BOD | 8.7 | 4.5 | 6.61 ±1.20 | 4.22 | .000* |
COD | 12.9 | 6.0 | 8.9 ± 2.10 | 21.588 | .000* |
NITRATE | 8.6 | 2.0 | 5.7 ± 1.69 | 6.693 | .000* |
NITRITE | .90 | .000 | .4438 ± .244 | 1.846 | .071 |
SULPHATE | 19.3 | 4.0 | . 9.233 ± 4.20 | 15.218 | .000* |
PHOSPHATE | .50 | .20 | .2917 ± .099 | 2.792 | .109 |
Free CO2 | .80 | .10 | .3667 ± .192 | 1.097 | .396 |
The physicochemical parameters for mean and Standard deviation of ANOVA (One-Way) test Significant P< 0.05 *(0.000) for the AT, WT, DO, CL, TDS, BOD, COD, Nitrate, Sulphate, for significant the season of parameters and other parameters non-significant P> 0.05.
Discussion
pH, Similar study, Gubi reservoir range 8.5 were increased Summer season with permissible limitof pH6.5 to 8.5,34 followed by Ghatuel et al.,35 Waldevi water is 7.3 to 8.4, it was maximum (May) summer season and minimum winter season(December),36 Godavari river. Similar reports show higher levels in the dry season,37 and a pH ranging from 5 to 8.5 is good for the planktons for both phytoplankton and zooplanktons and fish production.38 Same study was reported kshir Sagar,39 Tehri Dam.
Temperature,
Similar study Laharpur Dam, the water temperature high level summer and winter months lowest at all sites,40 Temperature, the reaction to climate change and their air temperature increasing, the surface water temperature in the world.41 The optimal temperature between 20 to 30 C is required for algae growth. Warmer water leads to increased algae growth. Similar result was observed by Aher et al, and Singh S, 36,42 Godavari river.
Electrical Conductivity,
Similar reports show higher, may and lower level dry season. Gubi and Waya Dam within acceptable range.43 The maximum EC during the summer season and low winter season reported by Pulugandi C,44 Vembakottai reservoir, the seasonal change same reported by Verma A.K, and Saksena D.N45 Kalpi reservoir, Gwalior.
DO
revealed that ranges 4.9 mg/L to 7.5 mg/L by Gourkar et al.,46 from Study of physicochemical parameters and correlationship of Kathani river, temperature was maximum summer season, allowing the plant photosynthesis for phytoplankton and fish production,47,48 Similar result, reporting that DO was 6.02–7.11 mg/l in the Oinyi River, Nigeria. The maximum DO was higher Summer season the ranged from 8.6 mg.l, reported by Godavarai river.49
Chloride
similar reported, increase in pre-monsoon season.2 Similar funding were reported by Kumar,50 CL ranges 45 mg/L to 140 mg/L from Physicochemical Purna River.
BOD
BOD is an important chemical parameter to the oxygen required to degradation of organic matter with the microbial activities. Similar result were reported by Kumar,50 BOD ranges between 1.9 mg/L to 4.9 mg/L from Water Quality Assessment of a River Using Physicochemical Parameters. Similar reported followed by BOD 3.2 to 8.5 mg/l Halai reservoir the high oxygen demand in dry season so the water temperature increase, the rate of decomposition increases, Batang reservoir51 BOD, was increase summer,52 that rainfall high in BOD.29,53
Chemical oxygen demand
Similar study, ranges from 6 to 9 for helathy water,54 Similar funding were observed by Gourkar et al.,46 COD ranges between 4.49 mg/L to 12.50 mg/L from Study of physicochemical parameters of Kathani river,26 The COD of water increases with increasing organic and inorganic matter, reported by Garg et al.,55 3 to 17 mg/l in Ramsagar Reservoir.
TDS
value increases because of human activity into the site. Similar result were observed by . TDS level increase and decreased the reported by many researcher.55,56,16 similar report in Kshir Sagar, Kolar reservoir, results were reported by 57, for Pus Dam, where the minimum values of total dissolved solids were observed in the winter and maximums in the summer months. Its Consists of inorganic salts and dissolved materials the 150 to 242 mg/l the maximum October and the minimum April, reported by 36,Godavari river. 55, Ramsagar reservoir.
Total Alkalinity
Similar reported,12 Maximum during monsoon season due to high productivity from planktons. Increases the alkalinity that are harmful to aquatic life. Similar study, Total Alkalinity the summer season high rate of photosynthesis.56 The maximum summer season (May) due to increased bicarbonates in the water reported by Sonawane.57 Ranged from 160 to 220 maximum summer and minimum August observed by Manjula and Warrier and Aher et al.,25, 36.
Total Hardness
A similar report indicated, during the high, dry season57,58 and increase summer and wet season higher level, Similar finding that the total hardness is minimum in Site B Maruda dam area as compared to the other two site. In river site the domestic activities perform by the neighbouring villagers that’s hardness of water may be increases, Similar result were reported by Tiwari.59 The ranged from 130 to 280 mg/l by Sharma et al.,60 and Waldevi dam ranged from 129 to 152 mg/l during the high level summer season and minimum value of monsoon reported by Manjula.25
Nitrate
Increase the monsoon season.61 Nitrate showed its presence in acceptable range. The presence of nitrate in aquatic source is due to surface water runoff, agriculture runoff and organic matter. Similar study, nitrate concentration varied from higher value (0.69±0.04 mg/l) was observed in monsoon season.62
Nitrite
observation was reported by Mishra63 the maximum vale monsoon and minimum recorded Post-monsoon reported by57.
Phosphate
Similar study reported, level of the Algal growth in a dam will be limited.64 It varied in the research from 0.17 to 0.25 mg/L. The study was undertaken65 in reveals the maximum values of the Phosphate (0.28 mg/l) is present in monsoon season, This helps to have significant growth of algae and eutropication.66 Simlar eported followed by Sonawane57 the phosphate high in monsoon season are mainly due to agriculture runoff, surface water runoff, washerman activity there increase inorganic phosphate content. The permissble limit of 0.025 to 2.5 mg/l WHO , 2012,30 standard for drinking water.67
Sulphate similar study was higher the monsoon season.68
Free CO2
Similar study, was the maximum summer season.69 Similar results were was observed high were summer and minimum winter, followed by the monsoon.70 found high levels of free CO2 (6.32) Ramsagar reservoir.55 Similar, the Free CO was found more during monsoon period and minimum during winter.71
In the Present study was discussed the monthly, seasonal and variation of the physicochemical parameters of Manjalar Reservoir.
Conclusion
In the Present study revealed the monthly, seasonal and variation of the physicochemical parameters of Manjalar Reservoir was analyzed. However, the variations in the parameters are within the acceptable limit recommended (WHO, APHA, BIS, ISI, 2017). The physicochemical parameters are essential for environmental sustainability, public health, and effective resource management. Manjalar reservoir regular monitoring for the safe use of quality of water for public use, irrigation purpose and fish culture management, other uses it’s suitable for drinking purposes.
Acknowledgement
The author would like to thank Madurai kamaraj university, Department of Environmental Studies, School of Energy, Environment & Natural Resources, Madurai-21, for providing the necessary resources, laboratory Facilities and support throughout the duration of this research work.
Funding Sources
The funding for this research was provided by the Adi-Trawader Scholarship (per year). Chemical support was provided by the Rashtriya Uchchatar Shiksha Abhiyan (RUSA), under the Ministry of Education, Government of India (Grant Number: F10172). RUSA contributed exclusively by providing chemical support through the Environmental Science Laboratory for this research work.
Conflicts of Interest
The authors do not have any conflict of interest.
Ethical Statement
This research did not involve human participants, animal subjects or any material that requires ethical approval.
Data Availability Statement
The manuscript incorporates all datasets produced or examined throughout this research study.
Ethics Statement
This research did not involve human participants, animal subjects, or any material that requires ethical approval
Informed Consent Statement
This study did not involve human participants, and therefore, informed consent was not required.
Permission to reproduce material from other sources
The Manjalar Reservoir water sample was collected with permission taken through the proper channel to the Tamil Nadu Water Board, Theni
Author contribution
Sudhanthira Lingammal Maruthalingam: Conceptualization, Writing, Editing, Original Draft,Data Collection and Analysis.
Suruli Kannan: The study was conceived and designed by and also provided valuable guidance throughout the data collection and analysis phases.
Karamurgan Sanjeevi: Author are contributed to the conception, design, and manuscript preparation.
Mathar Fathima Masoodu Mydeen: Involved in data analysis and interpretation of the manuscript.
All contributing authors approved the final version of the manuscript.
References
- Ferando and Oliveira EF, Goulart E, Mite-vera CV, Bra Journ of Bio, 2004, 64, (3A): 447-458.
CrossRef - Sarkar R, Ghosh AR, Mondal NK. Comparative study on physicochemical status and diversity of macrophytes and zooplanktons of two urban ponds of Chandannagar, WB, India. App Water Scie. 2020;10:63
CrossRef - Kar D. Wetlands and lakes of the world. Springer; 2013.
CrossRef - Rakesh sharma,and Ravichandran. Appraisal of seasonal variations in water quality of river Cauvery using multivariate analysis. Wat Sci. 2021;(3),5:49-62.
CrossRef - Trivedy RK, Goel. Chemical and biological methods for water pollution studies. Environmental Publication; 1986:231-232.
- Singh DK, Singh I. Interrelationship of certain physico-chemical parameters with plankton community of Motipur Ox-bow lakes (Muzaffarpur, Bihar). Enviro and Eco. 2008;(2),6:800-803.
- Sharma DK. Water quality analysis of the Tighra reservoir, Gwalior, Madhya Pradesh. Indian J. L. Sci. 2015;5(1):49-52.
- Jeffries M, Mills D. Freshwater Ecology. Principles and Applications. Belhaven Press; 2004:335-337.
- Anton-Pardo M, Hlavac D, Bauer C, Adamek. Environmental and biotic variables in carp (Cyprinus Carpio) ponds; Organic Vs. Conventional management. Intern Aqua. 2020;28(4):1621-1637. doi:10.1007/s104999-020-00547-8.
CrossRef - Bhat US, Pandit AK. Water quality assessment and monitoring of Kashmir Himalayan Freshwater Springs- A case study. Aquatic Eco Health & Manage. 2020;23(3):274-287. doi:10.1080/14634988.2020.1816771.
CrossRef - Manjare SA, Yadav, SA, Muley DV. Analysis of Water Quality Using Physico-chemical parameters Tamdalge tank in Kolhapur district, Maharashtra. Intern Journ of Advan Biotech and Res. 2013;1(2):115-1119.
- American Public Health Association (APHA). Standard Method for the Examination of Water Waste Water. 20th ed. Washington D.C. U.S.A.; 2005.
- Trivedy RK, Goel. Chemical and biological methods for water pollution studies. Environmental Publication; 1986:231-232.
- BIS. Indian Standards Specification for Drinking Water. IS: 10500. Bureau of Indian Standards; 2012.
- World Health Organization (WHO). Guidelines for drinking-water quality: Fourth edition incorporating the first addendum. World Health Organization; 2017. https://www.who.int/publications/i/item/9789241549950.
- Khan RM, Jadhav MJ, Ustad IR. Physico-chemical analysis of Triveni lake water of Amravati, district, M.P. India. Biosc Discovery. 2012;3(1):64-66.
- Gupta N, Pande P, Hussain J. Effect of physico-chemical and biological parameters on the quality of river water of Narmada, Madhya Pradesh, India. Joun Water Sci. 2017;31(1):11-23.
CrossRef - Zaghloul A, Saber M, Dewany CE. Chemical indicators for pollution detection in terrestrial and aquatic ecosystems. Bull Natl Res. Cent. 2019;43:156.
CrossRef - Yadav J, Priyanka, RK, Rathore J, Yadav A. Physico-chemical characteristics of Pahuj reservoir district Jhansi, Bundhkand region, central India. Int Res Gen Environ Sci. 2013;294-299.
- ISI 10500. Drinking water. 2017:16.
CrossRef - ISI: 10500. Indian standards of Drinking water Specification. Bureau toIndian Standards (BIS), New Delhi, India; 2012.
- Wetzel RG. Limnology. 5th ed. Academic Press; 2001.
- Manjare SA, Yadav, SA, Muley DV. Analysis of Water Quality Using Physico-chemical parameters Tamdalge tank in Kolhapur district, Maharashtra. Intern Journ of Advan Biotech and Res. 2013;1(2):115-1119.
- Thirupathaiah M, Sarvanthy C, Sammaiah C. Diversity of Zooplankton in Lower Manair Reservoir, Karimnagar, A.P., India. Intern Journ of Research jour of bio sciences. 2012;1(7):27-32.
- Manjula P, Warrier CU. Evaluation of water quality of Thuthapuzha Sub-basin of Bharathapuzha, Kerala, India. App Water Sci. 2019;9:70.
CrossRef - Harney NV, Dharmani AA, Andrew RJ. Seasonal variation in Physicochemical Parameters of Pindavani Pond of Central India. Journal. 2013;1(6). https://dJhingran VG. Fish and Fisheries of India. Hindustan Publishing Corporation; 1975:1-727.doi.org/10.3390/w15040680.
- irkey P, Bhattacharya T, Chakarborty S, Baraik S. Assessment of Ground water quality and associated health risks: A case study of Ranchi city, Jharkhand, India. App wat sci. 2017;7:1043-1067.
- Sharma S, Bhattacharya A. Drinking water contamination and treatment techniques. App wat sci. 2017;(7):1043-1067.
CrossRef - CPCB. Environmental Standards, Water Quality Criteria. Central Pollution Control Board, New Delhi, India; 2008.
- World Health Organization (WHO). Guidelines for drinking water quality. 3rd ed. World Health Organization; 2012:668.
- Environmental Protection Agency (EPA). Parameters of water quality: Interpretation and Standards. 2024;133.
- Ni M, Yuan L, Li M, Gu ZM. Assessment of water quality and Phytoplankton community of Limpeneaeus vannamei pond in intertidal zone of Hangzhou Bay, China. Aquaculture Reports. 2018;11:53-58. doi:1016/j.aqrep.2018.06.002.
CrossRef - Sharma S, Bhattacharya A. Drinking water contamination and treatment techniques. App wat sci. 2017;(7):1043-1067
CrossRef - Triupathi, RajeshKhatakho, Sabine Schuter, Mohammed Majdalawi, Analyse Ecosytem Evaluation of Waterquality in Gubi Reservior treatmaent plant in Bauchi State, Nigeria, Intern Journ Eng Rese and devlop,2016,12,(10):2278-800
- Ghatuel V.A, Chavre and Bhagwan H.K, An Investigation of Physico-chemical parameters of Waldevi Reservoir Nsaik, M.P, India. Intern Journ of Devlopm Research, 2017,Vol (07),08: 4634-14636.
- Aher Y.D, D.S Aher, and S.Y Aher, The limological study of Godavari river, Near Someshwar Nasik For HumanHelth Saftey and living organisms, Inter Journ of Research in Biosci and Agri and Techn, 2021, 17: 96-100.
- Adefemi OS, Awokunmi EE. Determination of physico-chemical parameters and heavy metals in water samples from Itaogoblu area of Ondo-State, Nigeria. African Jour of Env Sci and Techn. 2019;4(3):145-148.
CrossRef - Dixit AK. Study of physic-chemical parameters of different pond water of Bilaspur district, Chhattisgrah, India. Environ Skeptics and Critics. 2015;4(3):89-92.
- Ashok K. Agarwal and Govind S. Rajwar, 2010, Physico-Chemical and Microbiological Study of Tehri Dam Reservoir, Garhwal Himalaya, India, Journ of American Science,2010;6(6):65-71.
- Rangi kumari, Susan Mohar,Abhilasha Bhawasar and Ruchi Kumari, Saeaonal variation of water quality parameters of Laharpur dam, Bophal, Inter journ o Appli Res, 2025, 11,(4): 266-270.
- Kraemer BM, Anneville O, Chandra S, Dix M, Kuusisto E, Livingstone MD, Mclntyre PB. Morophometery and average temperature affect lake stratification responses to climate change. Geophysical Research letters. 2015;42(12):4981-4988. doi:10.1002/GL064097.
CrossRef - Sigh S, Seasonal variations in water quality of reservoir in Nigeria,Wat. Sci. 2017;6, (1):50–54.
- Umar, Kamfut Hasan, Kyari, Emmanuel Multafu, Mbaya, Yusf, Arhye, Assesssment of some physicochemical parameters of Gubi and Waya Reservoir in Bauchi state, Nigeri. Intern Journ of Scien and Techn Research, 2020, Vol 9,(02): 5719-5723.
- Pulugandi C, Analysis of water quality parameters in Vembakottai water reservior, Virudhunagar district, Tamilnadu A - Report, Res Journ of Recent Scie, 2014, Vol(3): 242-247.
- Verma A.K, and Saksena D.N, Assessment of water quality and pollution status of Kalpi (Morar) 3(1) river, Gwalior M.P, with special refernce to conservation and management plan, Asian Journ Exp.Bio. Sci, 2010, 2, 419-422.
- Gourkar AR, Rewatkar SB, Siddique MIM. Study of physicochemical parameters and correlationship among different parameters in water of Kathani River, Gadchiroli, Maharashtra. Internat Journ of Sci and Resech (IJSR). 2015:2319-7064.
- Baxa M, Musil M, Kummel M, Hanzlik P, Tesarova B, Pechar L. Dissolved deficits in shallow eutrophic aquatic ecosystem (fish pond)- Sediment oxygen demand and water column respiration alternately drive the oxygen regime. Sci of the Total Environ. 2021;766:142647. doi:10.1016/j.scitotenv.2020.142647.
CrossRef - McGaw I, Whiteley NM. Effects o acclimation and acute temperature change on specific dynamic action and gastric processing in the green shore crab, Carcinus meaneas. Journ of Therm Bio. 2012;37(8):570-578. doi:1016/j.therbio.2012.07.003.
CrossRef - Totowar and Tamlurkar, Physico-chemical parameters of Nizam Sagar Dam with respect to Fish Production. Intern Journ of Life Scie, 2017, Vol 5,(3):451-453.
- Kumar A. Water Quality Assessment of a River Using Physicochemical parameters. Journ of Environmet Scien and Health. 2020;38(1).
- Yee LT, Paka DD L, Isamil N, Emanag JJJ, , Water qality at Batangai hydrolectric reservoir (Sarwak, Malysia) and Implications for Aquaculture. Intern Jouurn of Aplie Scie and Techn, 2012, Vol 2, (6):23-30.
- Adefemi SO, Awokunmi EE. Physicochemical qualities of water from different sources in Ado-Ekiti, Nigeria. Jour of App Sci Res. 2010;6(11):1692-1698.
- Kadir A, Ali M, Hussain S. Impact of agricultural practices on water quality in river systems. Environmental Monitoring and Assessment. 2019;191(6):1-12.
- Ni M, Yuan L, Li M, Gu ZM. Assessment of water quality and Phytoplankton community of Limpeneaeus vannamei pond in intertidal zone of Hangzhou Bay, China. Aquaculture Reports. 2018;11:53-58. doi:1016/j.aqrep.2018.06.002.
CrossRef - Garg RK, Rao RJ, Uchchariya D, Shukla G. Seasonal variations in water quality and major threats to Ramsagar Reservoir, India. Afric Journ of Environme Scien and Techn. 2010;4(2):61-76.
- Pardeep S, Dwivedi HS. Water quality assessment of Kshir Sagar water body at Ujjain, Madhya Pradesh India. Int J Adv Res Biol Sci. 2016;3(8):28-35.
- Sonawane VY, Water quality of drinkig waters in Parbhani City. A case study, Journal of Chem and Pharma, Res., 2020, vol 2, (5):104-107.
- Mayer E. Monitoring pond water quality to improve production. Biomin. Published 2012. Accessed June 15, 2025. https://thefishsite.com/articles/monitoring-pond-water-quality-to-improve-production.
- Tiwari D. Assessment of Water Quality in terms of Total Hardness and Iron of some Freshwater Resources of Kanpur and its Suburbs. Nat Environ and Pollut Technology. 2012;11(2).
- Sharma A, Bora CR, Shukla V. Evaluation of Seasonal Changes in Physico-chemical and Bacteriological Characteristics of Water from the Narmada River (India) Using Multivariate Analysis. Natur Resour Research. 2013;22. doi:10.1007/s11053-013-9204-x.
CrossRef - Jorgensen S, Serenson BH. Drugs in the environment. Chemo. 2014;40(7):691–699.
CrossRef - Kumari S, Khan JA, Thakur MS, Lal H. Study of Physico-Chem-ical Characteristics of Water and Soil in Relations to Fish Production in Motia Lake Reservoir. J. Atmos Earth Sci. 2019;2:006.
- Mishra, Asha Lata Singh, and Dhanesh Tiwary,Studies of Physico-chemical Status of the Ponds at Varanasi Holy City under Anthropogenic Influences.,Intern Jour of Environm Rese and Develop .2014, Vol 4,(3): 261-268.
- Goldsmith B. Wandsworth lakes: Annual report on lake monitoring and management 2017. Google Scholar; 2018.
- Omoigberale MO, Ogbeibu AE. Assessing the Enviornmental impacts of oil Exploration and production on the Water quality of Osse River, Southern Nigeria. Glob Journ of Environ Sci. 2007;6(1):1-13.
CrossRef - Nama P, Raj D. Water quality assessment using physico-chemical parameters of palasani pond, Jodhpur district, Rajasthan, India. Intern Journ of Resech and Analy Review. 2018;5:2349-5138.
- Amankwaah D, Cobbina SJ, Tiwaa YA, Bakobie N, Millicent EAB, Assessment of pond effluent on water quality of the Asupfia Stream, Ghanna. African Journ of Environ Scien and Techn, 2014,Vol 8,(5), pp 306-311.
CrossRef - Enuneku A, Ezemonye LI, Adibedi F. Heavy metal concentrations in surface water and bioaccumulation in fish (Clarias gariepinus) of River Owan, Edo State, Nigeria. Europ Inter Journ of Sci and Tech. 2013;2(7):31-39.
- Mokappa Naik CK, Kousar H. Evaluation of water quality of Padavagodu tank, Sagar Taluk, Karnataka, India. Intern journ of Nature Environ Pollut Tech. 2012;11(3):481-484.
- Garg RK, Rao RJ, Saksena DN. Water quality and conservation management of Ramasagar rerevior, Madhya Pradesh. Jenviron Bio. 2009; 30,(5):909-916.
- Sharma DK. Water quality analysis of the Tighra reservoir, Gwalior, Madhya Pradesh. Indian J. L. Sci. 2015;5(1):49-52.
Abbreviation list
AT- Atmospheric temperature,
WT- Water temperature,
EC- Electrical Conductivity,
TDS – Total dissolved Solids,
TA-Total Alkalinity,
TH- Total hardness,
DO- Dissolved oxygen,
BOD- Biological oxygen demand,
COD- Chemical oxygen Demand.


