Tree Biomass and Carbon Stock Variations between Riparian and Terrestrial Forests in Central Himalaya
Kavita Joshi
*
 , Deepa Rana
and Jeet Ram
, Deepa Rana
and Jeet Ram
1
Department of Forestry,
D.S.B. Campus, Kumaun University Nainital,
Uttarakhand
India
http://dx.doi.org/10.12944/CWE.20.2.23
Copy the following to cite this article:
Joshi K, Rana D, Ram J. Tree Biomass and Carbon Stock Variations between Riparian and Terrestrial Forests in Central Himalaya. Curr World Environ 2025;20(2). DOI:http://dx.doi.org/10.12944/CWE.20.2.23
Copy the following to cite this URL:
Joshi K, Rana D, Ram J. Tree Biomass and Carbon Stock Variations between Riparian and Terrestrial Forests in Central Himalaya. Curr World Environ 2025;20(2).
Download article (pdf)
Citation Manager
Publish History

Introduction
Forest ecosystems are one of the most important types of ecosystems in terms of global carbon budget.1-6 An essential ecological component in evaluating carbon sequestration and the efficiency of carbon sinks is biomass, a basic quantitative characteristic of ecosystems. Riparian forests are vital components of terrestrial landscapes as they host both flood-tolerant species and species migrating from nearby uplands, making them key contributors to the region's overall plant biodiversity.7 The riparian forest vegetation is impacted by the species colonization process, stages of vegetation succession, and site disturbances.8 Seasonal variations in weather induce frequent disruptions like floods, which alter flow patterns locally and create a diverse mosaic of biological communities and landforms 9,10
Riparian forests along the rivers in the Himalayan region are predominantly composed of early- to mid-succession plant communities, reflecting their dynamic successional status and frequent exposure to natural and anthropogenic disturbances.11,12 The low water level during the winter and summer periods provides the time for regeneration of plant species that are eroded during the monsoon period, when huge amounts of water from the high water level create an early successional condition for vegetation growth. The Himalayan riverine/riparian forests consist of several plant communities encompassing Drypetes roxburghii–Toona ciliata, Acacia catechu, Dalbergia sissoo in Himalayan foothills, Alnus nepalensis, Macaranga pustulata, Duabanga grandiflora–Terminalia myriocarpa in the eastern part of Himalaya, Debregeasia hypoleuca, Hippophae salicifolia, Populus ciliata, and Salix species, etc, at higher elevations.13-15 Riparian forests preserve a lot of carbon since they develop quickly. Knowing how much carbon they preserve can help figure out how much bioenergy might be made in rural regions. The growing biomass sector is really making people throughout the world rethink the many natural sources of energy that exist. People are presently more interested in the biomass potential production from riparian forests than they were before, when it was mostly ignored since it was thought to be of inferior quality.16 Riparian forests play a vital role in carbon cycling, though their biomass and carbon stocks are often lower than adjacent terrestrial forests due to frequent disturbances and hydrological variability.17 In tropical regions, above-ground biomass in riparian forests can range from 40 to 80 Mg/ha, with corresponding carbon stocks typically comprising about 45–50% of total biomass.18 Large tree mortality rates, increased wind turbulence, and microclimatic changes all affect the pattern of aboveground biomass (AGB) in fragmented forest patches, and forest edges, i.e., riparian zones, are especially susceptible to these effects. These edge-related disturbances have the potential to substantially alter carbon cycling processes, which may decrease the capacity to store carbon in these forested areas and overall sequestration potential.19
To measure biomass and carbon stocks in diverse Himalayan Forest zones, numerous studies have been carried out by different researchers.20-22 However, there is very little or no information available on Himalayan riverine forest biomass, especially the riparian vegetation. So, this investigation was done to find out the biomass and carbon stock of the riparian and nearby land forests along the Sharda River in the Central Himalayan area.
Material and Methods
Study area
The present investigation area is located at 29o06’58” N-29o06’59” N Latitude and 80o09’33” -80o09’37” E longitude at an elevation of 260-290 m asl. The study area was divided into two vegetation types, Riparian Forest (along the river bank) and terrestrial forests (away from the river bank), based on distance from the active river channel.
The climate of study area varies from Sub-tropical monsoon type (hot summer followed by summer monsoon and mild winter) to tropical type (mild and dry winter, warm, dry, and wet summer). The lower Sharda Basin experiences an extremely humid subtropical climate with dry winters, with temperatures reaching up to 40 °C during summers. The winter season (mid-October to mid-March), temperatures generally range between 20 °C and 30 °C, accompanied by prevailing western winds. The region receives approximately 1000 mm of annual rainfall, with nearly 90% occurring during monsoon season, which extends from mid-June to September NASA official website.23 (Fig. 1). The climatic data was obtained through NASA official website.23 Geologically, the riparian forest is poor in soil quality because it washed away during monsoon flooding, and the stone and boulder remain on the edge of the river.
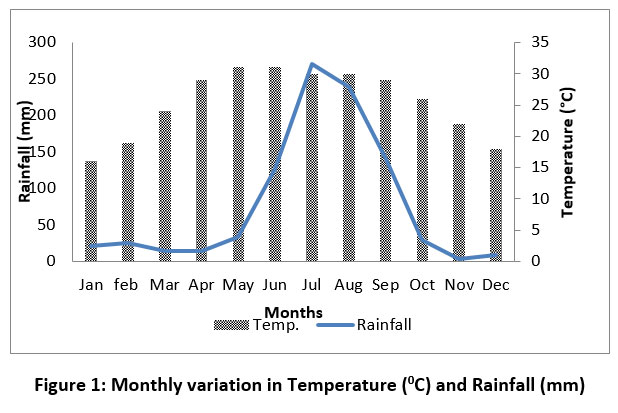 | Figure 1: Monthly variation in Temperature (0C) and Rainfall (mm).
|
Sampling design
After thorough reconnaissance of the area in the riparian and adjacent terrestrial forest, 3 sites were selected in each forest for the analysis of vegetation and biomass. The study was conducted during 2023-2024 in both forests. Ten randomly placed samples of 10 × 10 m were established at each site. Tree vegetation was assessed in the 10 × 10 m quadrats following Mishra24 and Saxena and Singh.25 The vegetation Characteristics were analysed for density, frequency, and abundance following Curtis and McIntosh.26 The distribution pattern of the species was figured out by looking at the proportion of abundance to frequency. The Abundance-frequency (A/F) ratio was figured out following Whitford.27 Circumference at breast height (cbh) was taken to determine total tree basal area (TBA) and measured as nr2, here r is radius. Vegetation cover was taken for the determination of dominance for shrubs and herbs. The total TBA was measured by multiplying mean basal area and density of the species. The Importance Value Index (IVI) was found by adding together the relative density, relative frequency, and relative abundance.28
Vegetation Analysis
Species richness (SR) has been denoted by total number of species present in each community or number of species per unit area.29 Margalef’s species richness index is determined following Margalef’s.30
![]()
Here, “S” denotes total no. of species, & “N” is total no. of individuals of all species.
Species diversity was calculated following the Shannon–Wiener31 as
![]()
Here “ni” denotes no. of individual species & “n” denotes total no. of all species in that forest.
Species evenness had measured after Pielou's32 as
![]()
Here, “H” denotes Shannon Wiener diversity, & “S” denotes total no. of species in forest.
Concentration of Dominance was measured by following the Simpson33 as
![]()
Here, “ni” denotes no. of individuals of each species & “N” denotes total no. of all species
Biomass and Carbon estimation
Tree biomass was measured using a non-harvesting method. All individual trees along a circumference greater than 30 cm were noted, and CBH (1.37 m above the ground) was recorded in the sampled quadrats. To estimate the biomass of various tree components (bark, bole, leaves, branch twig, lateral root, stump root, and fine root), previously established allometric equations developed for species and interspecific (Y = a + bX for Dalbergia sissoo; Y = a + bY ln X: for inter-species;) where, Y= dry weight of component (kg per tree), X= cbh (cm), a = the intercept and b = slope of regression ln = natural log) were used (table 1).34,35
Table 1: Allometric relationship 1 between the biomass of tree components (Y, kg tree- 1 ) and GBH (X, cm) for different species
Species | Component | a | B | Reference |
Dalbergia sissoo | Bole | -11.0369 | 3.6005 | Lodhiyal and Lodhiyal, 200334 |
Branch | -2.2528 | 0.7201 | ||
Twig | -0.9702 | 0.3168 | ||
Leaf | -1.1037 | 0.36 | ||
Reproductive parts | -0.3088 | 0.1008 | ||
Stump roots | -2.1194 | 0.6914 | ||
lateral roots | -1.4529 | 0.475 | ||
fine roots | -0.612 | 0.2012 | ||
Interspecies for Sal Forest | Bole | -5.03 | 2.33 | Rana et al 198935 |
Branch | -5.21 | 2.08 | ||
Twig | -4.63 | 1.68 | ||
Leaf | -4.96 | 1.68 |
We figured out the carbon (C) by multiplying the biomass value of a forest component by the conversion ratio 0.475.36,37 We expected the C of the forest at each site to be the sum of the carbon values of all the tree parts. The data were statistically analysed for ANOVA using MS Excel, PAST-4.0, and IBM-SPSS 16.0 version for vegetation characteristics and forest biomass between riparian and terrestrial forest. Standard error was also calculated for each studied parameter of both riparian and terrestrial forests.
Results
A total of 17 tree species were observed in both the forest sites, of which 5 tree species were restricted to the riparian forest, while 7 species were restricted to the terrestrial forest. However, 5 tree species were common in both the riparian and the terrestrial forests. The tree density was varied from 286.67+50.33 to 343.33+41.63 ind/ha in riparian and terrestrial forest, respectively. The TBA was 6.31+2.71 m2/ha in riparian forest, while 13.9+0.57 m2/ha in terrestrial forest, and significantly higher for (p<0.05) terrestrial forest. The species diversity ranged between 2.16+0.07 and 2.46+0.13 in riparian and terrestrial forest, respectively, and was significantly higher (p<0.05) in terrestrial forest in comparison to riparian forest. In contrast to this, Concentration of dominance is significantly higher (p<0.05) in riparian forest (Table 2).
Table 2: Vegetation characteristics and biomass in riparian and terrestrial forest
Parameter | Riparian Forest | Terrestrial Forest | F | p value |
Tree Species richness | 6 | 6.3+0.6 | 1 | NS |
MI | 3.4+0.2 | 3.5+0.3 | 0.02 | NS |
E | .81+0.03 | .92+0.01 | 34 | 0.004 |
D (ind/ha) | 286.7+50.3 | 343.3+41.6 | 2.26 | NS |
TBA (m2/ha) | 6.3+2.71 | 13.9+0.6 | 22.53 | 0.01 |
H | 2.2+0.07 | 2.5+0.13 | 12.42 | 0.02 |
Simpson Index (CD) | 0.3+0.03 | 0.2+0.01 | 15.56 | 0.012 |
Biomass and Carbon stock | ||||
Total tree biomass (Mg ha-1) | 54.4+24.11 | 95.8+6.6 | 8.25 | 0.05 |
Total biomass Carbon (Mg ha-1) | 23.30+13.5 | 45.5+3.1 | 7.65 | 0.05 |
(MI: Margalef’s Index; E: Evenness; D: Density; TBA: Tree Basal Area; H: Species diversity; CD: Concentration of Dominance)
The tree biomass varied from 54.4+24.11 to 95.8+6.6 Mg ha-1 in riparian and terrestrial forest, respectively, and it was significantly higher (p<0.05) in the terrestrial forest. The carbon stock varied from 23.30+13.5 to 45.5+3.1 Mg ha-1 in riparian and terrestrial forest, respectively, and was significantly higher (p<0.05) for the terrestrial forest as compared to riparian forests (Table 2).
In the riparian forest, total biomass was 157.47 Mg ha-1, in which Dalbergia sissoo was the most dominant biomass-producing tree species with 82.75 Mg ha-1 biomass, followed by Acacia catechu (24.63 Mg ha-1) and Terminalia elliptica (21.11 Mg ha-1), while other species aggregately 28.98 Mg ha-1 biomass. Similarly, total carbon stock of trees in riparian forest was 71.65 Mg ha-1 in which Dalbergia sissoo constituted maximum carbon stock (36.16 Mg ha-1) followed by Acacia catechu (11.69 Mg ha-1) and Terminalia elliptica (10.03 Mg ha-1) while other species constituted a total of 13.77 Mg ha-1 carbon stock (table: 3).
Table 3: Tree Biomass and carbon stock in riparian and terrestrial forests
Study sites | Species | AGB | BGB | Total tree Biomass | AGC | BGC | Total biomass carbon stock |
Riparian Forest | |||||||
Dalbergia sissoo | 65.67 | 17.08 | 82.75 | 27.79 | 8.37 | 36.16 | |
Acacia catechu | 17.78 | 6.85 | 24.63 | 8.45 | 3.24 | 11.69 | |
Terminalia elliptica | 15.24 | 5.87 | 21.11 | 7.24 | 2.79 | 10.03 | |
Other species | 20.91 | 8.07 | 28.98 | 9.95 | 3.82 | 13.77 | |
Total | 119.6 | 37.87 | 157.47 | 53.43 | 18.22 | 71.65 | |
Terrestrial Forest | |||||||
Mallotus philippensis | 55.89 | 19.87 | 75.76 | 26.54 | 9.5 | 36.04 | |
Schleichera oleosa | 54.83 | 20.76 | 75.59 | 26.04 | 10.02 | 36.06 | |
Cassia fistula | 26.58 | 10.24 | 36.82 | 12.63 | 4.87 | 17.5 | |
Other species | 71.34 | 27.46 | 98.8 | 39.23 | 15.11 | 54.34 | |
Total | 208.64 | 78.33 | 286.97 | 104.44 | 39.5 | 143.94 |
(AGB: Above ground Biomass; BGB: Below ground Biomass; all values are in Mg ha-1)
In the terrestrial forest, the total biomass was 286.97 Mg ha-1, in which Mallotus philippensis was observed to be the most dominant biomass-producing tree species with 75.76 Mg ha-1 biomass, followed by Schleichera oleosa (75.59 Mg ha-1) and Cassia fistula (36.82 Mg ha-1), while other species contain a total of 98.8 Mg ha-1 biomass. Similarly, total carbon stock of trees in terrestrial forest was 143.94 Mg ha-1, in which Schleichera oleosa constituted maximum carbon stock of 36.06 Mg ha-1 followed by Mallotus philippensis (36.04 Mg ha-1) and Cassia fistula (17.5 Mg ha-1) while other species constituted a total of 54.34 Mg ha-1 carbon stock (table: 3).
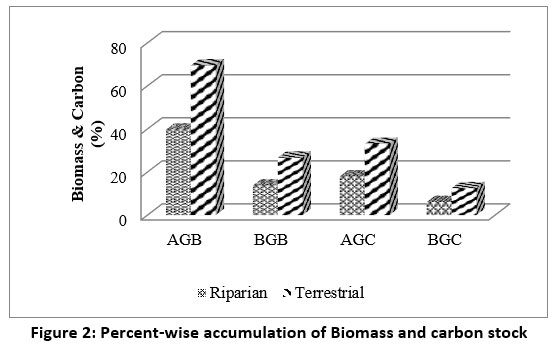 | Figure 2: Percent-wise accumulation of Biomass and carbon stock
|
In riparian forest, trees constitute 75.95% above-ground (AG) and 24.05% below-ground (BG) biomass, in which maximum biomass accumulation was shown by Dalbergia sissoo (52.55%), followed by Acacia catechu (15.64%) and Terminalia elliptica (13.41%). Similarly, in terrestrial forest, trees constitute 72.58% above-ground and 27.42% below-ground biomass, in which maximum biomass accumulation was shown by two species, Schleichera oleosa (26.41%) and Mallotus philippensis (26.41%), followed by Cassia fistula (12.81%) (fig: 2). A similar trend of Carbon stock was also observed in both terrestrial and riparian forests.
Discussion
The forest ecosystem can accumulate carbon in a variety of ways. Trees, bushes, herbs, forbs, roots, litter, and soil organic carbon stocks are examples of both aboveground and belowground biomass.38 Approximately 80% and 40% of the total terrestrial aboveground and belowground carbon storage, respectively, is derived from forest ecosystems.39 So, estimations of how much carbon is stored in forests might help with national carbon budget calculations.40 Researchers have figured out the carbon budgets for many ecosystems, encompassing tropical, subtropical, temperate, and boreal forest ecosystems, at the local, regional, and national levels.41-44 Tropical forests constitute a critical component of the terrestrial biosphere, accounting for approximately 40% of the global terrestrial biomass carbon stock.45 Biomass production in riparian forest is shaped by multiple environmental drivers, including climatic conditions, hydrological regimes (water availability), topographical features (e.g., slope, elevation), and the age structure of vegetation communities.46
Comparative analysis of species richness for tree layers indicates that it was slightly higher in the terrestrial forest than in the riparian forest. In contrast to biological corridors, such as riparian forests, terrestrial zones also exhibit greater density & diversity, as shown by relatively higher Shannon index values and lower Simpson index values. The observed tree density was lower than reported by Sharma et. al.47 for Khair-sissoo mixed forest, Garhwal Himalaya, Iqbal et al.48 for Khoh river, Garhwal Himalaya, and Aziem et al.49 for Bhilangana valley, Garhwal Himalaya. The total tree basal area (TBA) was lower than that documented in previous studies in riparian forests Tripathi et al.50 for Katerniaghat Wildlife Sanctuary, Iqbal et al.48 for Khoh River. Species diversity was lower than reported by Aziem et al.49 for Bhilangana valley, Sunil et. al.51 for Cauvery River, South India. The higher vegetation characteristics reported in other studies are due to the large extent of vegetation area, as compared to the present study, as the area of riparian vegetation might vary from one river to another.
This may also be due to the periodic flooding and frequent anthropogenic pressure, which hinders the establishment and growth of trees, and insufficient nutrient availability may be the reason for lower vegetation characteristics in the riparian forest.
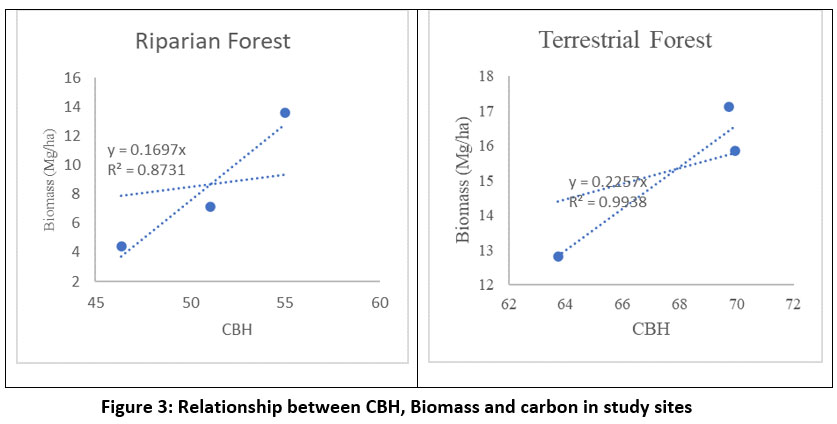 | Figure 3: Relationship between CBH, Biomass and carbon in study sites
|
The relationship between CBH, and Biomass in terrestrial forest depicts a strong relationship (R2= 0.99) while, in riparian forest biomass increases moderately with CBH (R2= 0.87) (Fig: 3. A, B), this may be due to periodic disturbances and fragmented habitat, which hinders the growth of trees in riparian forests.
This current investigation indicates that biomass and carbon stock in riparian forests are lower than those reported in previous studies, Rana et. al.35, Sundariyal et. al.52, Ramchandran et. al.53, Lodhiyal et. al.54, and Shahid and Joshi55 however, it slightly corresponds with Joshi et al.55 in tropical forest ecosystems (table: 4). This disparity may be attributed to the structural characteristics of the riparian forests, which are typically characterized by more open canopies and lower tree densities. Additionally, riparian forests are subject to periodic flooding, erosion, and sediment deposition, leading to spatial fragmentation and reduced forest continuity. These areas are also more frequently impacted by anthropogenic disturbances. In contrast, the adjacent terrestrial forests exhibited comparatively higher biomass and carbon stock, this higher biomass may be explained by the dominance of mid- to late-successional species. The presence of more stable and nutrient-rich soils and reduced exposure to physical disturbances supports the high biomass and carbon stock in terrestrial forests relative to the riparian zones.
Table 4: Comparative analysis of Biomass and Carbon Stock
Forest types | Biomass (t ha-1) | Carbon stock (t ha-1) | References |
Sal seedling coppice forest (Central Himalaya) | 455+3.1 | - | Rana et al 198934 |
Malay Watershed, Sikkim Himalaya | 362.01+37.9 | - | Sundariyal et al 199452 |
Deciduous and evergreen forest | 251.7-307.3 | 125.8-153.7 | Ramchandran et al., 200753 |
Central Himalaya Shisham Forest | 50.3+2.46-122.7+3.14 | - | Lodhiyal et al 200254 |
Moist deciduous forest, Doon Valley | 338.4-438.2 | 169.7-219.1 | Shahid and Joshi 201555 |
Community Forest, Nepal | 163.07-347.06 | 76.64-163.12 | Joshi et. al. 202156 |
Tropical Riparian Forest & adjacent terrestrial mix forest, Central Himalaya | 157.47-287.42 | 71.65-136.54 | Present study |
Riparian forests are particularly vulnerable due to their unique ecological conditions and the pressures from human activities like river regulation, land conversion, and unsustainable forestry practices. Effective conservation requires the integration of sustainable management approaches, legal protection, and the involvement of local communities and stakeholders.57,58
Conclusion
There is a significant difference between riparian and terrestrial forests in tree diversity, biomass, and carbon stock. The terrestrial forest is conservative for all the vegetative parameters. These differences are primarily driven by natural and anthropogenic disturbances in riparian forests, as well as site-specific environmental factors. Despite their lower biomass and carbon stocks, riparian forests remain ecologically significant, serving as vital biodiversity refugia and playing a crucial role in regional carbon dynamics. Recognizing the ecological and functional value of riparian forests is essential for effective conservation, land-use planning, and climate change mitigation. There is an urgent need to prioritize their conservation through improved management practices and the application of evidence-based, scientific interventions.
Acknowledgement
The Authors are grateful to Uttarakhand Forest Department for granting permission to work in forest area. Authors are also Thankful to Head, Department of Forestry, Kumaun University, Nainital for providing necessary resources and support for this study.
Funding Sources
The authors received no financial support for the research, authorship, and/or publication of this article.
Conflict of Interest
The authors do not have any conflict of interest.
Data Availability Statement
The data support the findings of this study is available from the corresponding author upon reasonable request.
Ethics Statement
This research did not involve human participants, animal subjects, or any material that requires ethical approval.
Informed Consent Statement
This study did not involve human participants, and therefore, informed consent was not required.
Permission to reproduce material from other sources
Not Applicable
Author Contributions
Kavita Joshi: Conceptualization, Methodology, Writing – Original Draft, editing
Deepa Rana: Data Collection, Analysis.
Jeet Ram: Review, Visualization, Supervision
Reference
- IPCC, I. P. O. C. C. THE IPCC. Guidelines for national greenhouse gas inventories, prepared by the national green-house gas inventories programme. (2006).
- Pan, Y., Birdsey, R. A., Phillips, O. L., & Jackson, R. B. The structure, distribution, and biomass of the world's forests. Annual Review of Ecology, Evolution, and Systematics, (2013). 44(1), 593-622.
CrossRef - Fahey, T. J., Woodbury, P. B., Battles, J. J., Goodale, C. L., Hamburg, S. P., Ollinger, S. V., & Woodall, C. W. Forest carbon storage: ecology, management, and policy. Frontiers in Ecology and the Environment, (2010). 8(5), 245-252.
CrossRef - Piao, S., Fang, J., Ciais, P., Peylin, P., Huang, Y., Sitch, S., & Wang, T. The carbon balance of terrestrial ecosystems in China. Nature, (2009). 458(7241), 1009-1013.
CrossRef - Li, S., Su, J., Liu, W., Lang, X., Huang, X., Jia, C., & Tong, Q. Changes in biomass carbon and soil organic carbon stocks following the conversion from a secondary coniferous forest to a pine plantation. PLOS one, (2015). 10(9), e0135946.
CrossRef - Aishan T, Betz F, Halik Ü, Cyffka B, Rouzi A. Biomass Carbon Sequestration Potential by Riparian Forest in the Tarim River Watershed, Northwest China: Implication for the Mitigation of Climate Change Impact. Forests. 2018; 9(4):196. https://doi.org/10.3390/f9040196
CrossRef - Pither, R., & Kellman, M. Tree species diversity in small, tropical riparian forest fragments in Belize, Central America. Biodiversity & Conservation, (2002). 11, 1623-1636.
CrossRef - Pollock, M. M., Beechie, T. J., Chan, S. S., & Bigley, R. Monitoring restoration of riparian forests. Monitoring stream and watershed restoration. American Fisheries Society, Bethesda, Maryland, (2005). 67-96.
- Giese, L. A. B., Aust, W. M., Kolka, R. K., & Trettin, C. C. (2003). Biomass and carbon pools of disturbed riparian forests. Forest Ecology and Management, 180(1–3), 493–508. https://doi.org/10.1016/S0378-1127(02)00644-1.
CrossRef - Recchia, C. A., Mello, J. M., Guimarães, D. P., Leite, H. G., Silva, A. M., & Martins, F. S. (2010). Biomassa e estoque de carbono em fragmentos de floresta estacional semidecidual em Lavras, MG. Revista Árvore, 34(1), 65–73. https://doi.org/10.1590/S0100-67622010000100008
CrossRef - Mohan, N. S., et al. "Disturbances on Riparian Vegetation: A Comprehensive Review." International Journal of Research and Review, (2024). 11(4), 19–30.
CrossRef - Tiwari, V., & Sharma, R. C. "Riparian Plant Diversity in the Watershed of Nachiketa Tal, Garhwal Himalaya." Journal of Mountain Research (2018)., 13, 1–7
- Champion, H. G., & Seth, S. K. A revised survey of the forest types of India. Manager of publications (1968).
- Rawat, G. S. 12 The Himalayan Vegetation along Horizontal and Vertical Gradients. Bird migration across the Himalayas: Wetland functioning amidst mountains and glaciers, (2017). 189.
CrossRef - Bisht S, Bargali SS, Bargali K, Rawat YS and Rawat GS Dry matter dynamics and carbon flux along riverine forests of Gori valley, Western Himalaya. Front. For. Glob. Change (2023) 6:1206677.
CrossRef - Christiano, R. C. S., Pereira, M. G., Gama-Rodrigues, E. F., & Gama-Rodrigues, A. C. Carbon and nutrient stocks in soils under different land uses in the Atlantic Forest region of Brazil. Revista Brasileira de Ciência do Solo, (2013). 37(5), 1236–1246. https://doi.org/10.1590/S0100-06832013000500018
CrossRef - Mukul, S. A., Herbohn, J., & Firn, J. Tropical secondary forests regenerating after shifting cultivation in the Philippines: Biomass accumulation and carbon pools. Ecological Indicators, (2016). 66, 10–17.
CrossRef - Chaturvedi, R. K., Raghubanshi, A. S., & Singh, J. S. Carbon density and accumulation in woody species of tropical dry forest in India. Forest Ecology and Management, (2012). 263, 203–210.
- Salo, J., Kalliola, R., Hakkinen, 1., Makinen, Y., Niemela, P., Puhakka, M., and Coley, P. D. 'River dynamics and the diversity of Amazon lowland forests', Nature, 1986 322, 254-258.
CrossRef - Gairola, S., Sharma, C. M., Ghildiyal, S. K., & Suyal, S. Chemical properties of soils in relation to forest composition in moist temperate valley slopes of Garhwal Himalaya, India. The Environmentalist, (2012). 32(4), 512-523.
CrossRef - Sharma, C. M., Baduni, N. P., Gairola, S., Ghildiyal, S. K., & Suyal, S. Tree diversity and carbon stocks of some major forest types of Garhwal Himalaya, India. Forest Ecology and Management, (2010). 260(12), 2170-2179.
CrossRef - Sharma, C. M., Mishra, A. K., Tiwari, O. P., Krishan, R., & Rana, Y. S. Regeneration patterns of tree species along an elevational gradient in the Garhwal Himalaya. Mountain Research and Development, (2018). 38(3), 211-219.https://power.larc.nasa.gov accessed on 16.02.2025
CrossRef - Misra, R. Ecology workbook. Scientific publishers. (1968).
- Saxena, A. K., & Singh, J. S. Tree population structure of certain Himalayan forest associations and implications concerning their future composition. Vegetatio, (1984). 58(2), 61-69.
CrossRef - Curtis, J. T., & Mcintosh, R. P. (1950). The interrelations of certain analytic and synthetic phytosociological characters. Ecology, 31(3), 434-455.
CrossRef - Whitford, P. B. Distribution of woodland plants in relation to succession and clonal growth. Ecology, (1949). 30(2), 199-208.
CrossRef - Phillips, E. A.,. Methods of vegetation study. Henry Holt & Co. Inc. (1959). 107 pp.
- Whittaker, R. H. Dominance and Diversity in Land Plant Communities: Numerical relations of species express the importance of competition in community function and evolution. Science, (1965). 147(3655), 250-260.
CrossRef - Margalef, R., Perspectives in ecological theory. University of Chicago Press, (1968). Chicago
- Shannon, C. E., & Weiner, W. The mathematical theory of communication Urban University Illinois Press. (1963). 125pp.
- Pielou, E. C. Ecological models on an environmental gradient. Applied Statistics (Gupta, RP, ed.), (1975). 261-269.
- Simpson, E. H. Measurement of diversity. nature, (1949). 163(4148), 688-688.
CrossRef - Lodhiyal, N., & Lodhiyal, L. S. (2003). Biomass and net primary productivity of Bhabar Shisham forests in central Himalaya, India. Forest Ecology and Management, 176(1-3), 217-235.
CrossRef - Rana, B. S., Singh, S. P., & Singh, R. P. Biomass and net primary productivity in Central Himalayan forests along an altitudinal gradient. Forest ecology and management, (1989). 27(3-4), 199-218.
CrossRef - Magnussen, S., & Reed, D. (2004). Modeling for estimation and monitoring. Knowledge reference for national forest assessments, (2004) 111.
- IPCC, I. P. O. C. C. THE IPCC. Guidelines for national greenhouse gas inventories, prepared by the national green-house gas inventories programme. (2006).
- Malhi, Y. Carbon in the atmosphere and terrestrial biosphere in the 21st century. Philosophical Transactions of the Royal Society of London. Series A: Mathematical, Physical and Engineering Sciences, (2002). 360(1801), 2925-2945.
CrossRef - Kirschbaum, M. U. To sink or burn? A discussion of the potential contributions of forests to greenhouse gas balances through storing carbon or providing biofuels. Biomass and Bioenergy, (2003). 24(4-5), 297-310.
CrossRef - Chave, J., Condit, R., Lao, S., Caspersen, J. P., Foster, R. B., & Hubbell, S. P. Spatial and temporal variation of biomass in a tropical forest: results from a large census plot in Panama. Journal of ecology, (2003). 91(2), 240-252.
CrossRef - Chheng, K., Sasaki, N., Mizoue, N., Khorn, S., Kao, D., & Lowe, A. Assessment of carbon stocks of semi-evergreen forests in Cambodia. Glob. Ecol. Conserv, (2016). 5, 34-47.
CrossRef - Dar, J. A., & Sundarapandian, S. Variation of biomass and carbon pools with forest type in temperate forests of Kashmir Himalaya, India. Environmental monitoring and assessment, (2015) 187, 1-17.
CrossRef - Zheng, G., Chen, J. M., Tian, Q. J., Ju, W. M., & Xia, X. Q. Combining remote sensing imagery and forest age inventory for biomass mapping. Journal of Environmental Management, (2007). 85(3), 616-623.
CrossRef - Pan, Y., Birdsey, R. A., Phillips, O. L., & Jackson, R. B. The structure, distribution, and biomass of the world's forests. Annual Review of Ecology, Evolution, and Systematics, (2013). 44(1), 593-622.
CrossRef - Stromberg, J. C., Lite, S. J., Dixon, M. D., & Rychener, T. J. Hydrologic regimes and riparian forests: A structured population model for cottonwood. Ecology, (2007). 88(1), 168–179. https://doi.org/10.1890/0012-9658(2007)88[168:HRARFA]2.0.CO;2
- Stella, J. C., et al. (2022). "Environmental drivers for riparian restoration success and resilience: A global review." Forest Ecology and Management, 507, 120002.
- Sharma, C. M., Baduni, N. P., Gairola, S., Ghildiyal, S. K., & Suyal, S. (2010). Tree diversity and carbon stocks of some major forest types of Garhwal Himalaya, India. Forest Ecology and Management, 260(12), 2170-2179.
CrossRef - Iqbal, K., Bhat, J. A., Pala, N. A., & Negi, A. K. (2012). Structure and composition estimation of plant species around Khoh river of Garhwal Himalaya, India. Journal of Biodiversity and Environmental Sciences, 2(9), 1-11.
- Aziem, S., Dasgupta, S., Mishra, A. K., Saha, S., & Yadav, P. K. (2016). Riparian Phytodiversity Status of Pristine Bhilangana Valley of Garhwal Himalaya: An Undocumented Retrospective Hitherto. J Biodivers Manage Forestry 5: 1. of, 9, 2.
CrossRef - Tripathi, K. P., & Singh, B. (2009). Species diversity and vegetation structure across various strata in natural and plantation forests in Katerniaghat Wildlife Sanctuary, North India. Tropical Ecology, 50(1), 191.
- Sunil, C., Somashekar, R. K., & Nagaraja, B. C. (2010). Riparian vegetation assessment of Cauvery River basin of South India. Environmental Monitoring and Assessment, 170, 545-553.
CrossRef - Sundriyal, R. C., Sharma, E., Rai, L. K., & Rai, S. C. Tree structure, regeneration and woody biomass removal in a sub-tropical forest of Mamlay watershed in the Sikkim Himalaya. Vegetatio, (1994). 113, 53-63.
CrossRef - Ramachandran, A., Jayakumar, S., Haroon, R. M., Bhaskaran, A., & Arockiasamy, D. I. (2007). Carbon sequestration: estimation of carbon stock in natural forests using geospatial technology in the Eastern Ghats of Tamil Nadu, India. Current Science, 92(3), 323-331
- Lodhiyal, N., Lodhiyal, L. S., & Pangtey, Y. P. S. (2002). Structure and function of shisham forests in central Himalaya, India: nutrient dynamics. Annals of Botany, 89(1), 55-65.
CrossRef - Shahid, M., & Joshi, S. P. (2015). Biomass and carbon stock assessment in moist deciduous forests of Doon valley, western Himalaya, India. Taiwania, 60(2), 71-76.
- Joshi, R., Pangeni, M., Neupane, S. S., & Yadav, N. P. Regeneration status and carbon accumulation potential in community managed sal (Shorea robusta) forests of Far-Western Terai Region, Nepal. European Journal of Ecology, (2021). 7(1).
CrossRef - Borsukevych, L. M., Panchenko, S. M., Orlov, O. O., Kobets, O. V., & Hrynyk, Y. O. Riparian Forests: Conservation Value and Management. (2022). WWF-Ukraine45.
- Khan, N., Jhariya, M. K., Banerjee, A., Meena, R. S., Raj, A., & Yadav, S. K. Riparian conservation and restoration for ecological sustainability. In Natural resources conservation and advances for sustainability (2022). (pp. 195-216). Elsevier.
CrossRef


