Water Quality Index-based Assessment of Groundwater Suitability in Hugli District of West Bengal, India
Golam Mostafa
 and Arijit Majumder
*
and Arijit Majumder
*
1
Department of Geography,
Jadavpur University,
Kolkata,
West Bengal
India
http://dx.doi.org/10.12944/CWE.20.2.15
Copy the following to cite this article:
Mostafa G, Majumder A, Water Quality Index-based Assessment of Groundwater Suitability in Hugli District of West Bengal, India. Curr World Environ 2025;20(2). DOI:http://dx.doi.org/10.12944/CWE.20.2.15
Copy the following to cite this URL:
Mostafa G, Majumder A, Water Quality Index-based Assessment of Groundwater Suitability in Hugli District of West Bengal, India. Curr World Environ 2025;20(2).
Download article (pdf)
Citation Manager
Publish History

Introduction
Groundwater is a more pristine kind of water, characterised by its consistent clarity, colourless, absence of odour, and generally stable temperature.1 One of the planet's most important resources, groundwater promotes environmental benefits, socioeconomic growth, and human health.2-3 Groundwater resources of acceptable quality and appropriate quantity can considerably boost agricultural production while lowering the cost of drinking water treatment.4-5 Today in many parts of the world, groundwater is overused to supply the expanding demands of industry, agriculture, urbanisation, and drinking.6 The usage of groundwater for the socioeconomic advancement of populous nations like China and India has grown.7 The quality and quantity of groundwater are major issues for many developing nations.8 The physical, chemical, and microbiological features of a certain place define the quality of groundwater.9 For example, the evolution and properties of groundwater are mostly impacted by human activities like farming and the growth of the urban industrial complex, in addition to geological forces.10-11 However, social well-being and human health are impacted by groundwater quality.12 Horton developed the Water Quality Index (WQI) in 1965, and it is widely used as a crucial tool to evaluate the overall quality of groundwater.13 It classifies water resources based on their intended use by combining all physical, chemical, and biological factors into a single score.14-15 Nonetheless, efforts have been made to determine groundwater in the current research region is suitable for drinking. The current study's objectives are separated into two main heads.
To analyse the spatio-temporal distribution of hydrochemical parameters in the groundwater in the studied area.
Assessment the spatio-temporal situation regarding drinking water quality.
Study Area
One of West Bengal's central districts, Hugli lies between 20°30'32'' N and 23°1'20'' N latitudes and 87°30'20'' E and 88°30'15'' E longitudes. This district covers 3,149 square kilometres and accounts for around 3.55 percent of West Bengal's total land area. It is encircled by the eastern districts of Nadia and 24-Parganas, Howrah to the south, Bankura and Purba-Bardhaman to the north, and Paschim Medinipur to the west. The alluvium in the Hugli district creates a rich groundwater reserve with two to three aquifers that make up each aquifer system are divided by thin clay layers that do not span the whole area.16
 | Figure 1: Areal extension map of study region; (a): India, from which West Bengal is displayed; (b): West Bengal, from which Hugli district is displayed and (c): Hugli district with elevation, prepared by authors using topographical maps of Survey of India and the shape files
|
Source: https://diva-gis.org
The upper portion of the shallow aquifer is composed of fine to medium-grained sands, while the lower portion is composed of coarser sands but the predominant lithological unit of the Hugli district's aquifer system is sand, where first aquifer is typically limited to a depth of 60–80 meters below ground level.16
Materials and Methods
Database
This investigation is drawn upon both primary and secondary data sources. In the year 2023, during primary field survey 76 groundwater sample of the study region have obtained from the tubewells. These 76 sampling locations have been selected on the basis of availability of secondary data in previous year (i.e. 2015) at same locations. The ion balance error of 76 samples has also been measured. The neutrality of electric charge can be determined using the following method.17 It is generally, determination of balance between cations and anions of the solution which help in accuracy for further analysis.
Where E indicates the ion balance error, EC is the all-cations value and EA denotes the anions summation. In general, E should generally be less than 5% and definitely no more than 10% for a reliable study; a result beyond 10% is undesirable.18 The ion balance error is the method by which an acceptable and unacceptable number of samples are determined from the total number of samples.
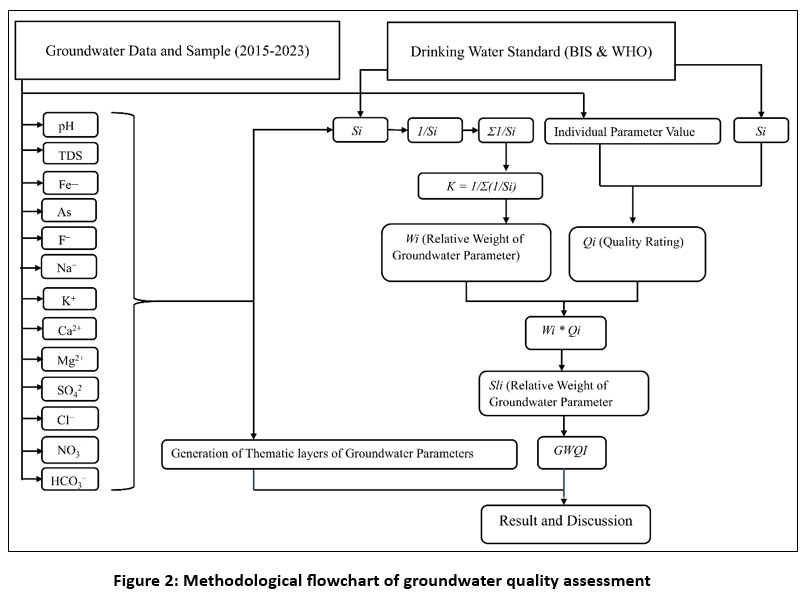 | Figure 2: Methodological flowchart of groundwater quality assessment
|
In this study, 76 groundwater samples from wells have been collected through primary survey but based on ion balance error, 59 groundwater samples have been identified as acceptable sample for assessing of quality of the research’s groundwater.
Methodology
The World Health Organization's (WHO) and Bureau of Indian Standards (BIS) recommended drinking water quality standard have used to compute the WQI (BIS 2012, 2015 and WHO 2017).19-21 Acceptable limits of all groundwater parameters taken from BIS except Sodium and Potassium. For Sodium and Potassium of groundwater used WHO’s acceptable limits for drinking purpose. Lower limit of acceptable limits of all groundwater parameters have used for calculation of WQI. The weighted arithmetic approach, first given by Horton in 1965 and developed by Brown in 1972, has been used to compute the WQI for both 2015 and 2023.22-23
The following is the representation of the weighted arithmetic Water Quality Index (WQI).
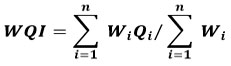
Where, Wi is the ith parameter's weight in units and n is the number of parameters. Qi = The ith water quality parameter's quality rating (sub-index).
Each water quality parameter's recommended requirements are inversely correlated with its unit weight (Wi).
![]()
where Sn is the standard value for ith parameters, Wi is the weight of the ith parameter in units, and K is the proportionate constant. For K first calculated 1/Sn for each parameter then sum all of them, and then taken the reciprocal of that sum. This yields the value of K. In this instance, K's value is 0.0095, which is easily found by using the equation below.
![]()
Table 1: Groundwater quality standard for drinking purpose
Parameters (unit) | Drinking-water standards | |
BIS (2012, 2015) * | WHO (2017) | |
pH (On Scale) | 6.5–8.5 | 6.5-8.5 |
Arsenic (mg/L) | 0.01 | 0.01 |
Fe- (mg/L) | 0.3 | 0.3 |
TDS (mg/L) | 500–2000 | 600–1000 |
F- (mg/L) | 1-1.5 | 0.5-1 |
Ca2+ (mg/L) | 75–200 | 100–300 |
Mg2+ (mg/L) | 30–100 | - |
Na+ (mg/L) | - | 50-200 |
K+ (mg/L) | - | 12 |
HCO-3 (mg/L) | 300-600 | - |
SO2-4 (mg/L) | 200–400 | 250 |
Cl-(mg/L) | 250–1000 | 250 |
NO-3 (mg/L) | 45 | 50 |
Source: downloaded from www.bis.gov.in & www.who.int
* The greater value indicates the allowable maximum in the absence of an alternative source, whereas the lower value indicates the acceptable/desirable limit (BIS, 2012, 2015).
Brown states that the following formula is used to determine the quality rating (Qi)
![]()
Where, Sn = standard permissible value of ith parameter, Vo = observed ith parameter value at a specific sample location, Vi = ideal ith parameter value in pure water. For the present study, the values of Vi are considered to be zero (as these are the ideal values for concentration in pure water) for all 12 parameters except pH, where the value of Vi is considered as 7 i.e. neutral condition of hydrogen ion and hydroxyl ion concentration.
Results
In this study selected parameters have been used to generate the groundwater quality maps using ArcGIS software, as seen in (Fig.3 & Fig.4). The 13 physical-chemical characteristics of groundwater, including pH, TDS, magnesium, calcium, potassium, sodium, chloride, nitrate, sulphate, bicarbonate, fluoride, iron and arsenic of 59 wells have been used (Fig.2).19-21 The WQI has been processed using the lower limit of the Bureau of Indian Standards and WHO for potable water for the present study.
Hydrogen ion concentration (pH)
pH is closely linked to other chemical components of water; it is an essential indicator for assessing the quality and pollution of any aquifer system. The concentration of hydrogen ions quantified in terms of the pH level. When water is pure, pH is neutral, indicating that the concentrations of hydrogen and hydroxyl ions are in balance. In the current research from 2015 to 2023, the range of pH fluctuates between 7.5 to 8.5 with a mean value of 7.9, This suggests that the groundwater is alkaline and falls within the permissible range. (pH limit that is suitable for human consumption (6.5 – 8.5). The spatial distribution of pH is higher in north-east portion compare to other parts in study area but pH value in selected wells from 2015 to 2023 of Hugli district are under acceptable limit (6.5-8.5) for drinking purpose.
Total dissolved solids (TDS)
TDS measures all of the organic and inorganic materials that are water-soluble substance. Calcium, magnesium, sodium, potassium, bicarbonate, carbonate, chloride, and sulphate are among its constituents. In the current research, from 2015 to 2023 TDS ranges between 183 mg/L to 755 mg/L with a mean value of 380 mg/L (Permissible limit < 500 mg/L). The TDS level of groundwater of 2015 depicts that 46 (77.96% sample) of selected wells are under acceptable limit where as 13 (22.03% sample) wells have exceeded the acceptable limit (500 mg/L) of TDS concentration in groundwater for drinking. TDS level in groundwater of 2023 depicts that 42 (71.18% sample) groundwater wells belong to suitable condition for drinking purpose where as 17 wells (28.81% sample) have exceeded the acceptable limit (500 mg/L) of TDS concentration in groundwater for drinking purpose in 2023.
Iron (Fe)
Groundwater containing iron from mining, geological, industrial, or residential sources.24 The weathering of iron-containing minerals is the mass frequent groundwater’s iron source. In this research from 2015 to 2023, the iron ranges between 0.12 mg/L to 1.62 mg/L with an average value of 0.74 mg/L and its permissible limit is 0.3 mg/L for drinking purpose. The spatio-temporal variation of iron concentration is higher in maximum parts of the study area because whole district is rich in alluvial sediments deposit. These sediments contain iron-bearing mineral in the form of iron oxides and hydroxides which leaches into groundwater as it moves through these alluvial soils and aquifers. The permissible level (0.3 mg/L) of concentration of iron in groundwater for drinking purposes have exceeded by 47 wells (79.66% sample) in 2015. Iron level in groundwater of 2023 depicts that 52 wells have (88.13% sample) exceeded the permissible limit (0.3 mg/L) of concentration of iron in groundwater for drinking.
Arsenic (As)
Arsenic contamination in groundwater is a significant concern in various parts of West Bengal, including Hugli district.25 The World Health Organization advises that drinking water should have no more than 0.01 mg/L of arsenic, also in the Indian standard permits up to 0.01 mg/L. In Hugli district, mainly areas of two blocks under Balagarh (Arsenic level 0.056 mg/L) and Pandua (Arsenic level 0.016 mg/L) have reflected arsenic levels exceeded this standard level for drinking. In these blocks arsenic originates from arsenopyrite and iron oxide minerals in the sediments deposited by Gangetic alluvium.25 Groundwater in this region is often in anaerobic condition, which leads to the dissolution of arsenic from iron oxides present in sediments. Under these conditions, arsenic is released into groundwater in the form of arsenite and arsenate due oxidation and dissolution of As and Fe bearing minerals. Also, during the dry season when groundwater levels drop due to over-extraction the arsenic ions remain bound to sediments whereas in the monsoon season groundwater gets recharged which leads to arsenic being released into the groundwater.25 In 2015, 34 wells (57.62% sample) have arsenic concentrations greater than above the permissible limit for potable water whereas in 2023, 30 wells (50.84% sample) have arsenic concentrations that higher than which is allowed for drinking water. According to report of CGWB, in the hugli district arsenic concentration above 0.01 mg/L in 16 blocks and above 0.05 mg/L in 11 blocks.25 Human health is at risk due to the high amount groundwater arsenic levels.
Fluoride (F-)
One element that occurs naturally in groundwater is fluoride, often present in varying concentrations depending on the local geology and hydrogeochemical conditions.26 In groundwater the source of fluoride concentration is mostly geogenic by nature.26 It is among the most reactive elements and the lightest halogen. It typically exists as a main ion with a high concentration or in negligible proportions. Fluoride stays more soluble in regions with low calcium concentrations.26 Furthermore, fluoride dissolves from minerals more readily in groundwater in alkaline (higher pH) circumstances. According to analysis data of 2015 and 2023 in current research, the Fluoride ions range between 0.02 mg/L to 0.78 mg/L and its average value of 0.37 mg/L and its permissible level is 1 mg/L for drinking purpose. Because of interactions between the groundwater and host rock, fluorides produced from different fluoride-bearing minerals are found in the groundwater. Fluoride concentration largely found in western portion of the district. such as Arambagh, Khanakul, Goghat I and Goghat II blocks of the district because fluoride-bearing minerals like fluoride and apatite present in the hard rock and semi-consolidated formations of the western part of Hugli. Over time, the weathering of these minerals releases fluoride ions into the groundwater. In the study area, Fluoride concentration of all selected wells of 2015 and 2023 are under permissible limit.
Sodium (Na+)
Most groundwater contains this extremely reactive alkali metal. Sodium compounds are found in many rocks and soils, and they breakdown readily to release sodium into groundwater. In the current research, analysis of selected wells data of 2015 and 2023 it varies from 9 mg/L to 305 mg/L with a mean value of 71.01 mg/L. In 2015, only 3 wells (5.08% sample) have exceeded the permissible level (200 mg/L) of sodium concentration where as in 2023, only 1 well (1.69% sample) has exceeded the standard limit (200 mg/L) of sodium concentration within the research region. Sodium concentrations in groundwater mainly found in the southern sector of the study region because in the aquifers of Hugli district, cation exchange plays a significant role in altering groundwater chemistry. Calcium (Ca²+) and magnesium (Mg²+) ions in the groundwater is exchanged with sodium (Na+) ions adsorbed on clay minerals within the aquifer matrix. Overuse of fertilisers containing sodium, such as sodium phosphate and sodium nitrate, cause sodium to seep into groundwater particularly in regions with inadequate drainage, irrigation return flow has the potential to replenish soil and water bodies with sodium-rich water.
Potassium (K+)
Potassium is generally a minor ion, having less influence than sodium, calcium, or phosphate. The concentration of potassium in groundwater rises over time. In this research based on analysis data of 2015 and 2023 potassium varies between 1 mg/L to 102 mg/L with a mean value of 28.65 mg/L. In the study area, 33 wells (55.93% sample) of 2015 and 37 wells (62.71% sample) of 2023 have exceeded the standard limit (12mg/L) of potassium accumulation in groundwater for drinking purpose. Potassium concentrations in groundwater mainly exist in the south-east region of the study region because the weathering of potassium-bearing minerals like feldspar, mica, and clay minerals contributes to the release of potassium into the groundwater. Potassium-rich topsoil is washed away in regions with high rates of deforestation and inadequate land management, resulting in the deposit of potassium into ponds and rivers. Clay deposits in the Ganga-Brahmaputra floodplain, which encompasses Hugli district, naturally discharge potassium into the river.
Calcium (Ca2+)
Calcium is a key parameter influencing water hardness, irrigation suitability, and overall chemical balance. Calcium naturally seeps into groundwater due to the existence of calcium-rich minerals including dolomite, gypsum and limestone in subterranean rock formations. In the study region, based on an investigation of selected wells data of 2015 and 2023 the calcium concentration ranges from 10 mg/L to 86 mg/L and its average value of 38.33 mg/L and most of the well samples are under the standard limit (75mg/L). Fluoride's chemical weathering and dissolution are satisfied by the groundwater's reduced Ca2+ concentration, which raises the fluoride concentration. In the study region, calcium concentration is found in eastern and western sector of the district because the presence of limestone, gypsum, dolomite and other calcium-rich minerals in the underground rock formations which leads to natural leaching of calcium into groundwater.
Magnesium (Mg2+)
Magnesium is an essential criterion in ascertain the water’s hardness. In this investigation, based on examination of selected wells data of 2015 and 2023 the magnesium concentration limit between 4 mg/L to 106 mg/L with a mean value of 38.33 mg/L.13 wells (22.03% sample) of 2015 and 20 wells (33.89% sample) of 2023 have exceeded the standard limit (12mg/L) of magnesium concentration in groundwater for drinking reason. In the research area, the calcium concentration not largely found in any particular portion but there is magnesium concentrations in groundwater are suitable for drinking water. Magnesium concentrations in groundwater mostly situated in the centre of the research area. 20 wells (33.89% sample) have exceeded the consumable limit (30 mg/L) of TDS concentration in groundwater for drinking purpose in 2023.
Sulphate (SO42-)
Rocks that dissolve and leach sulphate contain gypsum, iron sulphide, and other sulphur-containing minerals. Not a single well of sample exceeded the acceptable level of sulphate range for drinking purpose. In this research, based on analysis of selected wells data of 2015 and 2023 it ranges between the 7 mg/L to 66 mg/L with a average value of 24.28 mg/L, that is within the acceptable level of 200 mg/L for potable purpose. Sulphate concentrations mainly found in the south-western region of the study area.
Chloride (Cl-)
In the current study, based on analysis of selected wells data of 2015 and 2023 the Cl- ranges between 77.2 mg/L to 440 mg/L with a average value of 157.56 mg/L and its standard limit is 250 mg/L for drinking purpose. The greater concentration of chlorine under groundwater puts a human health at risk.27-28 Chloride level in groundwater mostly placed on the western and north-east region in the research region. In 2023, not a single well sample in this research has chloride level above the permissible limitation (250 mg/L) for drinking purpose.
Nitrate (NO-3)
A vital part of the nitrogen cycle, nitrate is a naturally occurring ion. In the study region, based on examination of selected wells data of 2015 and 2023 its congregation scale 1 mg/L to 23 mg/L with a mean value of 7.32 mg/L. In 2015 and 2023, any wells do not excessed of the standard limits of nitrate concentration in groundwater (45 mg/L) throughout the study region. The eastern sector in the research area has more nitrate concentration in the groundwater.
Bicarbonate (HCO-3)
This material is created when carbon dioxide and water react with carbonate rocks like dolomite and limestone. Bicarbonate is created when the soil’s carbon dioxide combines in the company of minerals that make rocks, creating an alkaline condition under the groundwater. In this research, based on analysis of selected wells data of 2015 and 2023 it varies between 106 mg/L to 484 mg/L with a mean value of 249.61 mg/L and it is within the permissible limit of 300 mg/L for drinking purpose. In the study area, 3 wells (5.08% sample) of 2015 and 29 wells (49.15% sample) of 2023 have exceeded the acceptable limit (300mg/L) of magnesium concentration in groundwater for drinking purpose. Bicarbonate concentration is found in central part.
Table 2: Summary statistics of recorded groundwater quality indicators
Parameters | 2015 | 2023 | Combined of 2015 and 2023 | |||||||||
Max | Min | Mean | SD | Max | Min | Mean | SD | Max | Min | Mean | SD | |
pH (On Scale) | 8.2 | 7.5 | 7.8 | 0.20 | 8.5 | 7.5 | 8 | 0.22 | 8.2 | 7.5 | 7.9 | 3.35 |
Arsenic (mg/L) | 0.07 | 0.01 | 0.02 | 0.01 | 0.05 | 0.01 | 0.02 | 0.01 | 0.07 | 0.01 | 0.03 | 0.02 |
TDS (mg/L) | 678 | 183 | 346.08 | 140.38 | 755 | 190 | 414.32 | 153.15 | 755 | 183 | 380.2 | 226.80 |
Iron (mg/L) | 1.62 | 0.18 | 0.79 | 0.42 | 1.41 | 0.12 | 0.70 | 0.35 | 1.62 | 0.12 | 0.74 | 0.52 |
Fluoride (mg/L) | 0.78 | 0.02 | 0.36 | 0.20 | 0.65 | 0.12 | 0.39 | 0.14 | 0.78 | 0.02 | 0.37 | 0.25 |
Sodium (mg/L) | 305 | 9 | 71.05 | 61.16 | 204 | 11 | 70.98 | 46.16 | 305 | 9 | 71.01 | 96.87 |
Potassium (mg/L) | 83 | 1 | 23.21 | 23.69 | 102 | 2 | 34.10 | 26.92 | 102 | 1 | 28.65 | 34.17 |
Calcium (mg/L) | 86 | 10 | 31.42 | 19.13 | 85 | 12 | 45.25 | 17.93 | 86 | 10 | 38.33 | 29.21 |
Magnesium (mg/L) | 106 | 4 | 23.49 | 19.75 | 57 | 6 | 26.17 | 12.52 | 106 | 4 | 24.82 | 32.01 |
Sulphate (mg/L) | 66 | 7 | 20.96 | 11.54 | 47 | 12 | 27.61 | 9.50 | 66 | 7 | 24.28 | 19.69 |
Nitrate (mg/L) | 18 | 1 | 5.98 | 4.40 | 23 | 1 | 8.66 | 4.81 | 23 | 1 | 7.32 | 7.50 |
Bicarbonate (mg/L) | 324 | 106 | 212.16 | 53.99 | 484 | 112 | 287.07 | 92.91 | 484 | 106 | 249.61 | 138.06 |
Chlorine (mg/L) | 440 | 77.2 | 168.69 | 73.23 | 244 | 82 | 146.44 | 41.99 | 440 | 77.2 | 157.56 | 122.54 |
Discussions
The GWQI is an effective medium for assessing and managing groundwater resources since it condenses a large number of groundwater quality characteristics into a single frame. The average GWQI value for ground water quality is 110.26, with a range of 27.81 to 392.19.
Table 3: Water quality condition is classified applying the weighted arithmetic WQI approach
WQI | Rating Class |
<50 | Excellent |
50-100 | Good |
100-200 | Poor |
200-300 | Very Poor |
> 300 | Unsuitable |
 | Figure 3: Spatial distribution of GWQ of 2015 of the research area prepared using ArcGIS
|
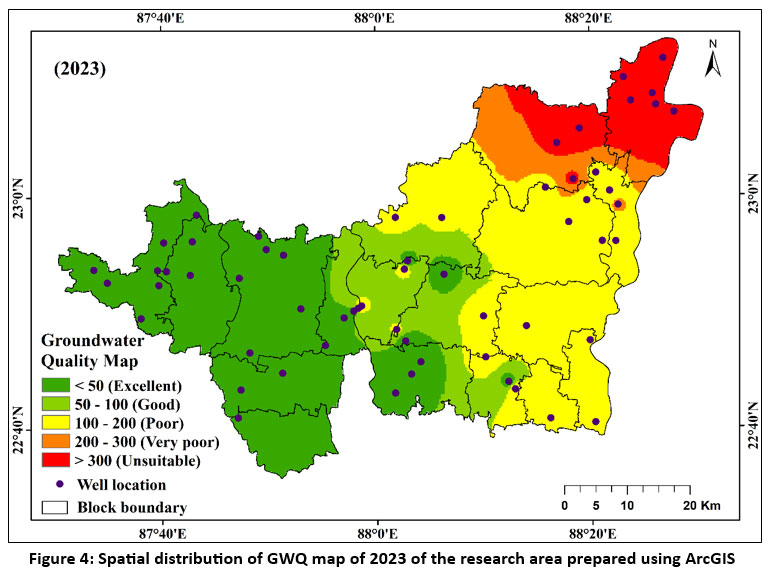 | Figure 4: Spatial distribution of GWQ map of 2023 of the research area prepared using ArcGIS
|
The GWQI of the study area has been split into five grades such as excellent, good, poor, extremely poor and unsuitable for ingestion by human if GWQI is more than 300.29 According to the results of GWQI, 32.63 % district area and 24 wells (40.67% sample) of 2015 and 37.75 % district area and 29 wells (49.15% sample) of 2023 belongs to excellent class of groundwater status. The area of good groundwater quality class has increased from 8.5% district area in 2015 to 13.61% district area in 2023 whereas poor groundwater quality class has decreased from 39.19% (21 wells) district area in 2015 to 33.29% (19 wells) district area in 2023. The study area's western and central regions are home to the wells of good and excellent water quality wells (W1 to W6, W25 to W38, W40 toW44, and W50 to W53). Poor water quality wells codes (W1, W20, W21, W48, W49, W57, W58, W59, W54 and W17) are primarily located in the eastern and south-eastern portion in the study region of the Haripal C.D. block, Chinsurah Magra C.D. block, Dhaniakhali C.D. block, Singur C.D. block, Srirampur C.D. block of the Hugli. Very poor groundwater quality class occupied 6.96 % district area 4 Wells (6.77% sample) in 2015 and 5.81 % district area in 2023. According to the GWQI's spatial distribution of 2023, the very poor-quality water wells are situated in the north-eastern portion of the study area. The results also show that 12.66 % district area and 9 wells (15.25% sample) of 2015 and 9.51 % district area and 9 wells (15.25% sample) are registered as unsuitable groundwater quality (Fig.3&4).
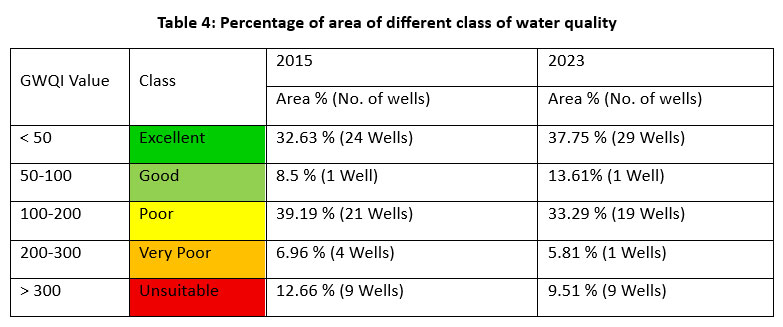 | Table 4: Percentage of area of different class of water quality
|
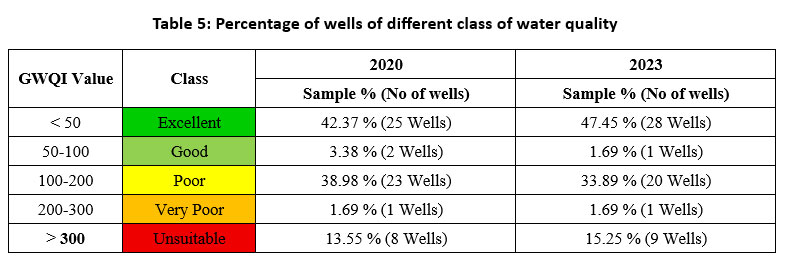 | Table 5: Percentage of wells of different class of water quality
|
The unsuitable groundwater wells (W7, W8, W9, W10, W11, W12, W41, and W43) are primarily located in different parts of Balagarh and Pandua. Finally, based on the result of GWQI maps of 2015 and 2023 it is found out that maximum area of Balagarh block and parts of Pandua block are under unsuitable condition with respect to groundwater quality for drinking purpose. Few blocks of south east portion of the district belongs to poor category in terms of groundwater quality for drinking purpose. The remaining blocks mainly located in the central and western region of the district fall into the good category for drinking water quality (Fig.3&4). The areas of unsuitable water have declined due to decreasing of arsenic level in groundwater from 2015 to 2023.
Conclusion
Groundwater is a major supply of drinking water in the field of study, serving drinking, residential, and agricultural needs. Consequently, the current study analysed and assessed the standard level of groundwater for potable purposes applying WQI method with the help of 13 physiochemical parameters of 59 sample wells of groundwater. Additionally, the GIS environment was used to analyse the spatial variation of the water status indicators and WQI. It is important to note that the supply of sufficient amounts of safe drinking water is threatened by water-stressed conditions brought on by the rapid exploitation of groundwater for irrigation and groundwater pollution from anthropogenic inputs like fertiliser. The findings indicate that 49.15% of sample wells have bicarbonate contents over the permissible level for potable water in the research area. Additionally, just a small portion of the study region has higher concentration of fluoride, pH, TDS, magnesium, sulphate, calcium, and sodium. The findings also show that the central and south-central portion in the investigated area has the highest engrossment of iron and potassium. The findings show that all sample wells' nitrate and sulphate concentrations are within the allowable range. Additionally, the results of GWQI of 2023 indicate that 33.89% of the samples have poor water status for potable, whereas 47.45% of the wells have excellent status of water quality. According to the findings, the study area unsuitable water well is situated in the northeast area where 10.16% wells (6 wells) are highly arsenic concentrated, while the south-eastern portion has really poor-quality water. Besides, the western portions of the study region have excellent and good water quality wells, while the remaining portion has poor and unsuitable water quality wells. More use of groundwater from deep aquifer, community awareness programs and targeted treatment technologies will be effective for betterment of water quality. As a result, this study would assist stakeholders and policymakers in developing plans for local groundwater quality management and planning.
Acknowledgement
The authors are thankful to the Department of Geography of Jadavpur University for providing the necessary infrastructure. The authors are appreciating the various governmental and non-governmental organizations for contributing different valuable data. The first author is grateful to the University Grants Commission of India for funding the Ph.D. research. We gratefully acknowledge the anonymous reviewers and editors for their very important time and comments that helped to upgrade the research article.
Funding Sources
The first author is grateful to the University Grants Commission (UGC) of India for funding the Ph.D. research (Grant id: 3427/ (NET-DEC 2018).
Conflict of interest
The authors do not have any conflict of interest.
Data Availability Statement
Data will be made available on request
Ethics Statement
This research did not involve human participants, animal subjects, or any material that requires ethical approval
Informed Consent Statement
This study did not involve human participants, and therefore, informed consent was not required
Permission to Reproduce Material from Other Sources:
One figure and one table are reproduced from original website of DIVA-GIS, WHO and BIS which is in the public domain
Author Contributions
Golam Mostafa: conceptualization, database, methodology, results and discussion, and conclusion
Dr. Arijit Majumder: Reviewed and approved the final manuscript
References
- Fatoba J. O, Sanuade O. A, Hammed O. S, Igboama W. W. The use of multivariate statistical analysis in the assessment of groundwater hydrochemistry in some parts of southwestern Nigeria. Arab J Geosci. 2017; 10(15):1–11.
CrossRef - Steube C, Richter S, Griebler C. First attempts towards an integrative concept for the ecological assessment of groundwater ecosystems. Hydrogeol J. 2009;17(1):23–35. https:// doi. org/ 10. 1007/ s10040-008-0346-6
CrossRef - Aravinthasamy P, Karunanidhi D, Rao N. S, Subramani T, Srinivasamoorthy K. Irrigation risk assessment of groundwater in a non-perennial river basin of South India: implication from irrigation water quality index (IWQI) and geographical information system (GIS) approaches. Arab J Geosci. 2020;13(21):1–14. https:// doi. org/10.1007/s12517-020-06103-1
CrossRef - Bilali A. E, Taleb A. Prediction of irrigation water quality parameters using machine learning models in a semi-arid environment. J Saudi Soc Agric Sci. (2020);19(7):439–451. https:// doi. org/ 10.1016/j.jssas.2020.08.001
CrossRef - Das S, Sarkar R. Monitoring and evaluating the spatio-temporal variations of the water quality of a stretch of the Bhagirathi-Hugli River, West Bengal, India, using geospatial technology and integrated statistical methods. Environ Sci Pollut Res. 2021.28(13):.15869. https:// doi. org/ 10. 1007/ s11356-020-11655-6
CrossRef - Deepa S, Venkateswaran S. Appraisal of groundwater quality in upper Manimuktha sub basin, Vellar river, Tamil Nadu, India by using Water Quality Index (WQI) and multivariate statistical techniques. Model Earth Syst Environ. 2018;4(3):1165–1180.
CrossRef - Adimalla N., Taloor A. K. Hydrogeochemical investigation of groundwater quality in the hard rock terrain of South India using Geographic Information System (GIS) and groundwater quality index (GWQI) techniques. Groundw Sustain Dev. 2020;10:100288.
CrossRef - Gidey A. Geospatial distribution modeling and determining suitability of groundwater quality for irrigation purpose using geospatial methods and water quality index (WQI) in Northern Ethiopia. Appl Water Sci. 2018;8(3):1–16. https:// doi. org/ 10. 1007/ s13201-018-0722-x
CrossRef - Narasaiah V, Rao B. V. Groundwater quality of a hard rock aquifer in the Subledu Basin of Khammam district, India. Appl Water Sci. 2021;11(6):1–21.https://doi.org/10.1007/s13201-021-01424-2
CrossRef - Subramani T, Elango L, Damodarasamy S. R. Groundwater quality and its suitability for drinking and agricultural use in Chithar River Basin, Tamil Nadu. India Environ Geol. 2005;47(8):1099–1110. https://doi.org/10.1007/s00254-005-1243-0
CrossRef - Nas B, Berktay A. Groundwater quality mapping in urban groundwater using GIS. Environ Monit Assess. 2010; 160(1):215–227. https://doi.org/10.1007/s10661-008-0689-4
CrossRef - Milovanovic M. Water quality assessment and determination of pollution sources along the Axios/Vardar River. Southeastern Europe Desalin. 2007; 213(1–3):159–173.
CrossRef - Tyagi S, Sharma B, Singh P, Dobhal R. Water quality assessment in terms of water quality index. Am J Water Resour. 2013;1(3):34–38.
CrossRef - Kavurmaci M, Karakui C. B. Evaluation of irrigation water quality by data envelopment analysis and analytic hierarchy process-based water quality indices: the case of Aksaray City. Turkey Wat Air and Soil Poll. 2020; 231(2):1–17. https://doi.org/10. 1007/s11270-020-4427-z
CrossRef - Gazzaz N. M, Yusoff M. K, Ramli M. F, Juahir H, Aris A. Z. Artificial neural network modeling of the water quality index using land use areas as predictors. Water Environ Res. 2015;87(2):99–112. https://doi.org/10.2175/106143014X14062131179276
CrossRef - CGWB Dynamic Ground Water Resources of India. Faridabad: Ministry of Water Resources. 2008; Government of India.
- Matthess G. The properties of groundwater. Wiley. 1982; p 498
- Singhal B.B. S, Gupta R. P. Groundwater quality and contamination. Applied Hydrogeology of Fractured Rocks, pp.213-240Srivastava SK (2019) Assessment of groundwater quality for the suit ability of irrigation and its impacts on crop yields in the Guna district, India. Agric water manag. 1999; 216:224–241.
CrossRef - BIS (Bureau of Indian Standards). Indian standard drinking water specification. 2012; second revision, pp.1–16.
- BIS (Bureau of Indian Standards). Indian standard drinking water specification. 2015; second revision, pp.2–6.
- WHO Guideline for drinking water quality. World Health Organization, Geneva. 2017;4th edn.
- Horton R. K. An index number system for rating water quality. J Water Pollut Control Federation. 1965; 373:303–306.
- Brown R. M, Mccleiland N. J, Deiniger R. A, O’Connor M. F. Water quality index-crossing the physical barrier. Res Jerusalem. 1972; 6:787–797.
CrossRef - Karakus C. B. Evaluation of groundwater quality in Sivas province (Turkey) using water quality index and GIS-based analytic hierarchy process. Int J Environ Health Res. 2019; 29(5):500–519.
CrossRef - CGWB Quarterly Journal of Central Ground Water Board. Faridabad: Ministry of Water Resources. Government of India.2009; 24(2&3).
- Kaminsky L. S, Mahoney M. C, Leach J, Melius J, Jo Miller. M. Fluoride: benefits and risks of exposure. Crit Rev Oral Biol Med. 1990;1:261–281
CrossRef - Pius A, Jerome C, Sharma N. Evaluation of groundwater quality in and around Peenya industrial area of Bangalore, South India using GIS techniques. Environ Monit Assess. 2012;184:4067–4077.
CrossRef - Sadat-Noori S. M, Ebrahimi K, Liaghat A. M. Groundwater quality assessment using the Water Quality Index and GIS in Saveh Nobaran aquifer. Iran Environ Earth Sci. 2014;71:3827–3843.
CrossRef - Wagh V, Panaskar D, Mukate S, Lolage Y, Muley A. Ground water quality evaluation by physicochemical characterization and water quality index for Nanded Tehsil, Maharashtra, India. In: Proceedings of the 7th international conference on biology, environment and chemistry. 2017; IPCBEE (vol 98).


