Assessment of Pollution and Eutrophication Status of an Urban Tropical Lake in South India
Adithya Sheeba Suresh1
*
 , Jaya Divakaran Sarasamma1
, Sherly Williams Elsie1
and Anoop Raj Leena2
, Jaya Divakaran Sarasamma1
, Sherly Williams Elsie1
and Anoop Raj Leena2
1
Department of Environmental Sciences,
University of Kerala,
Thiruvananthapuram,
Kerala
India
2
Department of Agricultural Extension,
College of Agriculture,
Pattanakadu,
Kerala
India
http://dx.doi.org/10.12944/CWE.20.3.19
Copy the following to cite this article:
Suresh A. S, Sarasamma J. D, Elsie S. W, Leena A. R. Assessment of Pollution and Eutrophication Status of an Urban Tropical Lake in South India. Curr World Environ 2025;20(3). DOI:http://dx.doi.org/10.12944/CWE.20.3.19
Copy the following to cite this URL:
Suresh A. S, Sarasamma J. D, Elsie S. W, Leena A. R. Assessment of Pollution and Eutrophication Status of an Urban Tropical Lake in South India. Curr World Environ 2025;20(3).
Download article (pdf)
Citation Manager
Publish History

Introduction
Lacustrine systems are ecological markers for a region; they maintain the microclimate of the entire watershed, whether it is an urban catchment or not.1 The inhabitants of the catchment rely on surface water for a variety of purposes including recreation, irrigation, agriculture, aquaculture, industrial use and even more. Human activities within a watershed are the cause of various point source and nonpoint source pollutants that enter and harm surface water bodies like lakes. As a result, the water quality becomes a major concern.2,3 Deterioration of lake water quality raises alarming risks to the well-being of whole societies globally and especially in developing countries.4 This concern led to the Sustainable Development Goal 6 (SDG), which aims to improve the water quality and conserve water bodies.5 Today the lakes in the whole world, particularly the tropical and subtropical, are under threat due to human activities.6 India is facing water scarcity even though it has plenty of freshwater resources due to increased pollution.7 The lake ecosystems are depreciated due to the rapid increase in urbanization, settlements, and other anthropogenic activities in the catchment, increasing the draining of sewage loads, industrial effluents, etc. into the lake.2,8 The lake water qualities are affected by both natural and manmade activities; therefore, the spatio-temporal monitoring and assessment of water quality parameters are required.9
Water quality can be determined by examining its physico-chemical characteristics, which promotes sustainability and beneficial uses of water. WQI is a crucial metric for evaluating a lake's degree of pollution and the factors contributing to the significant pollution. The WQI is a single unit that determines the quality state of a specific region at a given time based on several water quality factors.2, 10 This information can be utilized to create mitigation strategies to protect lake ecology.9 Eutrophication, defined as nutrient enrichment (such as nitrogen and phosphorus) resulting in increased algal blooms and oxygen depletion, is a significant environmental concern regarding lakes and causes aquatic creatures to perish.11,12 The index CTSI (Carlson Trophic State Index)13 is employed for determining trophic level of a lake. The three main factors: Chlorophyll a, water's Secchi disk depth and total phosphorus, are the used by this index.10
Veli Akkulam Lake in a small urban coastal area, is densely populated with residents relying heavily on the lake for irrigation, recreation, and even for their livelihoods. In addition, projects such as Veli Tourist Village and Akkulam Tourist Village illustrate the lake's increased tourism activity. The lake located in the middle of Thiruvananthapuram city, is surrounded by urban activities like commercial centres, hospitals, factories, residential areas, and agricultural activities, all of which contribute to pollution. Certain studies have already conducted on many aspects of environmental stressors that explain the contamination and threats of Veli- Akkulam lake.14- 20 The Veli Lake and Akkulam Lake jointly forms the Veli-Akkulam Lake and a sandbar that divides the whole lake from the Arabian Sea gets breached after extreme precipitation or the monsoon season. Seasonal fluctuations brought on by the sandbar's breaking and the tidal action both affect the lake's physicochemical properties. To effectively manage and govern water environments, it's essential to first assess their water quality. This is accomplished through continuous monitoring and timely evaluations, which allow agencies and suppliers to identify pollution threats and create suitable control plans.21 A research study is needed because there are no recent monitoring or evaluation studies to analyse the pollution stressors and lake water quality in Veli-Akkulam Lake. Previous study20 evaluated the sediment characteristics that account for the sources of nutrient contamination in the lake and found that the main culprit is human activity. The increased nutrient enrichment necessitates evaluating the lake's eutrophication status. This research work aims to assess water quality metrics and statistically describe the correlation between water quality parameters. Furthermore, indexes such as CTSI and WQI will be used to analyse the lake ecological state.
Materials and Methods
Study area and Sampling locations
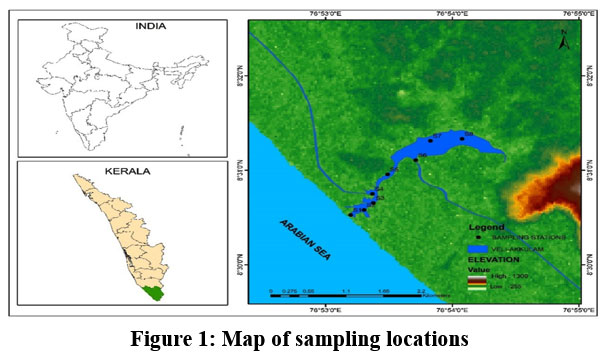 | Figure 1: Map of sampling locations.
|
The urban lake, Veli-Akkulam is located at the centre of Thiruvananthapuram district of Kerala at latitudes 8°31'14'' and 8°31'52'' north and longitudes 76°53'12'' and 76°54'06'' east. On its western side, a sand bar divides this small coastal lacustrine system from the Arabian Sea.22 The lake functions as a single lacustrine ecosystem and is divided into two parts: Akkulam Lake, which forms the upstream, and Veli Lake, which forms the downstream. The lake is approximately 95.78 hectares in size, stretches 3.2 km in and a mean depth 2.4 m. Lake typically receives 1774 mm of precipitation and 26.6°C of temperature per year. Three streams—Amayizhanchanthodu stream, Parvathy Puthanar stream in the lake's eastern section, and Parvathy Puthanar stream in its western section—feed the Veli-Akkulam water body and these streams are responsible for the draining of urban wastes and other organic matter in to the lake.14,22,20 When the lake's urban catchment is taken into account, the zone of impact is 13900.09 hectars, with the main area uses being 82.16% urban and rural settlements, 16.83% agricultural practices, 0.61% waterbodies, 0.28% industrial activities, and the least as 0.1% of plantations.23,24
Methodology for surface water sampling and analysis.
Samples of surface water were taken from seven sites, which is 250m apart each, chosen in accordance with the sources of contamination and sampling sites accessibility. The details describing sampling sites and its locations are given table.1. Due to severe siltation and water hyacinth growth sampling beyond station 7 was not possible. The sampling stations are marked in map (Fig. 1). The station’s location data was recorded with Garmin eTrex 30x, USA GPS tracker. Between 2022 and 2023, sampling for water quality was conducted during three different seasons, during the months May (pre-monsoon), September (monsoon), and January (post-monsoon). The samples from lake surface, taken early in the morning, between 6.30 and 8 am, using a clean bucket and collected samples were transferred to clean screw-capped glass bottles. The samples were carried to the laboratory immediately after sampling and then filtered to remove debris and floating contaminants, and stored in the refrigerator at a temperature between 0 to 4oC prior analysis. Standard procedures were used to analyse the physico-chemical parameters including- pH, Turbidity, Electrical Conductivity (EC), Total Dissolved Solids (TDS), Total Hardness (TH), Total Alkalinity (TA), Chloride (Cl-), Nitrate (NO3-), Phosphate (PO43-), Sulphate (SO42-), Dissolved Oxygen (DO), and Biochemical Oxygen Demand (BOD). 25,26
Table 1: Description of Study Stations and its location
Station Code | Station Description | Latitude | Longitude |
S1 | Barmouth zone | 8.508781 | 76.88664 |
S2 | Floating restaurant zone | 8.509667 | 76.8884 |
S3 | Boat club Zone | 8.510917 | 76.88961 |
S4 | Parvathy Puthanar draining zone | 8.512511 | 76.8895 |
S5 | Middle lake zone | 8.515956 | 76.89149 |
S6 | Akkulam Lake (Parvathy Puthanar draining zone) | 8.518464 | 76.89519 |
S7 | Akkulam Lake (Amazhinjanthodu draining zone) | 8.521881 | 76.89713 |
Water Quality Index Analysis (WQI)
The WQI is the rating method used for determining the pollution status of a waterbody by merging different water quality parameters into a single unit.27 The weighted arithmetic index technique was used to calculate the WQ I.28 In this study, 12 important parameters (Table 2) were selected according to the influence each parameter had on determining the quality of lake water. The classification of quality of waterbody was based on the index value (Table 3).29,1
Table 2: Parameters selected for WQI calculation
Parameter | Standard value (Sn) | Relative weight (Wr) |
8 | 0.062 | |
Turbidity (NTU) | 5 | 0.099 |
EC (µS/cm) | 300 | 0.002 |
TDS (ppm) | 500 | 0.001 |
Total Alkalinity (mg/L as CaCO3) | 120 | 0.004 |
Total Hardness (mg/L as CaCO3) | 300 | 0.002 |
Nitrates (mg/L) | 45 | 0.011 |
Sulphates (mg/L) | 200 | 0.002 |
Phosphates (mg/L) | 0.8 | 0.618 |
Chlorides (mg/L) | 250 | 0.002 |
DO (mg/L) | 5 | 0.099 |
BOD (mg/L) | 5 | 0.099 |
The WQI for water samples is calculated using the equations 1, 2, 3, and 4 given below.
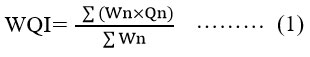
‘Wn’ denotes the unit weight for nth variable and calculated by following equation:
![]()
Qn denotes quality rating for the nth variable, where there are ‘n’ parameters. Qn is calculated using the equation:
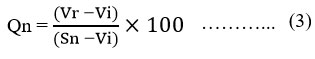
Sn is the Standard permissible limit for each selected parameters set by WHO (2017) and BIS (2012).
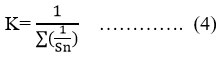
K represents proportionality constant, calculated by the equation:
Vr represents recorded value for each variable
Vi represents ideal value of specific parameter (All parameters were zero except for pH and Dissolved Oxygen (DO), which were 7 and 14.6, respectively)
Table 3: Water Quality Categorization
WQI | Water Quality Status |
< 50 | Excellent |
50-100 | Good |
101-200 | Poor |
201-300 | Very poor |
> 300 | Unsuitable |
Carlson Trophic State Index Analysis
The CTSI, calculated with the formula given below.13 The Trophic state index (TSI) calculated with three independent variables, Secchi depth- ‘SD’, chlorophyll a- ‘Chl-a’, and total phosphorus- ‘TP’ in water. Total TSI including TSI (Chl-a), TSI (SD), TSI (TP), represents the CTSI of water body.
TSI (Chl-a) = 9.81 ln chlorophyll a (µg/L) +30.6
TSI (SD) = 60-14.41 ln SD (meters)
TSI (TP) = 14.42 ln TP (µg/L) +4.15
CTSI = [TSI (TP) + TSI (CA) + TSI (SD)/3]
From the values of TSI (TP), TSI (SD), TSI (Chl-a) and CTSI, trophic state of the waterbody can be categorized and the standard categorisation13 is given in Table 4.
Table 4: Carlson Trophic State Index
CTSI | Trophic Class |
<30–40 | Oligotrophic |
40–50 | Mesotrophic |
50–70 | Eutrophic |
70–100+ | Hypereutrophic |
Interpolation of WQI and CTSI
The IDW method, (Inverse Distance Weighted) in the software ArcGIS10.4 was used to spatially depict the WQI and CTSI data for each of the three seasons for every station under study.
Multivariate Statistics
The analytical data set was statistically analyzed with SPSS software (Statistical Programme for Social Sciences, version 27). Variables including pH, EC, TDS, TH, turbidity, chloride, TA, DO, BOD, NO3-, SO42-, and PO43- were analyzed using Pearson Correlation and Principal Component Analysis (PCA) for the three seasons.
Results
Dynamics of Water Quality Parameters
The average pH of Veli Akkulam Lake varied between 6.9 and 7.9 during the three seasons under consideration, indicating a neutral to slightly alkaline character (Fig. 2.a). According to surface water quality standards,30 inland surface water should have a pH between 6.5 and 8.5. Regarding temporal variation, the PRM had the greatest pH and POM the lowest. The mean turbidity values of 9.63 NTU during PRM, 6.9 NTU in MON and 53.27 NTU in MON exceeded the established acceptable limit of 1–5 NTU. It was found that the PRM had the lowest turbidity while the MON had the highest. When taking into account the spatial variance, station 1 (bar mouth) exhibited the maximum turbidity during the monsoon, measuring 66.3 NTU, (Fig. 2.b). Owing to the temporal shifts, the average EC peaked during POM with a value of 622.26 µS/cm and fell during MON (189.74 µS/cm). When taking into account the spatial variance (Fig. 2. c), the EC falls from station 1 with 979.2 µS/cm during POM as the highest recorded value (bar mouth region) to station 7 (Akkulam lake region) with 105.7 µS/cm, 308.7 µS/cm, and 330.6 µS/cm as the lowest during MON, POM, and PRM, respectively; this pattern was observed during the entire season under study. Similar to the EC concentration, the current investigation reports the highest TDS concentration during POM. The spatial distribution of TDS (Fig. 2.d) shows a higher concentration in the downstream with 587.52 mg/L during the POM in station 1, and then decreasing towards the upstream.
Total alkalinity peaked during the MON with average concentration, 82.86 mg/L and least average 21.43 mg/L during the PRM. TA levels were high in station 1 during MON and POM that is 110 mg/L and 100 mg/L, respectively (Fig. 2.e), and then they continued to decline towards upstream. During PRM, the upstream region had the highest alkalinity of 40 mg/L. Based on the seasonal average of Total hardness, the PRM (660 mg/L) has the highest hardness, and the POM season (105.71 mg/L) has the lowest. Every season shows a similar pattern of geographical variation in hardness (Fig. 2.f), with the lake’s downstream region, which is near the sea, having harder water. The TH decreases as it moves upstream, reaching its lowest value at station 7 (Akkulam Lake) at 56 mg/L. The highest hardness above the permissible concentration of 300 mg/L as CaCO330 was recorded in station 1 (Barmouth region) with concentration, 660 mg/L. The Cl- concentration increased during the POM and MON seasons. Taking regional variation into account, the downstream stations (Veli Lake) had the largest concentration of Cl- ions (Fig. 2.g).
The highest average NO3 concentration was observed in MON (5.12 mg/L), followed by POM (4.58mg/L) and PRM (2.56mg/L). The concentrations were higher in the lake's western (Veli) side than in its eastern (Akkulam) side, indicating a variation in the spatial distribution (Fig. 2.h). The lowest concentration, 1.63 mg/L during PRM, was recorded at station 7 (Akkulam Lake), while the highest concentration, 7.56 mg/L in the MON, was recorded at station 2 (Floating Restaurant Region). While the PO43- ions show more average concentration of 0.34mg/L in the PRM, followed by POM and MON with comparable concentrations, 0.24mg/L and 0.25 mg/L during assessment period. From 0.1 mg/L in 5th site (Middle area) to 0.49 mg/L in 7th site (Akkulam region), the geographical variance (Fig. 2.i) varied. The SO42- ions concentration in downstream regions of Veli-Akkulam Lake were found to contain more SO42- ions than the upstream. Station 3 recorded the highest value during the investigation, 3.25 mg/L of sulphates, during MON (Fig. 2.j). The POM exhibited a higher average concentration of SO42- ions (1.85 mg/L) than the other two seasons.
Dissolved oxygen shows less seasonal variation, ranging from 2.97 mg/L during MON to 3.15 mg/L in POM. Regarding the regional shifts (Fig. 2. k), the DO at station 1 (bar mouth) is 4.68 mg/L during POM and 4.1 mg/L during monsoon. The minimal DO content, 2.15 mg/L was measured in station 7 during PRM. Considering the BOD, PRM had the most significant average BOD (53.16 mg/L), which was followed by MON (52.22 mg/L) and POM (51.60 mg/L). With values of 40.1 mg/L, 32.73 mg/L, 3.4 mg/L during PRM, MON, POM respectively, Station 1 (bar mouth) has the lowest BOD throughout all seasons examined when taking into account the geographical variance (Fig. 2.l). The Akkulam Lake region as well as stations 2 (Floating Restaurant) and 3 (Boat Club), have greater BOD levels in all three seasons.
Water Quality Index (WQI)
Veli Akkulam Lake's water quality fluctuates across time and space space (Figs. 5.a, 5.b, and 5.c). There is observable spatial variation during MON and PRM. ‘Unsuitable’ Water quality has been shown by station 3 (306.6) and 5 (398.47) during PRM and station 7 (312.38) during MON. During MON, the majority of the stations show ‘very poor’ water quality except for stations 1 and 4 with ‘poor’ WQ; these stations show similar quality during PRM and POM also. In PRM station 7, only ‘very poor’ water quality is shown. POM season doesn’t show spatial variation; all stations have ‘poor’ water quality.
Eutrophication status of the lake
Trophic State Index Variables
TSI values of Chlorophyll-a, Total phosphorous, and Secchi depth for the seasons studied are given in table.6. The Veli Akkulam lake has mean TSI (SD) values of 47.24 (PRM), 45.71 (MON), and 52.50 (POM). The Secchi depth (Fig. 4.a) was discovered to be high during MON and POM. The mean chlorophyll a-based TSI for PRM, MON, and POM is 64.85, 58.64, and 43.43, respectively. In comparison to the other two seasons the PRM season had the highest levels of TSI (Chl-a) and chlorophyll a (Fig. 4.b). The spatio-temporal changes in TSI (TP) have average values of 88.14, 97.25, and 93.75 for PRM, MON, and POM, respectively. The MON season has a greater mean concentration of TP (Fig. 4.c) and TSI (TP), with station-wise distribution shows stations 2 and 5 have lower TSI (TP) than all other stations. Also, during POM, stations 5 and 6 exhibit increased TSI (TP).
Carlson’s Trophic State Index (CTSI)
The mean CTSI value indicate that the whole lake will be placed in a eutrophic state during all the seasons studied (Figs. 6.a, 6.b, and 6.c). The mean CTSI showed a higher value for MON (67.20), followed by PRM (66.74) and POM (63.23). During PRM and POM, station 7 shows a hypereutrophic state; this is the Akkulam region.
Discussion
The pH of Veli Akkulam Lake recorded a neutral to slightly alkaline value and the highest pH during PRM compared to other seasons could be due to the increasing input of sewage and other wastes from the urban watershed to the lake18. Higher turbidity is a sign of increased lake pollution.31 The increased turbidity in bar mouth zone is due to increased flow from the watershed and turbulence. Summer lake stratification and an increase in lake productivity during dry seasons are two instances that shows seasonal fluctuations affecting turbidity in lakes.32 The infiltration of marine water into the lake is the cause of the elevated EC in the bar mouth area. However, this high salinity is reduced significantly during the monsoon season when a large volume of freshwater from rain and runoff flows into the lake, diluting the salts and resulting in the lowest EC concentration.33 Similar spatial fluctuations are observed in previous studies of Veli Akkulam Lake.17 The reports by certain studies18,15 in Veli Akkulam Lake support the present study results, and the reasons for this were suggested as the proximity of the sea in the downstream and the discharge of effluents from industries and the organic pollution in the lake. Also, the drainage from the catchment carrying agricultural and sewage wastes influences the TDS concentration.34 The post-monsoon increase in surface runoff contributes to a rise in turbidity and TDS.35
Higher alkalinity in the downstream region is due to the saline water incursion, which results in the interaction between salt and CaCO3, causes this elevated level.36 Also, the increased alkalinity in upstream is because of the catchments' increased organic matter dissolving and draining into the lake.37 The breakdown of organic wastes, the increasing intake of alkaline effluents from sewage and industry, and other factors all affect the spatiotemporal variance in alkalinity.2 According to the alkalinity range, lakes are categorized as hard (> 90 mg/L), medium (40-90 mg/L), and soft (< 40 mg/L).38 This classification places Veli-Akkulam waterbody in soft lake category in the PRM and under the hard to medium lake category during the other two seasons under study. The similar pattern in spatial variation of hardness in all seasons with bar mouth zone having higher TH is due its proximity towards sea as well as intrusion of industrial effluents.18 Higher chloride concentration in PRM points to the increased salinity during the season, similar results was noted in some other studies.2,39,40 In the majority of stations studied, the amount of Cl- exceeds 250 mg/L, which is higher than what is allowed by international standards.27,41
Elevated concentration of NO3-could be due to the increased influx of water during MON from watersheds carrying all urban wastes, industrial effluents, and agricultural runoff.42,37,39 The concentration gradient, with higher values downstream, suggests a unidirectional flow of water from Akkulam to Veli Lake, as well as the region's growing tourism activity and restaurants in the lower zones. Previous studies in the Veli Akkulam lake report similar shifts.14,18 The observed levels of nitrates in surface water fell below the permissible limit of 45 mg/L.30 The decreased nitrate levels within the aquatic environment could be a result of the rapid growth and increased uptake of nutrients by vegetation. The increased uptake and swift growth of aquatic vegetation in the lake may be the cause of the decreased nitrate levels. The enhanced emissions of phosphates from sediments into the overlying water as a result of the lake's sluggish environment is assumed to be the cause of the seasonal increase in PO43- during PRM. Similar spatio-temporal changes for PO43- ions in the Veli Akkulam lake was reported by earlier studies.17,15 It was also stated that PO43- concentration above 0.03 mg/L is enough for eutrophication.43 In this study majority of stations during the study period shows concentration above this limit, indicating the eutrophication status. The sources of phosphates in lacustrine environments are from anthropogenic sources such as sewage, detergents, cattle dung, etc.44, 37 The tidal effect and close proximity to sea causes the elevated concentrations of SO42- ions in Veli lake part. Also, the boat club zone showing significant seasonal variation during monsoon will be because the lake water is more turbulent in that zone and the barrier that separates the lake from the sea has broken. however, the sulphate levels in this research are below the 200 mg/L BIS criteria. Previous study on the Veli Akkulam Lake found a similar spatial fluctuation, with a larger concentration in the lake's downstream portion.18
The major pollution indicator, the dissolved oxygen was found to be below 4 mg/L in all station except bar mouth region indicating severe pollution as allowable limit of DO is 4 mg/L.30 The temperature increase may have caused improved production at station 7, evident by the lowest DO content during PRM.45 On the other hand, higher the BOD greater the pollution and in this study greater BOD levels in all three seasons, indicates more pollution. The watercourses that drain into the lake bring a lot of urban trash to the upstream section of the lake. Higher BOD values are typically found in lake areas with high tourist activity or where streams deposit organic waste.35 Earlier study revealed increased BOD levels exceeding 6 mg/L in the Veli Akkulam lake,18 which supports the findings in this study. Also, it can be noted that Veli Akkulam Lake has greater BOD than other lakes, such as Lake Maninjau, Indonesia46 and Vatadahosahalli Lake in India1. According to a recent study the Veli-Akkulam lake is facing a significant pollution problem, with 72% of its area falling into high-potential pollution zones. The research determined that organic pollutants, such as BOD and ammonia-nitrogen, are the main drivers of this severe contamination.47
Water Quality Index (WQI)
To assess quality of lake water, WQI has been utilized. The various physiochemical components are simplified into one figure that serves as a representation of the lake's water quality.1 In this research study none of the stations show either ‘Excellent’ or ‘Good’ water quality, indicating the heavy pollution load of the lake. Spatio-temporal changes in the lake can depend on the influx of domestic sewage, other anthropogenic contaminants, the degradation of aquatic organic matter, the flow rate, etc. Evaluating the seasonal change, it can be noted that POM shows improved water quality compared to PRM and MON; a similar seasonal change was reported in Lake Phewa, Nepal, Pokhara, and it was suggested that after MON, the water quality improves.39
Eutrophication status
Trophic State Index (TSI) Variables
Increased precipitation and watershed runoff, caused seasonal changes in TSI(SD) with higher value during MON and POM. Similar to TSI (Chl-a), TSI(SD) did not exhibit substantial variation. Increased algal blooms, suspended solids, turbidity, and other meteorological factors—like precipitation—all have an impact on and are essential to Secchi disk depth.48,4 Veli Akkulam Lake was determined to be hypereutrophic in a prior study14 based on TSI (SD). According to TSI (Chl-a),14 previous studies found Veli-Akkulam Lake to be oligotrophic. The disparity with previous studies may be due to the growing fertilizer input and algae bloom in the Lake.14 Increased fertilizer input and the growth of water hyacinth, which is evident in Veli Akkulam Lake, are two of the many variables that lead to the higher prevalence of Chl-a in lake water. The findings of this investigation were corroborated by similar findings revealed in the research conducted in Lake Tana, Ethiopia.4 Static water, temperature, light penetration, increased algal bloom, and other elements are the causes of the seasonal shift in TSI (Chl.-a).4 Also, the current findings were supported by the discovery that a hypereutrophic state in the Veli Akkulam lake13 was correlated with higher TSI (TP) during MON. Changes in turbulence and increased runoff from the watershed, which carries agricultural, industrial, and residential wastes and raises the nitrogen content in lakes,49 are responsible for the seasonal and regional difference.
Carlson’s Trophic State Index (CTSI)
Veli-Akkulam lake is classified as eutrophic based on its mean CTSI. The municipal wastes that contain both organic and inorganic nutrients that are dumped into the lake by the streams are the primary source of the hypereutrophic condition in the Akkulam region. A eutrophic state is displayed by every other station. A eutrophic state is evident at all of the sites under study during the monsoon, the flow of water is consistent along with the breach in the bund, allows nutrients to move from upstream to downstream. It demonstrates that the lacustrine system is extremely rich in macrophytes, algae, and nutrients under eutrophic and hypereutrophic conditions, which causes oxygen to be depleted and other aquatic species to perish.50
Multivariate Statistical Interpretations
Pearson Correlation Matrix
The research study employed Pearson correlation analysis for identifying the interrelationship between the water quality parameters (Tables 5.1, 5.2, and 5.3) of PRM, MON, and POM seasons. The matrix reveals a strong correlation between EC and TDS (p>0.01, r=1) and chloride (p>0.01, r=0.9) across all studied seasons. This correlation can be attributed to the increased electric conductivity caused by the higher dissolved solids, as well as the indication of increased salinity due to the presence of chloride ions.51 The link between DO and BOD is significantly inverse(p>0.01, r=0.9). DO and BOD are usually inversely correlated; increased organic matter in a lake induces organisms to break it down, which raises BOD.52 Sulphate ions show a strong increasing correlation with the parameter’s chloride, EC, and TDS during PRM and POM, while they show only a moderately increasing correlation with pH (p>0.05, r=0.78) and TA (p>0.05, r=0.8). The influence of SO42- with TDS proposes that the dissolved SO42-anion causes the increased TDS in water and thereby the EC.39 The relationship between SO42- and Cl- ions indicates that both anions originate from comparable sources, which may include seawater incursion and the lake's stagnant water during both seasons. The pH and PO43- levels showed a strong inverse relationship (p>0.01, r= -0.98) during the post-monsoon (POM) season and a moderately negative relation with EC (p>0.05, r= -0.76), TDS (p>0.05, r= -0.76), SO42- (p>0.05, r= -0.76), and Cl- (p>0.05, r= -0.78). Phosphate release and absorption in the lake water are highly dependent on pH.53 Nitrate shows a significantly strong interlink with EC (p>0.01, r=0.92), TDS (p>0.01, r=0.92), TH (p>0.01, r=0.94), and Cl- (p>0.01, r=0.93) in the MON season. This can be due to the increased influx of nitrate-rich organic pollutants carried from urban catchments to the lake by runoff.14 During POM, NO3- (p > 0.05, r = 0.79) shows moderate positive association with chloride ions. The pH of the Veli Akkulam lake was lowest during the POM in the current study, and it shows a positive correlation with variables such as EC (p>0.05, r= 0.76), TDS (p>0.05, r= 0.76), SO42- (p>0.05, r= 0.78), and Cl- (p>0.05, r= 0.79). In the MON season, another moderate correlation in decreasing order was shown by turbidity with Cl- (p > 0.05, r = 0.76), TH (p > 0.05, r = 0.76), TDS (p > 0.05, r = 0.8), and EC (p > 0.05, r = 0.8), similar results were reported in Lake Tana, Ethiopia.54 According to the association between the variables, the primary cause of the temporal change in the lake under study is the sand bar that separates the lake from the sea breaking during the MON season. The flow rate, turbulence, and every other parameter are affected by this breakage.14
Principal Component Analysis (PCA)
A statistical technique used for compressing the data dimensions of multivariate matrix is PCA.40,55 The PC shows significance with an eigenvalue > 1 in all three seasons studied. PC analysis results provided 3 components for each season studied, and they are given in Fig. 4.a, 4.b and 4.c. Considering the PRM, it has a total extracted variance of 89. 65% from PCA. The PC1 showing the highest variance among the three components has a total variance of 45.294 %. It carries strong loadings on EC, TDS, TH, SO42, and Cl-. This shows the significant impact of inorganic and organic pollutants from allochthonous sources.55 Also, it shows moderate negative loading for pH, showing the effect of reduced pH for other variables positive correlation. Component 2 shows strong negative loading for DO and strong positive loading for BOD; as the DO increases, it reduces the demand for oxygen by organic decomposers. While PC3 shows strong loading for TA and moderate loading of PO43- and turbidity, this illustrates the increased deposition of inorganic pollutants and the increased alkalinity. During MON, PCA contributed a total extracted variance of 92.9%, and its PC 1 had a percentage variance of 52.02 with strong loadings for EC, TDS, TA, TH, NO3-, and Cl-. This expresses the component with anthropogenic sources of pollutants.51 In PC2, pH shows moderate loading, and in PC3, PO43- exhibits moderate loading; this factor expresses the inorganic pollutant load. PC2 exhibits strong positive loading for DO and strong negative loading for BOD; these factors are always inversely correlated. POM also exhibits similar loading in PC2. The other season, POM, with a total variance of 92.67%, has more factor loadings in PC1 with a total variance of 55.39%, including the factor loadings for EC, TDS, TA, TH, NO3- , Cl-, SO42-, and PO43- with moderate negative loading. This shows the increased influx of organic and inorganic pollutants with a negative correlation with the PO43- ions. The increased urban sewage causes more pollution load in Veli Akkulam Lake. In PC3, strong loading was exhibited by turbidity along with moderate negative loading for PO43-. The component loading correlation points to the fact that the factors expressing the organic and inorganic pollutants from anthropogenic sources contribute to the Veli Akkulam lake pollution.
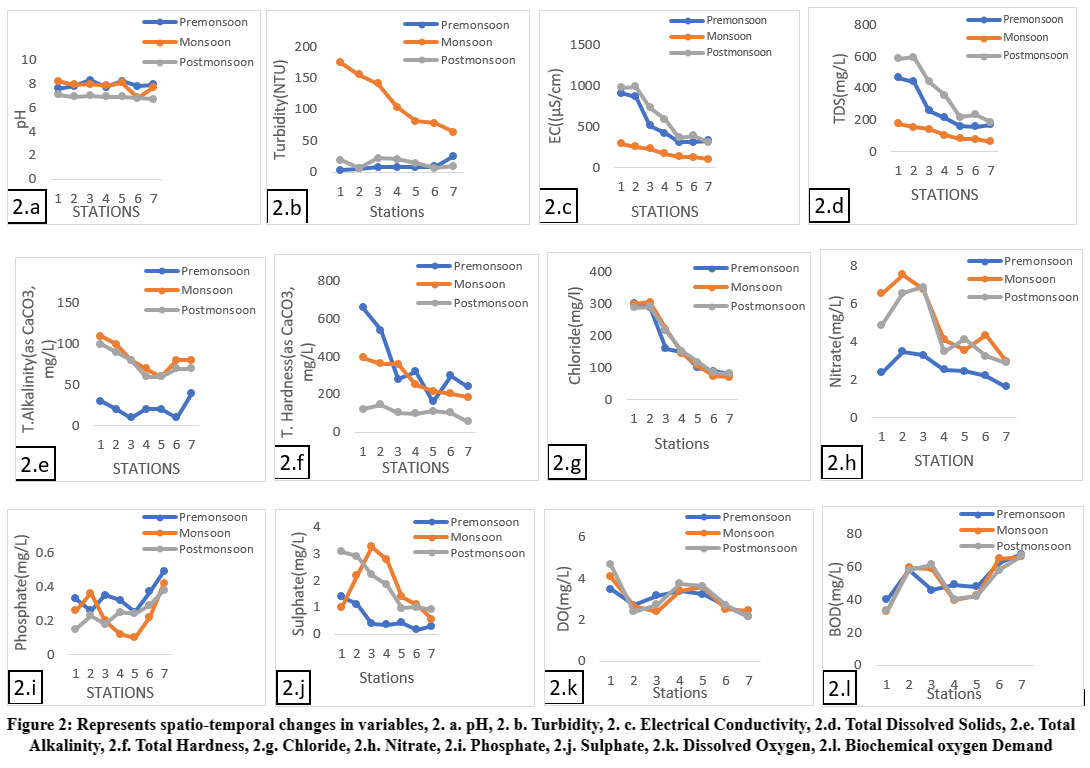 | Figure 2. Represents spatio-temporal changes in variables, 2. a. pH, 2. b. Turbidity, 2. c. Electrical Conductivity, 2.d. Total Dissolved Solids, 2.e. Total Alkalinity, 2.f. Total Hardness, 2.g. Chloride, 2.h. Nitrate, 2.i. Phosphate, 2.j. Sulphate, 2.k. Dissolved Oxygen, 2.l. Biochemical oxygen Demand
|
Table 5.1. Pearson's Correlation Analysis of Water Quality Parameters -Premonsoon season
pH | Turbidity | EC | TDS | T. | T. Hardness | Nitrate | Sulphate | Phosphate | Chloride | DO | BOD | |
pH | 1 | 0.120 | -0.439 | -0.438 | -0.362 | -0.678 | 0.267 | -0.460 | -0.089 | -0.447 | -0.034 | -0.073 |
TURBIDITY | 1 | -0.538 | -0.535 | 0.612 | -0.502 | -0.657 | -0.504 | .835* | -0.616 | -.778* | 0.715 | |
EC | 1 | 1.000** | 0.137 | .944** | 0.525 | .957** | -0.366 | .992** | 0.301 | -0.422 | ||
TDS | 1 | 0.146 | .944** | 0.518 | .960** | -0.364 | .991** | 0.302 | -0.425 | |||
T.Alkalinity | 1 | 0.179 | -0.591 | 0.288 | 0.489 | 0.072 | -0.337 | 0.219 | ||||
T. Hardness | 1 | 0.310 | .912** | -0.226 | .935** | 0.268 | -0.338 | |||||
Nitrate | 1 | 0.354 | -0.670 | 0.570 | 0.339 | -0.374 | ||||||
Sulphate | 1 | -0.397 | .947** | 0.339 | -0.462 | |||||||
Phosphate | 1 | -0.456 | -0.639 | 0.557 | ||||||||
Chloride | 1 | 0.389 | -0.481 | |||||||||
DO | 1 | -.952** | ||||||||||
BOD | 1 |
*. Correlation is significant at the 0.05 level (2-tailed).
**. Correlation is significant at the 0.01 level (2-tailed).
Table 5.2. Pearson's Correlation Analysis of Water Quality Parameters -
pH | Turbidity | EC | TDS | T. | T. | Nitrate | Sulphate | Phosphate | Chloride | DO | BOD | |
pH | 1 | -0.401 | 0.541 | 0.541 | 0.194 | 0.558 | 0.327 | 0.231 | -0.058 | 0.582 | 0.538 | -0.612 |
TURBIDITY | 1 | -.800* | -.800* | -0.356 | -.768* | -0.705 | -0.670 | 0.419 | -.755* | -0.443 | 0.595 | |
EC | 1 | 1.000** | .772* | .991** | .923** | 0.375 | 0.081 | .980** | 0.332 | -0.408 | ||
TDS | 1 | .772* | .991** | .923** | 0.375 | 0.081 | .980** | 0.332 | -0.408 | |||
T.Alkalinity | 1 | 0.735 | 0.722 | -0.168 | 0.581 | .776* | 0.136 | -0.082 | ||||
T. Hardness | 1 | .939** | 0.429 | 0.091 | .969** | 0.252 | -0.342 | |||||
Nitrate | 1 | 0.464 | 0.178 | .927** | -0.008 | -0.070 | ||||||
Sulphate | 1 | -0.420 | 0.353 | -0.172 | -0.078 | |||||||
Phosphate | 1 | 0.179 | -0.463 | 0.562 | ||||||||
Chloride | 1 | 0.285 | -0.349 | |||||||||
DO | 1 | -.965** | ||||||||||
BOD | 1 |
*. Correlation is significant at the 0.05 level (2-tailed).
**. Correlation is significant at the 0.01 level (2-tailed).
Table 5.3. Pearson's Correlation Analysis of Water Quality Parameters - Post monsoon season.
pH | Turbidity | EC | TDS | T. | T. | Nitrate | Sulphate | Phosphate | Chloride | DO | BOD | |
pH | 1 | 0.668 | .757* | .757* | 0.598 | 0.633 | 0.613 | .777* | -.981** | .780* | 0.728 | -0.649 |
TURBIDITY | 1 | 0.242 | 0.242 | 0.001 | -0.020 | 0.242 | 0.308 | -0.600 | 0.265 | 0.610 | -0.512 | |
EC | 1 | 1.000** | .846* | 0.753 | 0.751 | .996** | -.760* | .989** | 0.319 | -0.300 | ||
TDS | 1 | .846* | 0.753 | 0.751 | .996** | -.760* | .989** | 0.319 | -0.300 | |||
T.Alkalinity | 1 | 0.521 | 0.596 | .840* | -0.563 | .843* | 0.197 | -0.093 | ||||
T. Hardness | 1 | 0.667 | 0.703 | -0.731 | .762* | 0.301 | -0.391 | |||||
Nitrate | 1 | 0.720 | -0.692 | .793* | -0.073 | 0.101 | ||||||
Sulphate | 1 | -.764* | .984** | 0.365 | -0.335 | |||||||
Phosphate | 1 | -.781* | -0.642 | 0.586 | ||||||||
Chloride | 1 | 0.326 | -0.308 | |||||||||
DO | 1 | -.967** | ||||||||||
BOD | 1 |
*. Correlation is significant at the 0.05 level (2-tailed).
**. Correlation is significant at the 0.01 level (2-tailed).
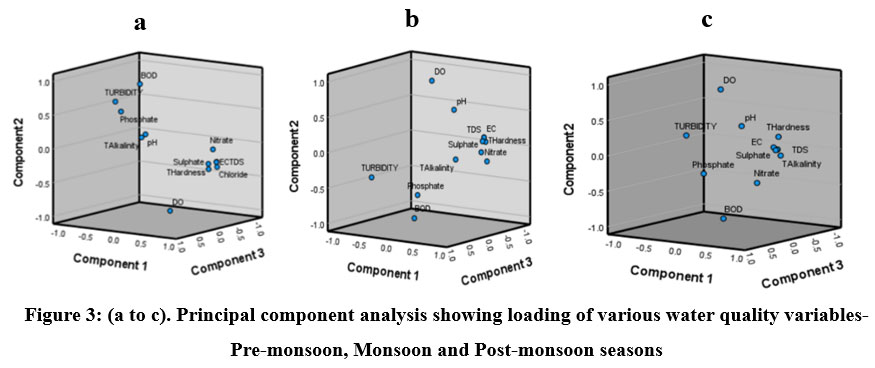 | Figure 3: (a to c). Principal component analysis showing loading of various water quality variables- Pre-monsoon, Monsoon and Post-monsoon seasons
|
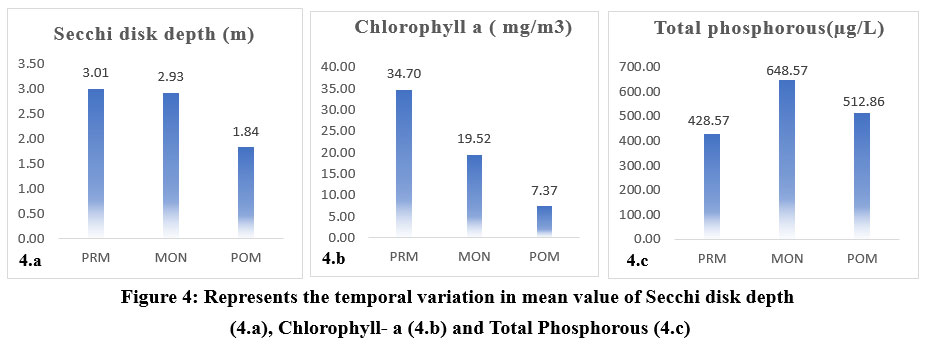 | Figure 4: Represents the temporal variation in mean value of Secchi disk depth (4.a), Chlorophyll- a (4.b) and Total Phosphorous (4.c).
|
Table 6: Trophic state Index value of Total Phosphorous, Chlorophyll a and Secchi depth
Station | TSI (TP) | TSI (Chl a) | TSI(SD) | ||||||
PRM | MON | POM | PRM | MON | POM | PRM | MON | POM | |
S1 | 92.87 | 97.10 | 94.87 | 68.24 | 66.59 | 50.17 | 43.47 | 46.23 | 52.35 |
S2 | 57.34 | 91.25 | 92.87 | 68.66 | 63.29 | 45.26 | 48.97 | 46.80 | 53.23 |
S3 | 97.32 | 99.42 | 86.87 | 64.35 | 55.83 | 26.82 | 34.18 | 33.48 | 41.95 |
S4 | 95.40 | 97.32 | 91.59 | 60.08 | 55.23 | 26.36 | 35.43 | 45.69 | 54.16 |
S5 | 90.55 | 95.90 | 97.10 | 60.34 | 60.28 | 53.81 | 49.31 | 50.01 | 49.31 |
S6 | 88.62 | 99.61 | 97.55 | 64.51 | 53.02 | 39.27 | 54.16 | 51.53 | 52.35 |
S7 | 94.87 | 100.18 | 95.40 | 67.79 | 56.21 | 62.33 | 65.14 | 46.23 | 64.15 |
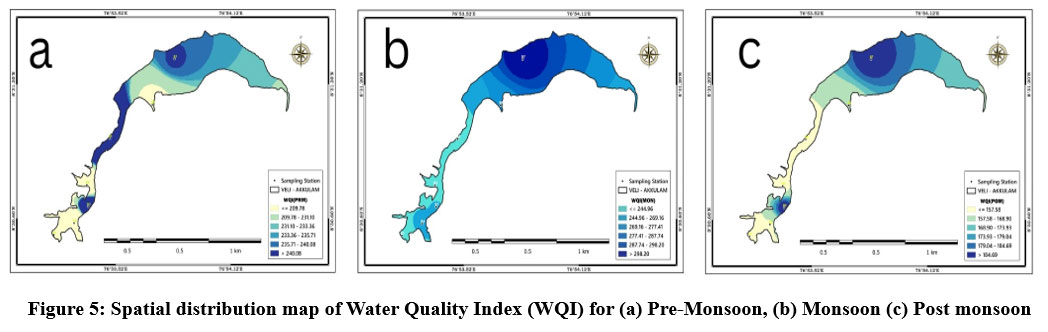 | Figure 5: Spatial distribution map of Water Quality Index (WQI) for (a) Pre-Monsoon, (b) Monsoon (c) Post monsoon
|
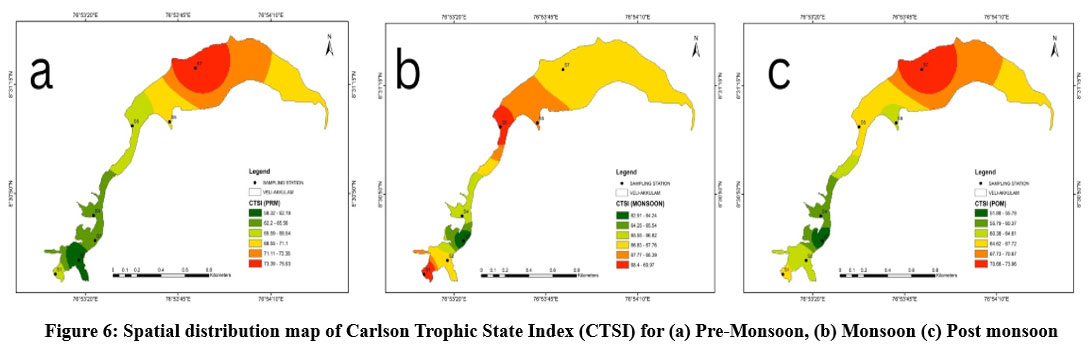 | Figure 6: Spatial distribution map of Carlson Trophic State Index (CTSI) for (a) Pre-Monsoon, (b) Monsoon (c) Post monsoon
|
Conclusion
Veli Akkulam Lake's water quality metrics exhibit significant regional and seasonal variation, as per the results of the current study. Variables fluctuate due to the collapse of the lake's sandbar and variations in runoff from urban catchments. The lake has significant turbidity, EC, TDS, and BOD levels, as well as a decreased DO level, indicating pollution stress. The principal component analysis over three seasons demonstrated pollution stress induced by anthropogenic sources in this lake. The nutrient concentration and chlorophyll a level demonstrated the lake's enhanced productivity and eutrophication. All index calculations indicate that the lake is in imminent risk of degradation with a hypereutrophic state and poor water quality. The Akkulam lake region is identified as a hotspot of pollution with more nutrient concentration and low DO compared to the Veli lake region. The stressors in the lake were recognized as urban sewage, industrial effluents, tourism activities, poor waste management, and so on. This report documents the assessment and monitoring of the lake's pollution status, as well as evidence of major risks to the lake. Lake conservation should be achieved through proper mitigation measures such as aquatic weed removal, dredging, sewage treatment at the source, the application of laws and regulations for waste disposal and management, environmentally conscious tourism, the adoption of sustainable farming methods, and so on.
Acknowledgement
First author gratefully acknowledges University Grants Commission for granting the financial assistance as UGC- JRF and SRF for this research study. Also, the authors are thankful to Registrar, University of Kerala for providing the laboratory and library facilities. The authors extend sincere thanks to Mr. Alwyn Biju for the assistance carried out during sampling and also to Mrs. Lekshmi M, GIS Analyst, Department of Environmental Sciences, University of Kerala and Mr. Amaljith A for the help rendered for the GIS analysis.
Funding sources
Adithya S Suresh gratefully acknowledge University Grants Commission, New Delhi for granting the financial assistance as UGC-JRF & SRF for this research study (NTA ref. No: 190520193558).
Conflict of Interest
The authors do not have any conflict of interest.
Data Availability Statements
All data generated or analysed during this study are included in this article.
Ethics Statement
This research did not involve human participants, animal subjects, or any material that requires ethical approval.
Informed Consent Statement
This study did not involve human participants, and therefore, informed consent was not required.
Permission to reproduce material from other sources
Not Applicable
Authors' Contribution
Adithya Sheeba Suresh:Conceptualization, Methodology, Investigation, Data Curation, Software Analysis, writing original draft.
Jaya Divakaran Sarasamma: Conceptualization, Methodology, Editing and Reviewing, Supervising
Sherly Williams Elsie: Conceptualization and Reviewing
Anoop Raj Leena: Conceptualization and Reviewing
References
- Kapani, K., Charantimath, N. V., Chikkanarayanaswamy, P., and Jayaramaiah, U. Assessing the water quality of Vatadahosahalli Lake in Chikkaballapura district, Karnataka, India. HydroResearch. 2024; 7: 326-336.
CrossRef - Sudarshan, P., Mahesh, M. K., and Ramachandra, T. V. Assessment of seasonal variation in water quality and water quality index (WQI) of Hebbal Lake, Bangalore, India. Environment and Ecology. 2019; 37(1B): 309-317.
- Shatnawi, N., Abu-Qdais, H., Abu-Dalo, M., & Salem, E. K. Assessing water quality of a lake using combination of drone images and artificial intelligence models. The Egyptian Journal of Remote Sensing and Space Sciences. 2025; 28(3): 426-435.
CrossRef - Nerae, M. D., Kebedew, M. G., Abebe, B. A., Moges, M. A., Zimale, F. A., Asres, B. W, et al. Assessment of pollution and trophic state of a water hyacinth infested tropical highland lake: Lake Tana in Ethiopia. Sustainable Water Resources Management. 2024; 10(5):175.
CrossRef - Ho, L. T., and Goethals, P. L. Opportunities and challenges for the sustainability of lakes and reservoirs in relation to the Sustainable Development Goals (SDGs). Water. 2019; 11(07): 1462.
CrossRef - Mammides, C. A global assessment of the human pressure on the world's lakes. Global Environmental Change. 2020; 63: 102084.
CrossRef - Athira, N., and Jaya, D. S. Assessment of water quality status of Anjarakandy River in Kannur district of Kerala. Asian J. Environ. Sci. 2014; 9(2): 68-74.
CrossRef - Sajeev, S., Sekar, S., Kumar, B., Senapathi, V., Chung, S. Y., and Gopalakrishnan, G. Variations of water quality deterioration based on GIS techniques in surface and groundwater resources in and around Vembanad Lake, Kerala, India Geochemistry. 2020; 80(4): 125626.
CrossRef - Wu, R., Zhang, S., Liu, Y., et al., Spatiotemporal variation in water quality and identification and quantification of areas sensitive to water quality in Hulun lake, China. Ecological Indicators. 2023; 149: 110176.
CrossRef - Dharmarathna, D., Galagedara, R., Himanujahn, S., Karunaratne, S., and Athapattu, B. Assessment of pollution state of Beira Lake in Sri Lanka using water quality index, trophic status, and principal component analysis. Aquatic Ecology. 2024; 58(2): 159-174.
CrossRef - Akinnawo, S. O. Eutrophication: Causes, consequences, physical, chemical and biological techniques for mitigation strategies. Environmental Challenges. 2023; 12: 100733.
CrossRef - Tantu, S. T., Yilma, S. M., and Mary, K. Q. Water quality characterization of Lake Abaya, a water body under increasing anthropogenic pressure in Southern Ethiopia. Sustainable Water Resources Management. 2024; 10(4): 143.
CrossRef - Carlson, R. E. A trophic state index for lakes 1. Limnology and oceanography. 1977; 22(2): 361-369.
CrossRef - Sheela, A. M., Letha, J., and Joseph, S. Environmental status of a tropical lake system. Environmental monitoring and assessment.2011; 180: 427-449.
CrossRef - Sheela, A. M., Letha, J., Sabu, J., Jobin, T., and Justus, J. Effect of nutrients on bioaccumulation of heavy metals in a tropical urban coastal lacustrine system. Water Environment Research. 2014; 86(6): 513-52.
CrossRef - Navami, S. S., and Jaya, D. S. Assessment of pollution stress on the physio-biochemical characteristics of mangrove species in Akkulam-Veli Lake, South India. Global Journal of Environmental Research. 2013; 7 (2): 26.
- Abhijna, U. G. and Biju, K. A. Biomonitoring for pollution assessment: a case study in Veli-Akkulam and Vellayani Lakes, South West coast of Kerala. J Aquat Biol Fish. 2016; 3: 80-89.
- Abhijna, U. G. Monitoring and assessment of a eutrophicated coastal lake using multivariate approaches. Global Journal of Environmental Science and Management. 2016; 2(3): 275-288.
- Moses, S. A., Sarasamma, J. D., Sethulekshmi, N. S., andVijayakumari, B. K. Effects of water quality on mangroves in an urban lake system. Lakes and Reservoirs: Research and Management. 2018; 23(3): 230-243.
CrossRef - Shah, R. A., Achyuthan, H., Puthan-Veettil, R. S., Derwaish, U., and Rafiq, M. Sediment distribution pattern and environmental implications of physico-chemical characteristics of the Akkulam-Veli Lake, South India. Applied Water Science. 2019; 2023(9): 1-11.
CrossRef - Gao, J., Li, J., Tong, T., Chao, J., Dong, Z., & Zhan, J. (). Water quality evaluation, pollution sources apportionment, and environment management strategies in plain reservoirs: A case study of Tianhe Lake, China. Ecological Indicators. 2025; 175: 113491.
CrossRef - Sajinkumar, K. S., Revathy, A., and Rani, V. R. Hydrogeochemistry and spatio-temporal changes of a tropical coastal wetland system: Veli-Akkulam Lake, Thiruvananthapuram, India. Applied Water Science, 2017; 7: 1521-1534.
CrossRef - State Wetland Authority Kerala (SWAK) https://swak.kerala.gov.in/images/pdf/wetland-notifications/1.Aakkulam-kayal.pdf. Publication date unavailable. Updated 07 May, 2025.
- Suresh, A. S., Jaya, D. S., & Sherly Williams, E. Biogenic element concentration and TOC/N ratio analysis in Veli-Akkulam Lake, Kerala: seasonal changes and urbanization impacts. Environmental Monitoring and Assessment, 2025;197(7):727.
CrossRef - APHA, 2017. In: Baird, R.B., Eaton, A.D., Rice, E.W. (Eds.), Standard Methods for the Examination of Water and Wastewater, 23th ed. American Public Health Association, American Water Works Association, Water Environment Federation, Washington, DC, USA.
- Trivedy, R.K., Goel, P.K., Trisal, C.L. Practical Methods in Ecology and Environmental Science. Enviro media Publications, Karad, India. 1987; p.40.
- Reghunadh, K., Antony, S., Arun, V., et al., Impact of stone quarries on groundwater quality at Achenkovil River Basin, Southern Western Ghats, India: Investigation using WQI and GIS. Environmental Quality Management. 2023; 33(2): 325-341.
CrossRef - Brown, R.M., McClelland, N.I., Deininger, R.A., O’Connor, M.F. A Water Quality Index — Crashing the Psychological Barrier. In: Thomas, W.A. (eds) Indicators of Environmental Quality. Environmental Science Research. 1972; 1 (6): 787-797.
CrossRef - Krishnakumar, A., Aditya, S. K., Anoopkrishnan, K., Das, R., and Anju, K. Water quality management: Development of a fuzzy-based index in hydro informatics platform. In Current Directions in Water Scarcity Research. 2022; 7: pp. 265-284).
CrossRef - Bureau of Indian Standards. Drinking water—Specification, IS 10500: 2012, New Delhi. 2012.
- Ahipathy, M.V. and Puttaiah, E.T. Ecological characteristics of Vrishabhavathy River in Bangalore (India). Environ Geol. 2006; 49: 1217–1222.
CrossRef - Stefanidis, K., Varlas, G., Papaioannou, G., Papadopoulos, A., and Dimitriou, E. Assessing temporal variability of lake turbidity and trophic state of European lakes using open data repositories. Science of The Total Environment. 2023; 857: 159618.
CrossRef - Vijayan, N. Surveillance of the Water Quality Ascertainment of Vellayani Lake. International Journal of Engineering Research and Technology (IJERT). 2018; 2278-0181.
- Sallam, G. A., and Elsayed, E. A. Estimating the impact of air temperature and relative humidity change on the water quality of Lake Manzala, Egypt. JNRD-Journal of Natural Resources and Development. 2015; 76-87.
CrossRef - Dawn, A., Hinge, G., Kumar, A., Nikoo, M. R., & Hamouda, M. A. Assessment of Water Quality in Urban Lakes Using Multi-Source Data and Modeling Techniques. Sustainability. 2025;17(16):7258.
CrossRef - Tambekar, D. H., Pawar, A. L., and Dudhane, M. N. Lonar lake water: past and present. Nature, Environment and Pollution Technology. 2010; 9(2): 217-221.
- Maansi, Jindal, R. & Wats, M. Evaluation of surface water quality using water quality indices (WQIs) in Lake Sukhna, Chandigarh, India. Appl Water Sci. 2022; 12: 2.
CrossRef - Moyle, J. B. Some chemical factors influencing the distribution of aquatic plants in Minnesota. The American Midland Naturalist, (1945); 34(2), 402–420.
CrossRef - Gautam, R., & Shrestha, S. M. Hydrogeochemical evaluation and characterization of water quality in the Phewa Lake, Pokhara, Nepal. Environmental Science and Pollution Research. 2024; 31(50): 60568-60586.
CrossRef - Adejuwon, E. O., Ogwueleka, T. C., Ogungbemi, E. O., Prabhu, R., Rendon-Nava, A., and Yates, K. Assessment of Surface Water Quality Using Chemometric Tools: A Case Study of Jabi Lake, Abuja, Nigeria. Iranian Journal of Science and Technology, Transactions of Civil Engineering. 2025; 1-24.
CrossRef - Cotruvo, J. A. 2017 WHO guidelines for drinking water quality: first addendum to the fourth edition. Journal?American Water Works Association. 2017; 109(7); 44-51.
CrossRef - Bhat, S. A., & Pandit, A. K. Surface water quality assessment of Wular Lake, a Ramsar site in Kashmir Himalaya, using discriminant analysis and WQI. Journal of Ecosystems, 2014; 2014(1): 724728.
CrossRef - Sawyer, C. N., Lackey, J. B., and Lenz, R. T. An investigation of the odor nuisance occurring in the Madison Lakes-Monona, Waubesa and Kegonsa from July 1942 to July 1943, Report of the Governor’s Committee, Madison, Wis (TwoVolumes). 1945
- Verma Pradeep, V. P., Chandawat Deepika, C. D., Gupta Urvi, G. U., and Solanki Hitesh, S. H. Water quality analysis of an organically polluted lake by investigating different physical and chemical parameters. International Journal of Research in Chemistry and Environment (IJRCE). 2012; 2(1): 105-111.
- Andrabi, S., Bakhtiyar, Y., Yousuf, T., Akhtar, M., & Nissar, S. Water quality assessment in relation to fish assemblage using multivariate analysis in Manasbal Lake, Kashmir. Water Science. 2024; 38(1): 92-108.
CrossRef - Komala, P. S., Soeprobowati, T. R., Takarina, N. D., Subehi, L., Wojewódka-Przyby?, M., Primasari, B., et al. Spatio-temporal Changes of Water Quality Based on Water Quality Index Method in Tropical Lake of Indonesia. Water, Air, and Soil Pollution. 2023; 234(9): 594.
CrossRef - Sagar, M. V., Sheela, A. M., Joseph, S., & Ghosh, D. Identification of pollution potential zones of a coastal lake system using GIS techniques. In Ecohydrology of Kerala. Elsevier. 2025: 239-256.
CrossRef - Mohammed, A., Mengistou, S., and Fetahi, T. Evaluation of water quality and trophic status in relation to seasonal water mixing in a highland Lake Ardibo, Ethiopia. Water Science and Technology. 2024;89(10):2703-2715.
CrossRef - Saturday, A., Lyimo, T. J., Machiwa, J., and Pamba, S. Spatio-temporal variations in physicochemical water quality parameters of Lake Bunyonyi, Southwestern Uganda. SN Applied Sciences. 2021; 3(7): 684.
CrossRef - Bhagowati, B., and Ahamad, K. U. A review on lake eutrophication dynamics and recent developments in lake modeling. Ecohydrology and Hydrobiology. 2019; 19(1): 155-166.
CrossRef - Rusydi, A. F. Correlation between conductivity and total dissolved solid in various type of water: A review. In IOP conference series: earth and environmental science. IOP publishing. 2018; 118: 012019.
CrossRef - Bhateria, R., and Jain, D. Water quality assessment of lake water: a review. Sustainable water resources management. 2016; 2: 161-173.
CrossRef - Gomez, E., Durillon, C., Rofes, G., and Picot, B. Phosphate adsorption and release from sediments of brackish lagoons: pH, O2 and loading influence. Water research. 1999; 33(10):2437-2447.
CrossRef - Womber, Z. R., Zimale, F. A., Kebedew, M. G., Assefa, M. L., and Ayalew, D. W. Assessment of Spatiotemporal Variation of Water Quality of Lake Tana, Ethiopia. Poly Journal of Engineering and Technology (PJET). 2022; 1(1): 64-85.
- Dhanush, S. K., Murthy, M., Ayyappa, S., Prabhuraj, D. K., and Verma, R. Water quality assessment of Bheemasandra Lake, South India: A blend of water quality indices, multivariate data mining techniques, and GIS. Environmental Science and Pollution Research. 2024; 1-20.
CrossRef


