Topographic Influence on the Spatial Distribution of Drinking Water Services in Taiz City, Yemen
Ahlam Mohammed Anaam
*
 , Parag Arun Khadke
and Pramod Baburao Waghmare
, Parag Arun Khadke
and Pramod Baburao Waghmare
1
Department of Geography,
School of Earth Sciences,
Swami Ramanand Teerth Marathwada University,
Nanded,
Maharashtra
India
http://dx.doi.org/10.12944/CWE.20.3.33
Copy the following to cite this article:
Anaam A. M, Khadke P. A, Waghmare P. B. Topographic Influence on the Spatial Distribution of Drinking Water Services in Taiz City, Yemen. Curr World Environ 2025;20(3). DOI:http://dx.doi.org/10.12944/CWE.20.3.33
Copy the following to cite this URL:
Anaam A. M, Khadke P. A, Waghmare P. B. Topographic Influence on the Spatial Distribution of Drinking Water Services in Taiz City, Yemen. Curr World Environ 2025;20(3).
Download article (pdf)
Citation Manager
Publish History

Introduction
Topography plays a pivotal role in shaping human activities in their various forms and exerts a profound influence on the formation and spatial configuration of cities1. Among the services most closely tied to topographical features is the distribution of drinking water, which is significantly affected by factors such as slope gradients, elevation variation, and directional flow. These, in turn, influence hydraulic pressure, pumping efficiency, and overall network performance.2 Water remains a fundamental human necessity.3 required for basic functions such as drinking, cooking, cleaning, and personal hygiene—factors that directly impact public health and human well-being.4 Inequalities in access to water and sanitation services are often attributed to disparities in freshwater resources, income levels, institutional capacities,5 and, crucially, the physical geography and infrastructure performance.6 The impact of terrain on water distribution networks is evident in the spatial extent and layout of pipe networks, pipe diameters across different areas, water losses during pumping and pressure fluctuations, and elevated production and distribution costs.7,8 These challenges are particularly pronounced in Taiz City, Yemen, which is characterized by rugged terrain and suffers from both water scarcity and an imbalance in the spatial distribution of drinking water services, despite being one of the most important urban centers in Taiz Governorate. In this context, Taiz faces severe challenges due to its complex elevation profile, which ranges between 1,150 and 1,700 meters above sea level. Steep gradients and high-altitude zones contribute to pressure losses, increased pipe breakage, and high operational costs. According to reports by the Taiz Local Water and Sanitation Corporation, network coverage does not exceed 51.6% of the population, concentrated primarily in the central and northern zones with moderate terrain. In contrast, highland areas in the southeastern and western zones receive less than 48.4% coverage, with some neighborhoods accessing piped water only once every three months.9 Consequently, per capita water availability has dropped to 33.2 liters per person per day,10—well below the World Health Organization’s (WHO) minimum guideline of 50–100 liters per capita per day.11 Which is necessary to ensure basic public health, hygiene, and domestic needs. WHO and UNICEF further classify water access below 50 L/day as indicative of severe water stress, with adverse effects on public health and quality of life.12 In urban settings, this figure should not fall below 80 L/day, and may reach up to 200 L/day in cities with comprehensive sewerage systems, as outlined by the Bureau of Indian Standards (LPCD).4 In light of these challenges, this study aims to analyze the spatial influence of topography on the efficiency of the drinking water distribution network in Taiz City, based on official reports and field-based spatial assessments. The research utilizes Geographic Information Systems (GIS), the Global Positioning System (GPS), and EPANET hydraulic simulation tools to propose practical, future-oriented solutions grounded in empirical data. Recent studies have underscored the importance of integrating spatial data with hydraulic modelling to evaluate network performance and identify weak points.13,14 These approaches advocate for designing water distribution systems in accordance with Digital Elevation Models (DEMs) and emphasize the utility of tools like EPANET, which facilitate long-term simulations of pressurized pipe systems and water quality, while enabling dynamic adjustment of system parameters to enhance service equity and operational resilience.15,16 Especially in areas suffering from water scarcity and relying entirely on groundwater as the primary source of supply.17 Accordingly, this study seeks to uncover the spatial realities of water service distribution in Taiz, providing engineers and decision-makers with a comprehensive hydrological and technical basis for designing equitable and cost-efficient water systems. It also aims to explore the topographical characteristics of the study area and assess their impact on water service provision, while analyzing all stages of water transmission—from source to consumer—across the city’s supply network. In addition, the study presents a set of practical recommendations on how to leverage the hills and plateaus in the region to improve network efficiency and water accessibility for the city’s population.
Materials and Methods
This study utilizes Geographic Information Systems (GIS) and hydraulic modeling, as implemented in EPANET, to assess the performance of Taiz City’s drinking water distribution network. The spatial boundaries of the city are defined by longitudes 43°57’05”–44°04’25” E and latitudes 13°33’25”–13°36’54” N, encompassing an area of approximately 38 km². The assessment focuses on three urban districts—Al-Qahirah, Salh, and Al-Mudhaffar—which together comprise 182 residential neighborhoods and a population of 683,112. Data sources for this analysis included recent satellite imagery, digital topographic maps, water network maps, reports from the Local Water Corporation, the 2014 population census data, and field interviews with water system engineers and technicians. Spatial data were processed using ArcGIS 10.8.1 by integrating multiple thematic layers, such as pipelines, reservoirs, pumping stations, population distribution, and a 30-meter resolution Digital Elevation Model (DEM). Spatial analysis tools, including Buffer, Overlay, and Spatial Join, were employed to assess pressure efficiency and identify service deficiencies. Field validation was carried out using GPS devices, and technical interviews were conducted to enhance the accuracy of spatial interpretation. For hydraulic simulation, a digital model of the water distribution network was developed in EPANET, featuring three main reservoirs (Central, Eastern, and Southern) and 16 pipes, constructed from either PVC or Ductile Iron, which were parameterized using a Hazen–Williams roughness coefficient (C = 130). Demand nodes were assigned based on population density and elevations derived from the DEM to account for terrain effects on hydraulic pressure. Reports from the Local Water Corporation indicate that service coverage falls short of 70%, highlighting the model's crucial role in identifying low-pressure zones and potential leakage points.
Results and Discussion
Water Network Service
The water distribution network service is provided within Taiz city through the local water and sanitation corporation as a governmental entity licensed by the Ministry of Water and Environment in the Republic of Yemen. When comparing the services provided from 2004 to 2014, we notice a significant decrease in the level of services offered and the percentage of the population covered. In the year 2004, the population of Taiz city was 4,72,777 people. The number of beneficiaries of the water network services was approximately 335,100 people, with a coverage rate of 70.8%, and water requirements reached 3,615,957 m³/day. With the continuous increase in the population until 2014 and the expansion of the population area and its extension to the south on the slopes of Saber Mountain, the number of residents in Taiz city increased to reach 6,87,766 people successively.18 Compared to the population size, the percentage of population coverage decreased to reach 51.6 %. This is a percentage similar to the percentage of domestic water covered by the public network service in the Republic of Yemen, at a rate of only 56% of its coverage of the population of urban areas.19 The inability of the drinking water network service to cover all communities in populated areas in Taiz city is summarized in Table 1.
Table 1: The level of water service for residents of Taiz city for the year 2014
Indicator/Statement | Measuring Unit | Actual Situation |
Population | Population | 683,112 |
Number of subscribers (beneficiaries) | Population | 352,700 |
Population coverage ratio | % | 51.6 |
The net amount of water produced (available for distribution) | m3 | 5,466,935 |
The total amount of water sold (consumed) | m3 | 4,268,206 |
The amount of wasted water (*) compared to the net production | (Quantity) m3 (Ratio) % | 1,189,929 22 |
Average per capita consumption of sold water | L/day | 33.2 |
Number of water connections | Connection | 48,779 |
Source- Based on the Standard performance indicators for water distribution, reports issued by the local water and sanitation corporation in Taiz Governorate, 2013-2014.
(*) The coverage ratio for the population is calculated as:
(number of service beneficiaries ÷ population × 100).
(**) Waste quantity (net water produced for the previous month - sales for the current month)
The water consumption pattern in Taiz city differs according to the type of use. It is estimated that the water used for drinking and domestic purposes amounts to 7 million m³. The industrial sector, especially food production factories, accounts for 5 million m3 of its consumption, and the service sector accounts for the remainder. It has the largest share of use in its health, education, religious, tourism, commercial, and government buildings sectors 29 million m3.20
Water Network Reservoirs
The distribution of fourteen reservoirs across six zones in Taiz City reflects an engineering design that adapts to the city’s mountainous topography and complex terrain. The variation in storage capacities—most notably the 6,000 m³ concrete reservoir and the 2,500 m³ iron reservoir—demonstrates a strategic effort to balance water supply among areas of differing elevations and maintain stable hydraulic pressure throughout the network. The concentration of reservoirs in Western Al-Ashraf and Al-Manakh highlights their role as primary collection and balancing centers, which regulate and stabilize water pressure before it is distributed to surrounding neighborhoods. The variation in elevation across the city’s terrain dictates this differentiated distribution pattern. Reservoirs located in elevated areas, such as Tha’bat and Sinah, primarily serve as pressure-regulation and redistribution points, while those in low-lying zones, like the Lower Al-Muassala Valley, function as terminal storage units that ensure steady water flow to end users. This spatial arrangement helps reduce pumping energy losses and enhances the efficiency of gravity-based water distribution.
The inclusion of automatic chlorine gas injection points at multiple stages of extraction, transport, and distribution demonstrates an integrated water quality management system, which is essential in long, multi-elevation networks such as that of Taiz. This system minimizes the risk of microbial contamination and ensures compliance with urban water safety standards. Overall, the configuration of reservoirs and chlorination points reveals a topography-responsive hydraulic design, optimized to achieve a balance between storage, pressure regulation, and water quality, thereby ensuring operational stability and equitable distribution within the challenging physical landscape of Taiz City.
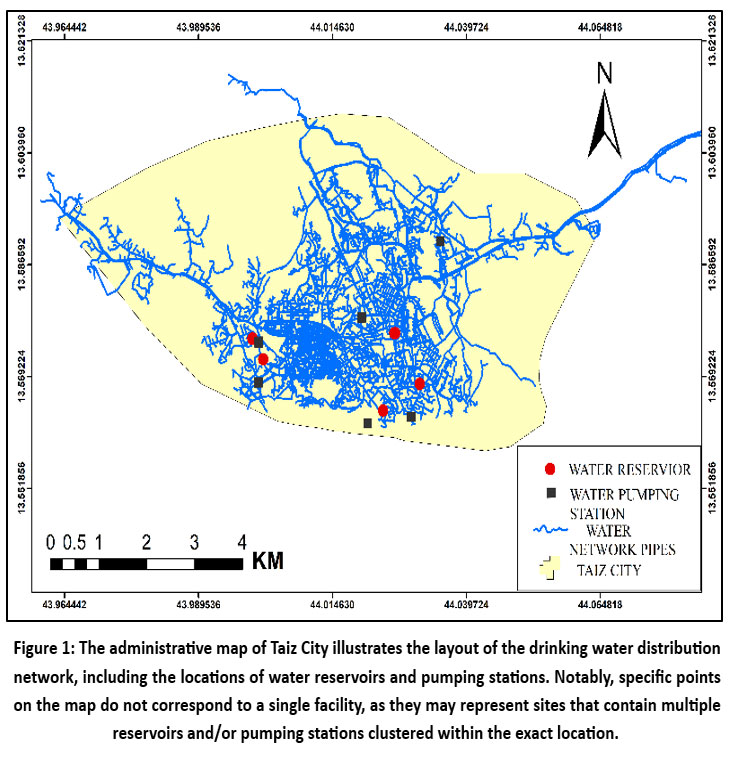 | Figure 1: The administrative map of Taiz City illustrates the layout of the drinking water distribution network, including the locations of water reservoirs and pumping stations.Notably, specific points on the map do not correspond to a single facility, as they may represent sites that contain multiple reservoirs and/or pumping stations clustered within the exact location.
|
Water Distribution Network
Taiz city relies on groundwater as a primary source to meet the various needs of its water distribution services network. Water is supplied to Taiz through a strategy consisting of three main stages. The first stage involves obtaining water from the central groundwater basins, which include six major water basins. Five of these basins are located outside the city: Al-Haymah, Al-Habir, Al-Hawjla, Al-Hawban, and Al-Dhabab, which contain a total of 44 wells. In addition, the city basin is located within the city's boundaries and contains 24 wells,21. The first stage is illustrated in Table 2 and Figure 2.
Table 2: Feeding water basins, number of wells, production, and estimated distance from Taiz city
Basin | Distance in km | Number of wells | Total Production (m3) |
Al-Hayma basin | 40 | 9 | 733,343 |
Habeer basin | 30 | 8 | 695,124 |
Al-Hawjla + Al-Hawban basin | 3 | 18 | 1,682,901 |
City basin | In the City | 24 | 1,194,357 |
AL-Dabab basin | 20 | 9 | 1,571,886 |
Total | - | 68 | 5,878,393 |
Table 2 highlights clear spatial variations in the location and performance of the city’s main water supply basins, illustrating the strong influence of topography on hydraulic efficiency. The distant basins located in elevated areas require greater pumping energy and maintenance due to steep gradients, which significantly increase operational costs. In contrast, the nearby basins and urban wells demonstrate higher energy efficiency and more stable water delivery, as they benefit from shorter transmission distances and lower head losses. Despite their relative distance, some basins remain highly productive due to favorable hydrogeological conditions and their aquifer recharge capacity.
Overall, the results confirm an inverse relationship between elevation and transport efficiency, emphasizing the importance of optimizing future storage and distribution projects near lowland and mid-elevation areas to ensure balanced water supply coverage across Taiz City.
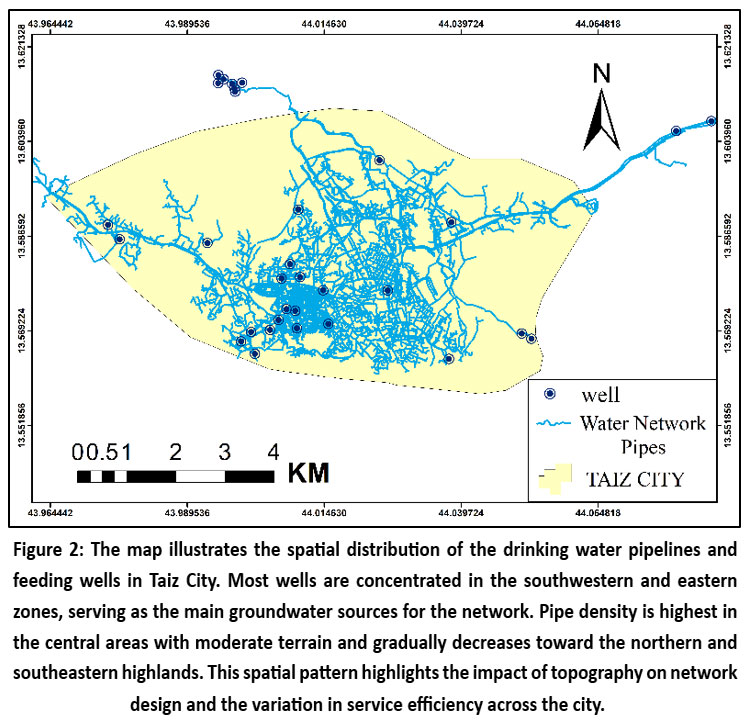 | Figure 2: The map illustrates the spatial distribution of the drinking water pipelines and feeding wells in Taiz City. Most wells are concentrated in the southwestern and eastern zones, serving as the main groundwater sources for the network. Pipe density is highest in the central areas with moderate terrain and gradually decreases toward the northern and southeastern highlands. This spatial pattern highlights the impact of topography on network design and the variation in service efficiency across the city.
|
While the second stage is pumping water through a massive network of pipes, starting from pumping water from water collection tanks with a pumping rate ranging between 100-200 m3 /hour, then the water is pumped through the transportation network to the main reservoirs within the city's reservoirs at a rate ranging between 150-300 m3/hour.22 The water is pumped from the main reservoirs to be distributed to the secondary reservoirs located throughout the city’s neighborhoods, so that it is ready to be pumped and distributed to homes, as shown in Figure 1. The amount of pumping differs according to the height or level of the residential areas compared to the level of the reservoirs. In the third stage, water is distributed throughout the city via a network of pipes that transport water from the main reservoirs to the secondary reservoirs located throughout the city. The current water distribution network in Taiz city takes the form of a network, consisting of a central belt that passes through the city's neighborhoods. From this central belt, subsidiary distribution pipes branch out to fill the gaps between the main pipes, covering 51.6% of Taiz city's neighborhoods. Based on its topographic map, this process faces several challenges, such as the varied elevation levels in Taiz city, ranging from 1150 to 1700 meters above sea level. The study area is located on the northern slope of Sabr Mountain, which rises to an elevation of 3,200 meters above sea level, according to the topographic map of Taiz city, as shown in Figure 3 (A-B), and live images of Taiz city are depicted in Figure 4. This positioning places the city along the path of five seasonal watercourses known as the Sinah, Al-Namir, Al-Madam, Al-Qamat, and Taiz valleys.
Furthermore, six secondary valleys emanate from it, running from south to north, enhancing the city’s landscape with plateaus, hills, and domes. Table 3 shows the most important of these plateaus and heights. All these factors have affected the performance of the water distribution network in Taiz city,23 including the distribution pattern, reservoir locations, pumping areas, distribution of pressure relief zones, network shape and extension, production cost, and distribution fairness.
Table 3: The most essential and prominent domes and hills in Taiz City
Protrusion | Height/M | Location details |
Al-Qahirah High | 1525 | South of Taiz city, along Saber Mountain between Sinah Valley and Al-Nimer, thus forming the highest peaks. |
Western Sinah Valley High | 1470 | Southwest of the City. Along Saber Mountain on the eastern side of Sinah Valley. |
AL-Gashafah High | 1432 | It is in the far northeast of the City, adjacent to the Al-Sharaf area and Salh Valley. |
East Sinah Valley High | 1400 | Southwest of the City. Along Saber Mountain on the western side of Sinah Valley. |
Sofitel High | 1360 | Along Al-Hawban Street. |
AL-Darbah High | 1360 | The west of the Al-Darbah area. |
AL- Daboah high | 1350 | North of Al-Hhirwy Street and east of Jamal Street, where Al-Madam Valley connects with Sinah Valley. |
Presidential Palace Height | 1340 | Northeast of the City, it is confined between Al-Hhirwy Street to the north and Republican Palace Street to the south. |
Jarrah Mountain Height (Judicial Complex) | 1320 | In Al-Qadi valley, between second ring street and third ring street. |
AL-Zonog Valley High | 1319 | To the west of the Al-Maftash area, along the Al-Hawban complex in the Osifra area. |
Al-Qadi Valley High | 1312 | On Hodeidah Road to the south, Al-Qadi Valley to the east, Al-Haseb to the west, from Al-Qadi Valley Street, and the street extending to Al-Nour City, connected to the Third Ring Road. |
Source- Based on 1- Google Earth, 2- A personal interview with Eng. Mohammad Abdo Doaqan, Deputy director of the public works office for construction and emergency affairs, Taiz, 3/4/2021.
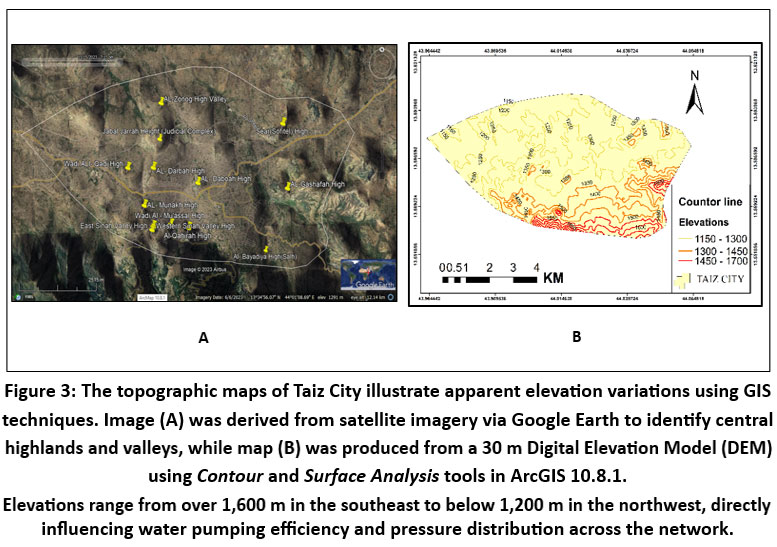 | Figure 3: The topographic maps of Taiz City illustrate apparent elevation variations using GIS techniques. Image (A) was derived from satellite imagery via Google Earth to identify central highlands and valleys, while map (B) was produced from a 30 m Digital Elevation Model (DEM) using Contour and Surface Analysis tools in ArcGIS 10.8.1. Elevations range from over 1,600 m in the southeast to below 1,200 m in the northwest, directly influencing water pumping efficiency and pressure distribution across the network.
|
Drinking Water Distribution Pattern
The drinking water distribution in Taiz City can be classified into two main patterns.
The first is the gravity-fed system, which includes reservoirs located in the elevated southern parts of the city, such as Thaabat, Al-Majalia, Sinah, and Al-Manakh. However, rapid urban expansion and population growth in recent years—particularly in Al-Qahirah, Sinah, Al-Dabu’a, and Al-Qadi Valley—have led to residential areas being developed above the reservoir levels, causing severe water supply deficits. This gravity-fed system helps protect the network pipes from damage or fractures caused by high pumping pressure.9
The second pattern involves direct pumping, in which water is supplied directly to consumers from 24 wells within Taiz City without prior storage. Major wells include Nakhla, Attia, Al-Husseiniyah, Al-Dhahra, Al-Jumhuri, Al-Jeisr, Al-Mu’assal, Salh, Hanan Valley, East and West Sinah, Jamal Street, Al-Ta’awun Garden, the Zoo, Al-Mu’assassa, around Al-Shajara, and Jannat Valley wells. This method exerts high stress on the network, particularly when consumption rates are low, resulting in reverse flow and excessive pressure that cause frequent pipe fractures and substantial water loss—estimated at 1,189,929 m³, representing about 22% of total
production.9 Moreover, according to international performance benchmarks, the average Non-Revenue Water (NRW) worldwide is approximately 35% of total water production, with higher rates observed in many developing countries compared to those with advanced infrastructure.24 Within this context, the NRW rate in Taiz City’s water network, estimated at 22%, is below the global average yet remains relatively high when measured against the optimal benchmarks targeted by many water utilities, which aim to reduce losses to below 20% in well-managed urban systems.24
From a spatial-hydraulic perspective, these dual distribution patterns demonstrate the direct impact of topography and elevation on network performance. Gravity-fed zones exhibit more stable flow and fewer pipe failures due to their reduced reliance on pumping, whereas direct-pumping zones experience pressure fluctuations and backflow during low-demand periods, resulting in increased energy consumption, higher leakage rates, and mechanical stress on aging pipelines. These findings are consistent with EPANET simulation results, which revealed critical pressure drops and concentrated water losses in low-lying districts such as Al-Mudhaffar and Salh. Accordingly, the study recommends optimizing pressure zoning and constructing additional elevated storage tanks in high-demand areas to achieve a more balanced and sustainable water distribution system.
Pumping Areas in the Water Network
The topography of the study area plays a crucial role in the proliferation of numerous pumping stations, which impose significant financial burdens on the local government in Taiz City for equipment procurement, operation, and maintenance. The elevated zones of the city are supplied with water through several central pumping stations Figure 1. Establishing these stations requires precise engineering procedures involving groundwater depth assessment, slope analysis, and optimal site selection to meet the hydraulic design standard.21 The permissible pumping rate ranges between 100 and 300 m³/hour, depending on the height differences between residential areas and storage reservoirs. Table 4 summarizes the key pumping stations, reservoirs, and areas covered by the network. From a spatial-hydraulic perspective, the widespread distribution of pumping stations reflects the direct influence of complex topography on water distribution efficiency. High-altitude zones require greater pumping energy to overcome elevation differences, resulting in increased operational costs and mechanical stress on the pipelines. EPANET simulation results indicate that several stations operate near critical pressure thresholds, particularly during peak demand periods, resulting in fluctuations in flow velocity and increased pressure losses in downstream sectors. Based on these hydraulic analyses, the model also revealed low-pressure zones in the southern (Thubbat and Al-Majaliya) and eastern sectors, suggesting the need for additional booster stations to stabilize service delivery and maintain uniform network pressure.
Accordingly, the study recommends constructing two elevated storage reservoirs (80,000 m³ each) in the eastern and southern zones, installing booster pumps in Thubbat and Al-Majaliya, and replacing undersized pipes (<150 mm) with 250 mm mains. These interventions are expected to enhance hydraulic efficiency, minimize energy consumption, and reduce non-revenue water losses by maintaining optimal pressure gradients across the network.
Table 4: Pumping stations, water reservoirs, and areas covered by the water network
Pumping Station | Pumping areas of water reservoirs | Areas Covered by Pumping (Neighborhoods) |
Thaabat Station (Al- Askari) | Al-Askari Area reservoirs | Upper Jahmaliya, part of Thaabat, Al-Harazia, part of Salh, Al-Sharaf, Haret Al-Hazr, Hasanat, and Al-Manasama, which range between (1500-1600) meters above sea level |
Sina Station | Main reservoirs are located inside the Public Water Corporation | All the neighbourhoods of the Circular line, Al-Mahaba Valley, Al-Haqr area at an altitude of (1420) meters, the political security tanks in the upper regions in Sina |
Al-Munakh Station | Salh reservoirs and University Collective reservoirs | Al-Dahi Valley area, Al-Moasal Valley, Upper Sina area, and some areas adjacent to the city wells. |
Al-Magalia Station | Thaabat reservoirs | Al-Maghrabh, Al-Jumhuri Al-A'ala, Sha'ab Mansour, Al-Dumgha |
Kalaba Station | Main reservoirs are located inside the Public Water Corporation | Wholesale Market, Al-Fateh, Al-Junaid, and Zaid Al-Mushki |
General Water Corporation Station | Water is pumped directly without storage to homes. | Habeel Al-Dhabi, Hawd Al-Ashraf, Al-Kamb, Al-Jahmaliyah, Al-Malaeb, Akma Al-Akaber, Al-Kawthar, Al-Dabaoa Al-Ulia |
Separate Pumping Stations | City wells | What remains of the City's neighborhoods that are supplied with water by flowing because it is lower than the level of the reservoirs ' heights |
Source - based on: 1- the standard performance indicators issued by the Local Corporation for Water and Sanitation, Taiz Governorate. 2-field work
* The data in Table 4 show that the spatial distribution of pumping stations and reservoirs in Taiz City is primarily controlled by topographic variation, where steep elevation differences between the southern and eastern zones cause pressure instability and uneven water supply.
Days of Water Pumping Within the Water Network Service
Water is pumped to consumers almost daily from the city center, which is located near the main reservoirs. For moderately elevated zones, water is supplied every 30 days for three consecutive days. In contrast, northern neighborhoods adjacent to Saber Mountain receive water once every 40–60 days. This pattern is consistent across all elevation levels within neighborhoods, including the upper floors of tall buildings, reflecting an apparent topographic influence on the city’s water distribution efficiency.
From a hydraulic perspective, these intermittent pumping cycles demonstrate the network’s limited capacity to sustain adequate pressure across varying elevations. EPANET simulation results indicate that nodes in higher-altitude zones suffer from substantial head loss and pressure instability, particularly during peak consumption periods. This confirms the direct correlation between elevation, hydraulic head, and service frequency. The analysis underscores the pressing need for a pressure-balancing strategy, such as installing additional booster pumps and elevated storage tanks, to improve network performance and ensure equitable water distribution. The number of pipelines, subscribers, beneficiaries, and underserved neighborhoods where water network service is available in the study area is summarized in Table 5.
Table 5: Number of neighborhoods, subscribers, beneficiaries, and neighborhoods deprived of water network water according to the directorates of Taiz city
Districts | Area km2 | Total Neighbor hoods | Beneficiaries Neighbor- hoods | Subscribers/ Counters | Beneficiaries/ People | Neighbour of water | % |
AL-Qahirah | 11.1 | 50 | 20 | 16.442 | 111.811 | Al-Mujalihi, Al-Qahirah, Upper Al-Dabueuah, Al-Aaqabh, Upper Al-Jumhuri, Al-Suwani, Al-Ashrafih, Jarah Mountain, Upper Al-Mesbah, Al-Rawda | 34 |
Al-Mudhaffar | 8.7 | 69 | 22 | 16.377 | 110.145 | Al-Mehsab, A large part of Al-Dahi Valley, Al-Shama'a Valley, Upper Amad Valley, a large part of Al-Jarajer, Hattab Valley | 33.4 |
Salh | 18.2 | 63 | 16 | 15.613 | 107.597 | Upper Tha'abat, Sala, Upper Jahmaliya, Al-Haraziyah, Hasanat Height, Al-Madrasa, Al-Harar, Al-Salal, Al-Qahfah, Al-Sharafh, Al-Humiara, Al-Arjam, Al-Quabh neighbourhood | 32.6 |
Total | 38 | 182 | 58 | 48.412 | 329.553 | - | 100 |
Source - based on reports issued by the Department of Planning, Statistics, and Follow-up Local Corporation for Water and Sanitation, Taiz Office
* Table (5) illustrates the spatial variation in water service coverage across Taiz city’s three districts. The data reveal that approximately one-third of the neighborhoods in each district remain deprived of a regular water supply, with deprivation rates ranging between 32.6% and 34%. The highest deficit is observed in Al-Qahirah District, which encompasses several high-altitude neighborhoods, including Al-Mujalliya, Al-Qahirah, and the Jarah Mountain area. These areas experience severe pressure drops due to elevation differences and limited pumping capacity. The results highlight a clear spatial imbalance in water distribution, confirming the influence of topography and population density on service inequality across the city.
Pressure Relief Zones (Valves) Within the Water Network
Pressure management, based on optimized control strategies using pressure-reducing valves (PRVs), is regarded as one of the most effective methods for controlling network leakage and enhancing the operational efficiency of water distribution systems. These strategies can generally be classified into different types depending on the adopted control mechanisms, which aim to maintain the desired pressure levels, reduce water losses, and improve the hydraulic stability of the system.25 This technology helps prevent pipeline bursts caused by internal air pressure, ensuring that the pressure remains regulated at a maximum limit of 16 bars, which corresponds to a hydraulic head of approximately 160 meters.
Along the main transmission lines extending from the Al-Haymah and Al-Habir reservoirs, several strategically located pressure-relief chambers have been constructed to mitigate sudden pressure surges resulting from the downward movement of water toward Taiz City, due to the considerable elevation differences between the source areas and the urban center. These chambers are distributed along both the main and subsidiary pipelines that supply water to the elevated zones. In practical application, such valves are typically installed near pumping stations to reduce backflow pressure toward the reservoirs. Figure 4 illustrates the spatial distribution of these chambers throughout the water network. The hydraulic analysis further indicates that network segments equipped with pressure-relief valves experience a notable reduction in pressure fluctuations and head losses, particularly along the main transmission lines connecting Al-Haymah, Al-Habir, and the central Taiz area. Maintaining pressure levels below 16 bars helps reduce the likelihood of pipe failure, enhances operational efficiency, and ensures balanced and continuous water flow across the diverse topography of Taiz City.
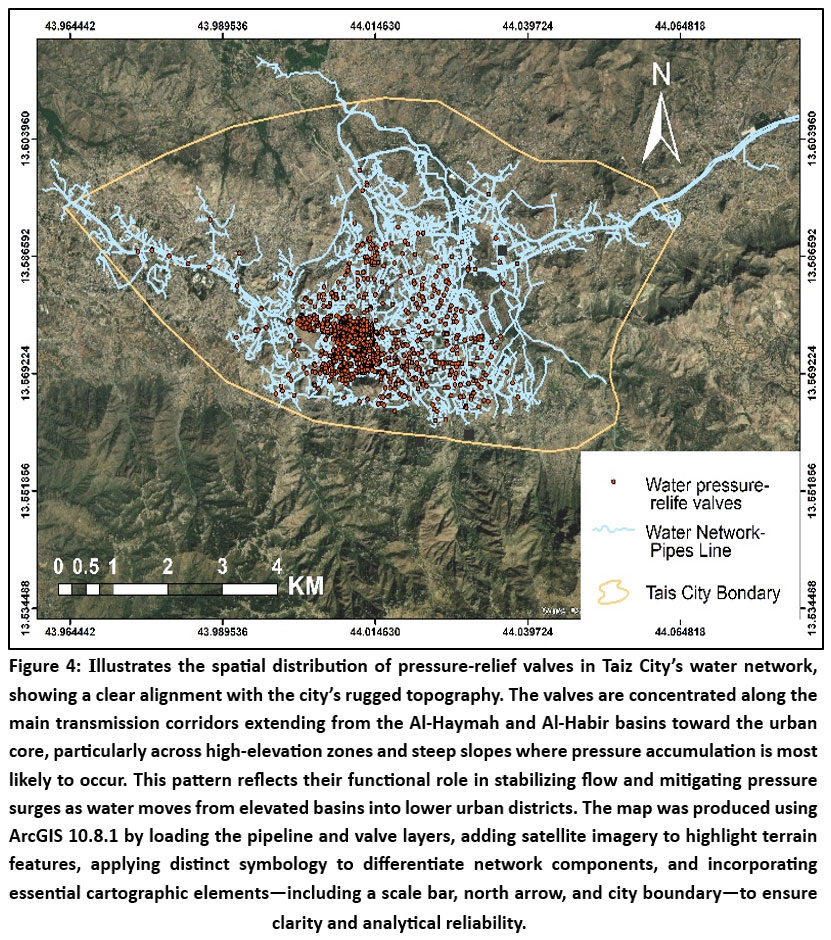 | Figure 4: Illustrates the spatial distribution of pressure-relief valves in Taiz City’s water network, showing a clear alignment with the city’s rugged topography. The valves are concentrated along the main transmission corridors extending from the Al-Haymah and Al-Habir basins toward the urban core, particularly across high-elevation zones and steep slopes where pressure accumulation is most likely to occur. This pattern reflects their functional role in stabilizing flow and mitigating pressure surges as water moves from elevated basins into lower urban districts.
|
Lengths, Shape of the Water Network
In the study area, the water distribution network tends to level out in some sections. In contrast, in others, it follows the natural terrain slopes, resulting in a meandering pattern that increases the overall network length compared to the total area of Taiz City. According to distance measurements conducted using ArcMap 10.81, the total length of the drinking water distribution network, including both main and subsidiary pipelines, is approximately 843.968 km. Of this, 332.233 km represents the main network with pipe diameters ranging from 300 to 700 mm, while the remaining 511.735 km comprises the subsidiary network that connects the main pipelines to individual households.22 As shown in Figure 5, the water network of Taiz City exhibits a highly intricate and interconnected configuration, reflecting the city’s rugged mountainous terrain and its west–southwest urban expansion. Network density is highest in the central and western sectors, where urban concentration and population intensity are greatest. At the same time, it progressively declines toward the eastern and northeastern margins, where elevations rise sharply and steep slopes restrict network extension. The main transmission lines follow a radial pattern originating from the Al-Haymah and Al-Habir basins in the north and northeast, extending toward the urban core before branching into finer distribution lines that serve residential districts in the south and southwest. This terrain-driven alignment demonstrates how natural valley slopes and drainage pathways influence the direction and continuity of pipelines, resulting in a long and highly interconnected configuration that enhances operational flexibility but requires precise pressure regulation to maintain stability and minimize losses. The spatial distribution of pipe diameters further demonstrates hydraulic adaptation to topographic variation: large-diameter pipelines are concentrated along high-relief northern and northeastern corridors to convey adequate flows across steep gradients, medium-diameter pipes occupy transitional elevation zones between main trunks and intermediate neighborhoods, and small-diameter pipes dominate lower western and southwestern districts where pressure conditions are more stable and suitable for localized distribution. Together, these patterns reveal a coherent integration of elevation gradients, slope dynamics, and urban development directions in shaping pipeline sizing and hydraulic performance across the diverse terrain of Taiz City.
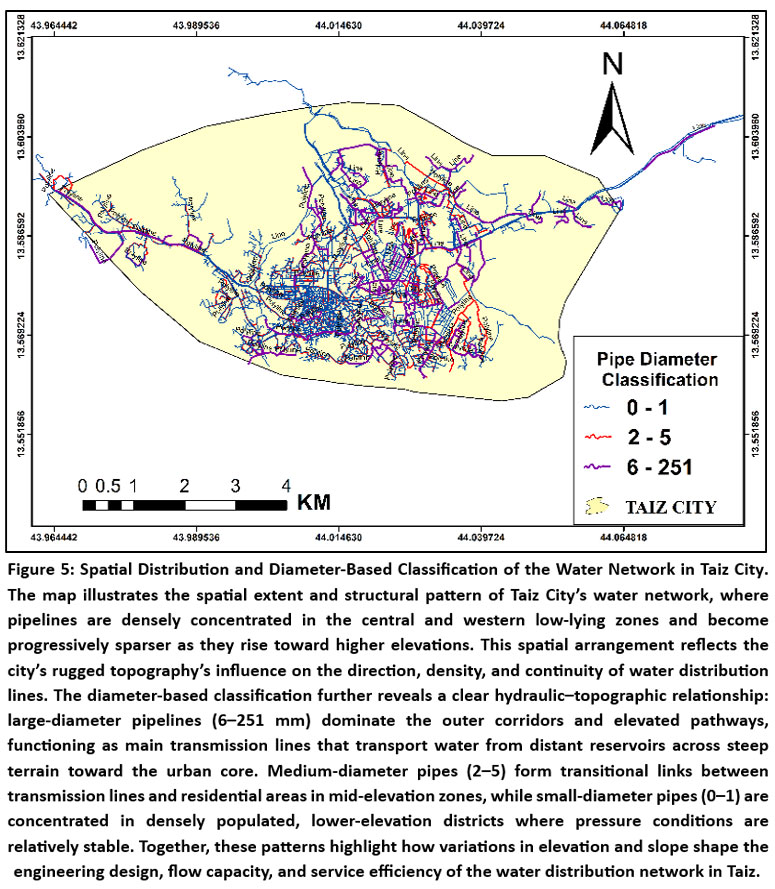 | Figure 5: Spatial Distribution and Diameter-Based Classification of the Water Network in Taiz City. The map illustrates the spatial extent and structural pattern of Taiz City’s water network, where pipelines are densely concentrated in the central and western low-lying zones and become progressively sparser as they rise toward higher elevations. This spatial arrangement reflects the city’s rugged topography’s influence on the direction, density, and continuity of water distribution lines.
|
The Cost of Production and Distribution
The mountainous terrain and complex topography of Taiz City significantly contribute to the increased cost of drinking water production and distribution. The city’s main water sources, located in the Al-Haymah and Al-Habir basins about 40 km away, lie at significantly higher elevations than the urban center. This elevation difference necessitates multi-stage pumping operations to overcome vertical gradients, which greatly increases fuel and electricity consumption—the dominant components of total production costs. In 2004, the total pumping cost per cubic meter of water, including all stages of production and distribution, was estimated at 218 Yemeni Riyals (YER). By 2014, this cost had risen to 247 YER due to the continuous increase in fuel and electricity prices, as well as maintenance and sterilization expenses. According to the General Water Corporation in Taiz, the pumping process consumes approximately 109,336 liters of fuel per month, and the combined monthly expenditure on labor, spare parts, and chemicals used for disinfection reaches nearly 14.439 million YER.23 These figures reflect the energy-intensive nature of the water supply system, where operational sustainability depends heavily on fuel availability and cost. Topography also drives a spatial variation in production costs. The Al-Haymah and Al-Habir wells incur the highest costs due to their distance and high elevation, followed by the Al-Dhubab wells (20 km west of the city).
In contrast, production costs decline significantly in the Al-Hawban and Al-Hawgala basins, located only 3 km from the city, where pumping is less energy-demanding. This demonstrates a direct correlation between distance, elevation, and pumping energy, confirming that topography is a significant determinant of both hydraulic efficiency and economic viability within the system. The energy and elevation burden created by Taiz’s terrain is clearly reflected in the water tariff structure (Table 6). Although domestic tariffs start at low rates (1–5 m³) to ensure social equity and protect low-income households, prices increase progressively with higher consumption volumes. Meanwhile, commercial (restaurants and cafés) and industrial users pay considerably higher rates to recover a portion of the high production and distribution costs. This progressive pricing system thus functions as a dual mechanism—helping offset the additional costs imposed by the city’s rugged topography while promoting water conservation through the use of household meters, which have reduced consumption by about 20%, consistent with international findings reporting up to 50% reductions after metering. 26
Table 6: The cost of using a drinking water unit for different sectors
Type of use | Consumed Unit (m3) | Price /YER | |
Home use | 1-5 | 100 | |
6-10 | 106 | ||
11-20 | 209 | ||
20-30 | 374 | ||
Above 30 | 569 | ||
Servicing | Restaurants | 1 | 300 |
cafés | 1 | 200 | |
Industrial | 1 | < 400 | |
Source - based on the water payment bills issued by the local corporation for water and sanitation, Taiz Governorate.
* Water unit = 1 m3 or 1000 L of water.
The mountainous environment of Taiz not only intensifies pumping and maintenance costs but also shapes the economic, spatial, and tariff structures of the water supply system. This interdependence between topography and cost underscores the importance of adopting energy-efficient technologies, strategic valve control, and demand-responsive pricing policies to ensure sustainable water delivery under challenging physical and economic conditions.
Conclusion
The study demonstrates that the mountainous topography of Taiz City exerts a significant impact on both the hydraulic efficiency and spatial equity of its drinking water distribution system. The EPANET simulations, integrated with GIS-based elevation data, revealed strong spatial variations in pressure and flow: high-altitude zones such as Tha’abat, Al-Majaliya, and Al-Qahirah suffer from head losses of 30–40 m, while low-lying areas such as Al-Mudhaffar and Salh experience pressure surges up to 16 bars, causing frequent pipe failures and high energy demand. Approximately 22% of total water production is lost through leakages concentrated along the steep transmission lines from Al-Haymah and Al-Habir reservoirs toward the city center. The city’s 843.9 km-long network and rugged terrain increase friction losses and pumping requirements, raising production costs from 218 YER/m³ in 2004 to 247 YER/m³ in 2014, supported by an energy consumption rate of about 109,336 L of fuel per month. To enhance network resilience and service equity, the study recommends constructing two elevated reservoirs (=80,000 m³ each) on strategic hills, installing booster pumps in Tha’abat and Al-Majaliya, and replacing undersized pipelines (<150 mm) with 250 mm mains. Pressure management and integration of GIS–EPANET modeling in future planning are vital to reduce water losses and adapt the network to the city’s topography. These findings confirm that coupling hydraulic modeling with spatial analysis provides a robust framework for developing sustainable, energy-efficient, and topography-responsive water systems in mountainous urban environments.
Acknowledgement
Gratitude is extended to the local water and sanitation corporation as well as the Office of Planning, Statistics, and Follow-up Administration in Taiz City (Yemen) for their invaluable support throughout this study, providing essential reports on the standard performance indicators of the water network for the year 2014. Acknowledgment is also owed to the University of Taiz, Yemen, and the School of Earth Sciences at Swami Ramanand Teerth Marathwada University, Nanded, Maharashtra, India, for their unwavering assistance in facilitating the development and continuation of this research endeavor.
Funding Sources
The authors received no financial support for the research, authorship, and/or publication of this article.
Conflict of Interest
The authors declare no conflict of interest.
Data Availability Statement
This statement does not apply to this article.
Ethics Statement
This research did not involve human participants, animal subjects, or any material that requires ethical approval.
Informed Consent Statement
This study did not involve human participants, and therefore, informed consent was not required.
Permission to Reproduce Material from Other Sources
Not Applicable
Author Contributions
Ahlam Mohammed Anaam: Data curation, Conceptualization, Formal analysis, Validation, Software, Investigation, Methodology, Resources, Writing – original draft, Writing – review & editing.
Parag Arun Khadke: Supervision, review & editing.
Pramod Baburao Waghmare: review & editing.
References
- Hassan Amin. Services in the City of Aden. Benha University, Egypt.; 2003. https://yemen-nic.info
- Agency USEP. Epanet 2 users manual. 2000;(September).
- Kaspate RN. “ Urban Water Consumption: A Micro Level Study of Pimpri Chinchwad .” Peer Rev Int Res J Geogr. 2020;37(2):5-10.
- Gleick PH. Basic water requirements for human activities: Meeting basic needs. Water Int. 1996;21(2):83-92. doi:10.1080/02508069608686494
CrossRef - Shaban A, Sharma RN. Water consumption patterns in domestic households in major cities. Econ Polit Wkly. 2007;42(23):2190-2197. doi:10.2307/4419690
- Kumpel E, Nelson KL. Intermittent Water Supply: Prevalence, Practice, and Microbial Water Quality. Published online 2016. doi:10.1021/acs.est.5b03973
CrossRef - Taghlabi F, Sour L, Agoumi A. Prelocalization and leak detection in drinking water distribution networks using modeling-based algorithms: a case study for the city of Casablanca ( Morocco ). Published online 2020:29-41.
CrossRef - Elangovan K. Water Distribution Network Analysis for Vellore Town Panchayat Using GIS and EPANET. Published online 2021. doi:10.4108/eai.7-12-2021.2315104
CrossRef - The local institution for water and sanitation TG. Standard Performance Indicators for the Water Network.; 2014.
- The local corporation for water and sanitation R of Y. Standard Performance Indicators for Water Distribution.; 2014.
- de Chazournes LB, Tignino M, Savadogo H. The right to water. Roles Int Law Dev. Published online 2023:196-218. doi:10.1093/oso/9780192872906.003.0009
CrossRef - UNICEF & WHO. Progress on household drinking water, sanitation and hygiene 2000–2017: Special focus on inequalities. In New York and Geneva: UNICEF. New York Geneva UNICEF WHO. Published online 2019:140. https://data.unicef.org/resources/progress-drinking-water-sanitation-hygiene-2019/%0Ahttps://www.eea.europa.eu/publications/industrial-waste-water-treatment-pressures%0Ahttp://files/558/Rapport EEA Industrial waste water treatment – pressures on Europe’s
- Baigorri AG, Parada R, Baeza VM. Leveraging Urban Water Distribution Systems with Smart Sensors for Sustainable Cities. Published online 2024:1-22.
- Saleh MM, Palermo SA, Pirouz B, Naghib SN, Javadi H. HYDRODYNAMIC MODEL OF AN URBAN DRAINAGE NETWORK. Published online 2024:15-18.
- Sitzenfrei R, Möderl M, Rauch W. Environmental Modelling & Software Automatic generation of water distribution systems based on GIS data. Environ Model Softw. 2013;47:138-147. doi:10.1016/j.envsoft.2013.05.006
CrossRef - Kulkarni MMM. REVIEW PAPER ON STUDY & DESIGN OF WATER DISTRIBUTION NETWORK SYSTEM. 2023;(12):4091-4094.
- Dongare P, Sharma KV. Water distribution system modelling of GIS-remote sensing and EPANET for the integrated ef fi cient design. 2024;26(3):567-588. doi:10.2166/hydro.2023.281
CrossRef - Al-Hamdi EM. Water Security An attempt to analyze the reality and future of water in Yemen. In: An Exhortation Paper for the Political Development Forum within the Vision of “Yemen Future Scenarios.” 2008:15.
- Ministry of public works and roads R of Y. Municipal Development and Flood Protection Project for the City of Taiz, Review and Update of the General Plan for the Taiz City.; 2016. doi:Volume Two, Chapter Seven
- Al-Dulaimi HK. Planning Community Services and Infrastructure. First edit. Al Safaa for Publishing and Distribution; 2009.
- Todd, D.K., Mays W. Groundwater Hydrology. Third Edit. (Printing H, ed.). Argosy Publishing; 2005. http://water.usgs.gov/pubs/circ/circ1186/html/ gw_effect.html
- The local corporation for water and sanitation R of Y. Monthly Reports Issued by the Production and Distribution Department at the General Corporation for Water and Sanitation.; 2014.
- The local corporation for water and sanitation R of Y. Well Productivity in Taiz Governorate.; 2014.
- Pathirane A, Kazama S, Takizawa S. Dynamic analysis of non-revenue water in district metered areas under varying water consumption conditions owing to COVID-19. Heliyon. 2024;10(1):e23516. doi:10.1016/j.heliyon.2023.e23516
CrossRef - Tian Y, Gao J, Chen J, et al. Optimization of Pressure Management in Water Distribution Systems Based on Pressure-Reducing Valve Control: Evaluation and Case Study. Sustain. 2023;15(14). doi:10.3390/su151411086
CrossRef - Terrebonne RP. Residential water demand management programs: a selected review of literature. Environ Policy Gr Andrew Young Sch Policy Stud. 2005;(January):6,7. doi:10.1201/9781439833834.ch8
CrossRef


