Trace Metal Contamination and Associated Health Effects in the Shivnath River Tributaries
Sukhpreet Kaur Bhatia
 and Sumita Nair
*
and Sumita Nair
*
1
Bhilai Institute of Technology,
Durg,
Chhattisgarh
India
http://dx.doi.org/10.12944/CWE.18.2.17
Copy the following to cite this article:
Bhatia S. K, Nair S. Trace Metal Contamination and Associated Health Effects in the Shivnath River Tributaries. Curr World Environ 2023;18(2). DOI:http://dx.doi.org/10.12944/CWE.18.2.17
Copy the following to cite this URL:
Bhatia S. K, Nair S. Trace Metal Contamination and Associated Health Effects in the Shivnath River Tributaries. Curr World Environ 2023;18(2).
Download article (pdf)
Citation Manager
Publish History

Introduction
In 2005 Chhattisgarh became a separate and independent state of India. Presently the state is one of the fastest growing states of India with a gross domestic product (GDP) of 15.8 (Census 2011). Of the total water available on earth, 97% water is saline and not fit for human use and 1% water is fresh water which biotic community uses for their growth and development. In last few decades, worldwide the demand and consumption of fresh water has increased many folds. Pollution of water bodies and population growth has lead to shortage of fresh water in many parts of the world. Many developmental activities like industrialization, population growth, mining and vehicular growth rate leads to different types of pollution like air, water, and soil pollution. According to World Health Organization (WHO) 2015, every year worldwide unsafe water kills more people than disaster and conflict, approximately 10 - 500 million deaths occur due to unsafe water.
Trace metals are essential for the life of living beings but in very small quantity, because high quantity leads to toxicity. The two main sources from which trace metals arises are natural sources and anthropogenic sources1.The trace metals concentration in river water and other resources are gradually enriching due to many factors. Also, the toxic nature and non-biodegradability of these metals in environment are causing serious impact on health of human2-4. Many Indian rivers (137) are polluted due to iron (Fe) while 69 Indian rivers are contaminated with lead (Pb) and 25 with nickel (Ni) and cadmium (Cd) each5.
Many human and industrial activities releases trace metals by weathering and leaching processes. The solubility of these trace metals to water is dependent on pH, metal concentration and its solubility in water6. Dilution effect makes the trace metals monitoring in river water crucial. Also different human activity discharges, which includes dissolved inorganic and organic constituents are being added in River Shivnath hence a gradual deterioration of its water quality is suspected in a long run. For studies on pollution and other related pollutants, the assessment of trace metal contamination on human health, human exposure (EXPing), hazardous quotient (HQing), human exposure surface water (HEsw), carcinogenic risk (CRing) practical indices are helpful. CRing assess the carcinogenic risk factor associated with the presence of studied trace metals in river water. These indices give a composite influence of several studied trace metals on the overall quality of the studied River water on human health7-11. The objectives are to investigate trace metals in river water of different tributaries of River Shivnath and assess the health risk involve in consuming such river water laden with studied trace metals above the set limit through the use of pollution indices. All these will be conducted with the aim of evaluating the toxicity and contamination levels of the trace metals in the river water within the study area. Hence to assess (1) the domestic and agriculture suitability of studied river water quality and (2) human exposure risk assessment potential, monitoring and simulation of different water quality parameters are required. The present study attempts to investigate the pollution load index and the surface water quality of River Shivnath in the studied years and also its potential effects on human health.
Study Area
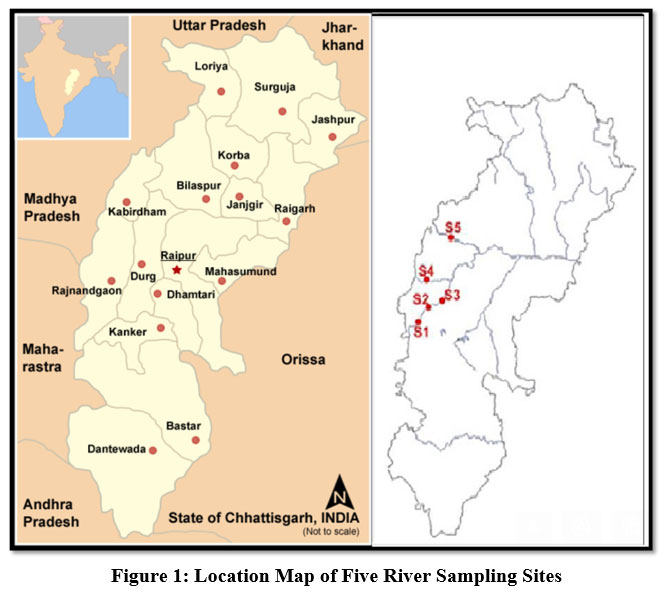
The Shivnath River situated in Durg District originates from the Manpur District of Chhattisgarh from a place called Panabaras. The flow of this river touches many of the places in Chhattisgarh state. The main locations from where the river flows are Durg, Champa, Rajnandgaon and Janjgir5. The River Shivnath flows with its many tributaries during its journey.
.jpg) | Figure 1: Location Map of Five River Sampling Sites.
|
For the study, pollution oriented statistical systematic sampling was conducted. Five different river stream sampling sites were selected to cover the catchment of Shivnath River from Durg to Bhilai region (Figure1). To assess the trace metals of these rivers, the five different tributaries of Shivnath River were selected in the year 2017 and 2018 in all the three seasons, i. e., Monsoon (July - October), Post Monsoon (November - February), and Pre-Monsoon (March - June) seasons in the studied year. For sampling stratified sampling plan is adopted. From all the selected Shivnath tributaries total 120 samples were collected from 10 cm. down the surface water. Sampling was carried out in pre cleaned plastic bottles. Duplicate sampling was done for each location. For the analysis of trace metals, collected samples were acidified with nitric acid pH< 2. Strict quality assurance and quality control programme was followed during the sampling and analysis of the collected samples. To ensure the elimination of any error during sample collection the collection of equipment blanks, field blanks, and field replicates were followed.
Analysis of Samples
For the analysis of samples double distilled water and AR grade chemicals were used. Different parameters of water samples were analysed following APHA methods suggested for water analysis. Analysis of dissolved trace metals were performed with a UV-Visible Spectrophotometer Systronics 117.
Heavy Metal Pollution Index (HPI)
To assess the extent of contamination exerted by the trace metals present in rivers the HPI is calculated. In step one grading scale is initiated for different variables by providing emphasis to them. In the second step pollution variable which is dependent on index is to be determined. For evaluating the HPI grading the unit weightage is calculated by dividing the standard suggested value by one for each corresponding parameters4,12-14. In their calculation of the HPI4, unit weightage (Wi) took into account, which was defined as a number that was inversely related to the suggested standard (Si) of the similar parameter as put forward by Reddy15. The Standards mentioned in (IS 2012) for water fit for drinking in India are used in the calculation of Wi for metals in found values for metals in samples. The metals utilized in the Wi estimate were based on the drinking water guidelines for India. It is used to compute by using the below formula the HPI model12.

Qi is the abbreviation for the ith parameter's sub-index.
Wi is the unit weighting of the ith parameter,
and n denotes the total number of parameters taken into account.
Human Exposure (Exping), Hazard Quotient (HQ), Human Exposure Surface Water (HEsw) And Carcinogenic Risk (CRing)
For adults, the hazards of exposure to heavy metals (EXPing) were calculated by using below formula 16,17.

Exping means Exposure of dosage by water consumption (milligram/kilogram per day).
Cwater is an acronym for likely metals in water medium absorption (milligram/liter).EF stands for exposure frequency (365 days/year).ED, or exposure duration for people aged 70 years and older BW, or middle body weights, refers to adults weighing 60.7kg. AT stands for medium time (365 days per year × 70 years for an adult16,18,19.
Hazard Quotient (HQ)
Probable non-carcinogenic hazard because of fixation revelation of heavy metals was calculated by help of Computed contamination risk with reference Dosage (RfD)17. Determination of an individual's non-carcinogenic potential exposures via ingestion routes. With the help of following equation the value for hazard quotient (HQ) was determined.

RfD is the highest tolerable dosage of toxic metals taken orally. It can be measured in milligram/kilogram consumed per day 16,17,18. If HQ = 1 belongs to non dangerous category and if HQ is < 1 belongs to dangerous category for human health
Human Exposure Surface Water (HEsw)
The risk and danger to human health by consuming the water from the surface of River Shivnath having different metals in it was derived by ascertaining the everyday exposure intake with the help of equation as provided by environmental protection agency of USA17,20.

HESW Stands for daily human contact intake with River Surface water milligram/kilogram consumed per day. C stands for concentration of the trace metals in water sample of the contaminated environment of (milligram/liter). IR stands for rate of ingestion. BW stands for weight of the body kilograms
Carcinogenic Risk (CR)
With the help of below mentioned equation the value of ingestion pathway of carcinogenic risk is measured.

CRing stands for carcinogenic risk through ingestion route, SFing stands for carcinogenic slope factor 18,21.
Results and Discussion
The results obtained in all the three seasons (Pre monsoon, Monsoon and Post Monsoon) of studied year 2017 and 2018 with mean value, range and standard deviation are illustrated in Tables1 and 2.
Table 1: Statistical analysis of studied trace metals in three seasons of 2017 (values are in microgram /L)
S.No.
| Metals
| Pre Mon | Monsoon | Post Monsoon | |||
Range | Mean ±SD | Range | Mean ±SD | Range | Mean ±SD | ||
1 | Al | 100-350 | 262±118.62 | 110-250 | 180±58.31 | 80-250 | 180±82.77 |
2 | Fe | 0-80 | 30±31.62 | 0-200 | 102.4±97.56 | 0-340 | 140±132.66 |
3 | Mn | 110-410 | 306.6±112.71 | 160-400 | 236±100.39 | 170-400 | 278±104.74 |
4 | Cr | 0-80 | 32±39.62 | 0-79 | 43.2±39.75 | 0-68 | 26.6±36.44 |
5 | Cu | 10-86 | 49.2±37.06 | 00-10 | 2±4.47 | 0-40 | 8±17.89 |
Statistical analysis of the metals in all the three seasons of 2017 is presented in Table 1. The obtained results reveals that the mean values of Al, Mn, and Cu show the high concentration in Pre Monsoon season and then dilution effect is dominated in Monsoon season while Fe and Cr show higher concentration in Monsoon season. Same trend is also observed in the study of trace metals in all the three seasons of year 2018 (Table 2).
Table 2: Statistical analysis of some trace metals in three seasons 2018
S. No.
| Metals
| Pre Mon
| Monsoon
| Post Monsoon
| |||
Range | Mean ±SD | Range | Mean ±SD | Range | Mean ±SD | ||
1 | Al | 30-320 | 180±130.96 | 0-160 | 70±76.16 | 60-220 | 152±84.38 |
2 | Fe | 20-320 | 160±134.35 | 0-420 | 162±167.39 | 40-160 | 90±64.03 |
3 | Mn | 180-256 | 322.4±67.31 | 130-320 | 254±85.322 | 40-410 | 253.6±125.36 |
4 | Cr | 20-60 | 40±18.71 | 0-85 | 45±42.130 | 0-76 | 27.2±37.67 |
5 | Cu | 0-96 | 54.4±45.59 | 0-120 | 24±53.66 | BDL | BDL |
It is clear from the Tables 1 and 2 that studied trace metals are below the prescribed value by BIS for most of the studied trace metals but in some sampling stations the value of Fe, Al, and Mn is above the standard limit in Post Monsoon and Monsoon season (Table 1 and 2).
Table3: Status of studied metal's concentration in different Indian rivers and in Shivnath River (microgram/ L).
Metals River | Al | Fe | Mn | Cu | Cr | References |
Subernarekha River | - | 66.25 | 11.38 | 15.88 | 1.13 | 22 |
Hindon River | - | 226.0 | 129.0 | 6.60 | 15.0 | 23 |
Baitarani River | - | 100.5 | 1.70 | 3.45 | 9.6 | 24 |
Mahanadi River | - | - | 9.69 | 5.90 | 9.8 | 25 |
Achankovil River | - | 11858 | 699.0 | 224.00 | - | 26 |
Koel(Brahmni River ) | - | 481.78 | 30.33 | 6.67 | 10.89 | 27 |
Ganga River | - | 800.0 | 260.0 | 10.0 | - | 28 |
Damodar River | - | 480 |
| 3950 | 11550 | 29 |
Tributaries of Shivnath River | 170.67 | 114.07 | 275.1 | 22.93 | 35.67 | Present study |
Standard Value | 200 | 300 | 300 | 100 | 50 | BIS: Bureau of Indian Standards, BIS 10500 : 1991 |
The trace metal values found for the river system of study area is then compared with the values reported for the other river system of the country and the results are shown in Table 3. The river is showing enriching values for Mn, Cr and Cu as compared to the other rivers of country. Since the values are below prescribed permissible level hence risk factor is not associated with this value, but care should be taken in future to avoid any unfavorable conditions.
Heavy Metal Pollution Index (HPI)
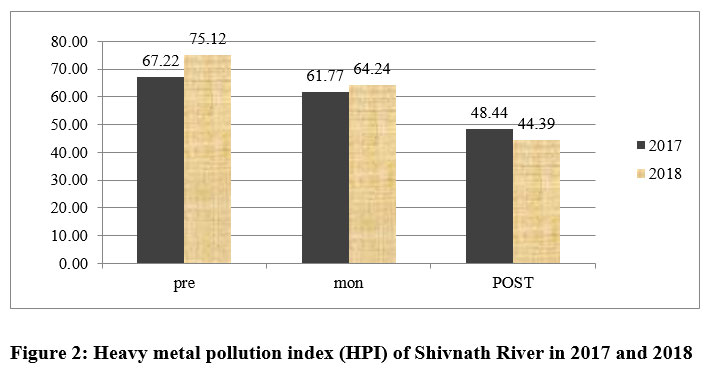
 | Figure: 2: Heavy metal pollution index (HPI) of Shivnath River in 2017 and 2018
|
When HPI values for Pre-Monsoon, Monsoon and Post Monsoon seasons of 2017 and 2018 are compared, the data revealed that in 2017 and 2018 minimum HPI was found in Post Monsoon season. (Figure 2). The average HPI for 2017 and 2018 was found 59.14 and 61.25 respectively, while the average HPI of Shivnath River is found 60.20 suggesting the low heavy metal pollution Index of Shivnath River according to Table 4. Prasad et al., 2001 has suggested the pollution index of HPI values for drinking water as 100. For the assessment of water quality, the three classes have been suggested as low, medium, and high-water quality14.
Table 4: Heavy metal pollution index (HPI) range and water quality status.
HPI Value | Water Status |
HPI <90 | Low water quality |
90-150 | Medium water quality |
>150 HIGH | High water quality |
Human Health Risk Assessment
Individuals' daily routes via which human gets exposed to risk of trace metals pollution might includes inhaling through route of mouth and nose, through the food they take, and absorption through their skin. of these possible routes, ingestion through water used for drinking and other purposes is one of the most wide spread exposure channel, which is discussed in this research paper. After assessing the trace metal contamination of the study area, through adult trace metal intake, average human health risk index is also calculated. For this assessment Exping, HQing (non-carcinogenic effect) and CRing (carcinogenic effect) values were calculated. Tables 4-9 shows the results of Exping, HQing, and CRing of the studied trace metals for human in all the five sampling sites of the study area. The direct intake of heavy metals are calculated and expressed as Exping while the potential non carcinogenic risk is calculated by comparing the estimated values of corresponding metal values with the reference dose (RfD). The calculated values of HQ for studied metals suggest the non-carcinogenic potential risk for an individual through ingestion pathway. The carcinogenic risk through ingestion pathway is also estimated by calculating Carcinogenic Risk (CR) values. The calculated values obtained for different health risk assessment indices for the trace metals present in the water samples, suggest that the water collected from rivers of the studied area is safe for human consumption.
Table 5: Human Exposure (Exping), Hazardous Quotient (HQing), Human Exposure surface water and Carcinogenic Risk (CRing) of heavy metals for Human in Site-1(Amner River).
Metals | RfD | EXP | HQ | HE | CR |
Al | 1000 | 6.6×10⁻³ | 7×10⁻⁶ | 7.4×10⁻¹ | ND |
Cr | 3 | 1.6×10⁻³ | 5.3×10⁻⁴ | 1.7×10⁻¹ | 8.0×10⁻² |
Cu | 40 | 9.4×10⁻⁴ | 2.4×10⁻⁵ | 1.0×10⁻¹ | ND |
Mn | 24 | 1.1×10⁻² | 4.8×10⁻⁴ | 1.29 | ND |
Fe | 700 | 7.2×10⁻³ | 1.0×10⁻⁵ | 8 | ND |
Table 6: Human Exposure (Exping), Hazardous Quotient (HQing), Human Exposure surface water and Carcinogenic Risk (CRing) of heavy metals for Human in Site-2 (Sakri River).
Metals | RfD | EXP | HQ | HE | CR |
Al | 1000 | 7.4×10⁻³ | 7×10⁻⁶ | 8.2×10⁻¹ | ND |
Cr | 3 | 1.6×10⁻⁴ | 5.5×10⁻⁵ | 1.8×10⁻² | 2×10⁻⁶ |
Cu | 40 | 9.8×10⁻⁴ | 2.5×10⁻⁵ | 1.0×10⁻¹ | ND |
Mn | 24 | 1.8×10⁻² | 7.5×10⁻⁴ | 2.006205 | ND |
Fe | 700 | 6.6×10⁻³ | 1×10⁻⁵ | 7.4×10⁻¹ | ND |
Table 7: Human Exposure (Exping), Hazardous Quotient (HQing), Human Exposure surface water and Carcinogenic Risk (CRing) of heavy metals for Human in Site-3 (Shivnath Mohara Ghat).
Metals | RfD | EXP | HQ | HE | CR |
Al | 1000 | 1.0×10⁻² | 1.0×10⁻⁵ | 1.116584 | ND |
Cr | 3 | 9.8×10⁻⁴ | 3.3×10⁻⁴ | 1.0×10⁻¹ | 4.0×10⁻⁶ |
Cu | 40 | 1.8×10⁻³ | 4.7×10⁻⁵ | 2.0×10⁻¹ | ND |
Mn | 24 | 1.1×10⁻² | 4.9×10⁻⁴ | 1.314278 | ND |
Fe | 700 | 1.1×10⁻² | 1.7×0-5 | 1.299671 | ND |
Table 8: Human Exposure (Exping), Hazardous Quotient (HQing), Human Exposure surface water and Carcinogenic Risk (CRing)of heavy metals for Human in Site-4 (Shivnath Pulgaon Durg).
Metals | RfD | EXP | HQ | HE | CR |
Al | 1000 | 9.3×10⁻³ | 9×10⁻⁶ | 1.043383 | ND |
Cr | 3 | 3.2×10⁻³ | 1.0×10⁻³ | 3.5×10⁻¹ | 1×10⁻⁶ |
Cu | 40 | 7.4×10⁻⁴ | 1.9×10⁻⁵ | 8.2×10⁻² | ND |
Mn | 24 | 1.1×10⁻² | 4.8×10⁻⁴ | 1.304228 | ND |
Fe | 700 | 6.3×10⁻³ | 9.0×10⁻⁶ | 7.0×10⁻¹ | ND |
Table 9: Human Exposure (Exping), Hazardous Quotient (HQing), Human Exposure surface water and Carcinogenic Risk (CRing) of heavy metals for Human in Site-5 (Panabaras).
Metals | RfD | EXP | HQ | HE | CR |
Al | 1000 | 8.6×10⁻³ | 8.6×10⁻⁶ | 9.6×10⁻¹ | ND |
Cr | 3 | 2.8×10⁻³ | 9.4×10⁻⁴ | 3.1×10⁻¹ | 3.0×10⁻⁶ |
Cu | 40 | 1.4×10⁻³ | 3.5×10⁻⁵ | 1.5×10⁻¹ | ND |
Mn | 24 | 1.4×10⁻² | 6.1×10⁻⁴ | 1.62916 | ND |
Fe | 700 | 6.1×10⁻³ | 8.8×10⁻⁶ | 6.8×10⁻¹ | ND |
The calculated values of HQing for all samples collected from the studied sites are less than one (Unity), which indicate that there is no associated health risk posed by the ingestion of trace metals present in samples of the study area by an individual.
The calculated values of health risk assessment indicates that the main contributors of non carcinogenic health risk in the present study are Mn, Cu and Cr. These trace metals present in the surface water of the studied area suggests that source of these metals are anthropogenic like industrial discharges, untreated urban effluents, and mining.20,21 The daily exposure risk assessment index was less than 1 for all metals across all sampling sites except for Mn in all sites. The health risk assessment indices values less than one indicate that trace metals present in river water of the research location will not have any health risk due to direct ingestion of water by humans16,19. Though risk to the health linked with the trace metals present in the samples of the studied sites are less significant, the future threat of cumulative effect due to long-term exposure cannot be ignored. The incremental chances of developing cancer due to long-term exposure during the life span of an individual of these trace metals present in studied samples the CRing (Carcinogenic Risk) is also calculated. The CRing value calculation for all the studied trace metals were not possible since the cancer slope (needed for calculation of CRing value) is available only for Cr in the literature30. The average estimated carcinogenic risk values of CRing for Cr were found in the range of 10-4 - 10-6. The values suggest the sampling sites show no potential risk. Besides these indices noteworthy contribution in the study of health effects exerted by trace metals present in water system have been also studied by many researchers, using some novel and promising approaches, such as source apportionment studies using environmental forensic tools. These tools are very helpful in identifying the sources of anthropogenic heavy metals that contribute to their accumulation at any given site. These tools will help to frame thriving strategies for heavy metal discharge control strategies and to frame remediation strategies for contaminated sites. Heavy metal stable isotopes (e.g. copper, lithium, and zinc) have been increasingly used for this purpose.31-33
Conclusion
The contamination of surface water due to different dissolved metals is an important matter of concern since any pollution in these water, may directly affect the human health. Based on the results obtained for the surface water of the study area it can be concluded that the studied river sites are not polluted by the trace metals studied. The trace metal values found for the River system of the study area is compared with the values reported for the other river systems of the country and the results reveal enriching values for Mn, Cr and Cu as compared to the other rivers of the country. Since the values are below prescribed permissible level hence risk factor is not associated with these values, but care should be taken in future to avoid any unfavorable conditions. When the HPI values for Pre Monsoon, Monsoon and Post Monsoon seasons of 2017 and 2018 are compared, the data revealed that in 2017 and 2018 the HPI was lowest in Post Monsoon season. The average HPI of the river in 2017 and 2018 were 59.14 and 61.25 respectively, while the average HPI of Shivnath river is found 60.20 suggesting the low heavy metal pollution Index of river Shivnath. Human Health Risk Assessment by calculating Exping, HQing, and CRing reveals that there is small risk involved or no little or no risk in ingesting the surface water due to trace metals by an individual since the values are less than 1.
Acknowledgement
Authors are thankful to Bhilai Institute of Technology, Durg, C. G., where this research work is conducted.
Conflict of Interest
There is no conflict of interest.
Funding Sources
There is no funding or financial support for this research work.
Reference:
- Morel, F. M. M. and N. M. Price. 2003. The Biogeochemical Cycles of Trace Metals in the Oceans. Science.300(5621):944-947. DOI: 10.1126/science.1083545.
CrossRef - Bahadir, T., Bakan, G., Altas, L. and Buyukgungor, H.(2007) Enzyme Microb. Technol., 41, 98–102.
- Perez-Marin, B., Ballester, A., F. Gonza´lez, M. L. Bla´zquez, J. A. Mun˜oz, J. Sa´ez and Zapata, 12. V. M.(2008), Bioresour. Technol., 2008, 99, 8101–8106.
CrossRef - Prasad B, Bose JM (2001) Evaluation of heavy metal pollution index for surface and spring water near a limestone mining area of the lower Himalayas. Environ Geol 41:183–188.
CrossRef - Central water commission, https://www.downtoearth.org.in/news/water/huge-amounts- of-toxic-heavy-metals-swim-in-indian-rivers-60545, (15 may 2018).
- O.K. Musa, M.M. Shaibu, E.A. Kundamnya, ( 2013) American international journal of contemporaryresearch.; 3( 8) 170- 177.
- K. A. Tiwari, D.M. Maio, K.p. Singh, K.M. Mahato, (1015) Bull Environ Contamination toxicol; 95 304-310
CrossRef - K. Brindha, G. Jagadeshan, L. Kalpana, L. Elango, Environmental science pollution resources; 23: (2016)8302-8316
CrossRef - E.S.E. Oman, Model earth system environ : 2 (3) (2016) 119p
CrossRef - R. Singh, A.S. Venkatesh, T.H. Syed, A.G.S. Reddy, M. Kumar, R.M. Kurakalva, Environ Earth Sci; 76 (16):(2017) 566p
CrossRef - M.V. Wagh, B.D. Panaskar, V.S. Mukate, K.S. Gaikwad, A.A. Muley, N.K. Varade, Modeling earth system and environment (2018) 12p DOI/10.1007/s40808-018-0496
- Prasad, M. B. K.; Ramanathan, A. L.; Shrivastav, S. K.;Anshumali.; Rajinder, S., (2006). Metal fractionation studies in surfacial and core sediments in the Achankovil river basin in India. Environ. Monitor. Assess., 121(1-3), 77-102 .
- Mohan SV, Nithila P, Reddy SJ (1996) Estimation of heavy metal in drinking water and development of heavy metal pollution index. J Environ Sci Health A 31(2):283–289.
- Horton RK (1965) An index number system for rating water quality. J Water Pollut Control Federation 37(3):300–306
- Edet AE, Offiong OE (2002). Evaluation of water quality pollution indices for heavy metal contamination monitoring. A study case from Akpabuyo-Odukpani area, Lower Cross River Basin (southeastern Nigeria). GeoJournal 57:295–304.
- Reddad, Z., rente, C., Ge ´Andre `s, Y., Thibault, J.-F. andCloirec, P. Le (2003), Water Res., 37, 3983–3991.
- Asare-Donkor N. K., Boadu T. A., Adimado A. A., Evaluation of groundwater and surface water quality and human risk assessment for trace metals in human settlements around the Bosomtwe Crater Lake in Ghana, SpringerPlus, 2016.
- Reddy SJ (1995) Encyclopaedia of environmental pollution and control, vol 1. India, Environmental Media, Karlia, p 342.
- Li S. Y., Zhang Q. F., Spatial characterization of dissolved trace elements and heavy metals in the upper Han River (China) using multivariate statistical techniques, J. Hazard.Mater., 2010; 176(1-3), 579-588.
CrossRef - USEPA Drinking Water Standards and Health Advisories, EPA 822-R-09–011, Office of Water, Washington DC, USA, 2009.
- Elumalai V., Brindha K., Lakshmanan E., Human Exposure Risk Assessment Due to
- Heavy Metals in Groundwater by Pollution Index and Multivariate Statistical Methods: A Case Study from South Africa,Water 2017; 9(4), 234.
CrossRef - Iqbal J., Shah M. H., Health Risk Assessment of Metals in Surface Water from Freshwater Source Lakes, Pakistan, Hum. Ecol. Risk. Assess., 2013; 19(6), 1530-1543.
CrossRef - Wu B., Zhao D. Y., Jia H. Y., Zhang Y., Zhang X. X., Cheng S. P., Preliminary Risk Assessment of Trace Metal Pollution in Surface Water from Yangtze River in Nanjing Section, China, Bull. Environ. Contam. Toxicol., 2009, 82(4), 405-409.
CrossRef - Nayak, B. B.; Panda, U. C.; Panigrahy, P. K.; Acharya, B.C.; (2001). Dynamics of heavy metals in Dhamara Estuary of Orissa state in India. Chem. Environ. Res., 10 (3-4), 203-218
- Konhauser, K. O.; Powell, M. A.; Fyfe, W. S.; Longstaffe, F. J.; Tripathy, S., (1997). Trace element chemistry of major rivers in Orissa State, India. Environ. Geo., 29 (1-2), 132-141 (10 pages).
CrossRef - Chaterjee, C. and Raziuddin, M. 2002. Determination of water quality index (WQI) of a degraded River in Asanol Industrial area, Raniganj, Burdwan, West Bengal. Nature Environment and Pollution Technology. 1(2) : 181-189.
- Jain, C. K.; Sharma, M. K., (2006). Heavy metal transport in the Hindon river basin, India. Environ. Monitor.Assess., 112 (1-3), 255-270 .
- Senapati, N. K.; Sahu, K. C., (1996). Heavy metal distribution in Subarnarekha river east coast of India. Indian J. Mar. Sci., 25 (2), 109-114 .
- Sundaray, S. K., (2009). Application of multivariate statistical techniques in hydro- geochemical studies-a case study: Brahmani–Koel River (India). Environ. Monitor.Assess., 164 (1-4), 297-310 .
CrossRef - Araujo, D.F., Knoery, J., Briant, N.,Ponzevera,E.,Chouvelon,T.,Auby,I.,Yepez,S., Bruzac,S.,Sireau,T., Pellouin-Grouhel,A.,Akcha,F.,2021.Metal Stable isotopes in transplanted oysters as a new tool for monitoring anthropogenic metal bioaccumulation in marine environments: the case for copper. Environ.Pollut,290,118012. https://doi.org/10.1016/j.envpol.2021.118012.
CrossRef - Jeong,H., Ra, K., Won, J.H.2021. A nationwide survey of trace metals and Zn isotopic signatures in mussels (Mytilus edulis) and oysters (Crassostrea gigas) from the coast of south korea.Mar.Pollut.Bull.173,113061.https://doi.org/10.1016/j.marpolbul.2021.113061.
CrossRef - Wang,L., Wang, X., Chen,H., Wang, Z., Jia, X., 2022. Oyesterarsenic,cadmium,copper,mercury,lead and zinc levels in the northern south cina sea: long term spatiotemporal distributions, combined effects, and risk assessment to human health. Environ. Sci. Pollut.Res.29,12706-12719.https://doi.org/10.1007 /s11356-021-18150-6.
CrossRef


