A Comparative Study of Physicochemical Characteristics of Siddhewadi and Morna Tank, South Western Part of Maharashtra, India
Mujawar Ummekousar Haroon1
*
 and Abdar Mohan Ramchandra2
1
Rayat Institute of Research and Development (RIRD),
Satara,
Maharashtra
India
2
Department of Zoology,
Krantisinh Nana Patil College,
Shivaji University, Kolhapur,
Maharashtra
Infia
http://dx.doi.org/10.12944/CWE.20.3.25
Copy the following to cite this article:
Haroon M. U, Ramchandra A. M. A Comparative Study of Physicochemical Characteristics of Siddhewadi and Morna Tank, South Western Part of Maharashtra, India. Curr World Environ 2025;20(3). DOI:http://dx.doi.org/10.12944/CWE.20.3.25
Copy the following to cite this URL:
Haroon M. U, Ramchandra A. M. A Comparative Study of Physicochemical Characteristics of Siddhewadi and Morna Tank, South Western Part of Maharashtra, India. Curr World Environ 2025;20(3).
Download article (pdf)
Citation Manager
Publish History

Introduction
Water is an essential natural resource for the life functions of all living beings. It is the universal solvent that not only supports life but also acts as a medium for pathogens.1 Although about 70% of the surface of the Earth is occupied by water, and just 0.02% of it is of freshwater from tanks, rivers, and ponds, it meets our diverse needs. For the survival of living organisms water is very essential. Poor water quality is responsible for approximately 3.1% of global deaths.2 The water quality declines and depletes flora fauna from water bodies due to the addition of industrial waste, recurrent consumption of fertiliser and pesticides in agriculture leads to pollution of fresh water body,such fresh water bodies affect other fresh water bodies.3
Tanks play an essential role in the environment, serving as sources of surface and groundwater recharge while supporting diverse aquatic life. They are primary sources of drinking water and irrigation, but lose their value when altered physically, chemically, or biologically.4 Healthy ecosystems rely on these qualities.5 Water quality affects species composition and productivity,6 and is critical for human health. Clean water is vital for existence.7 Monitoring water standards is crucial, given that many tanks, especially in India, are often alkaline.8 Currently, tank water is utilized for irrigation, domestic use, fishing, and cultivating paddy fields in nearby areas. Water is very important for survival on Earth. There are many water resources, one of which is tanks are very useful. Tank water can be used for drinking, agriculture, aquaculture, and domestic uses. Water quality Parameters are one of the most helpful tools for understanding the quality of water for people. Due to global warming and the human population's increased pollution, health has been affected. So, it's very important to know about the standard of water; it confirms possible problems. In India, the tank system is becoming increasingly contaminated with each passing day. As the water moves downstream, it collects various pollutants that enter the tank water, like domestic waste water, waste from animal and runoff from farm. Fertilisers used in agriculture are absorbed by the soil and from where they enter in the freshwater body.9 Regrettably, many of the tanks are encountering issues related to pollution. Water is an essential natural resource that holds significant social and economic importance for humanity. The survival of humans would be at risk without water.10 The primary sources of drinking water globally are surface water and groundwater.11
The quality of fresh water has vital to human health, functionality, ecological growth and numerous financial processes. Water quality needs to be evaluated, controlled and maintained to protect human health, the environment and the long-term utilization of this valuable resource.Morna and Siddhewadi tanks are vital freshwater sources that serve farming ,domestic and manufacturing needs in the Tasgaon and Shirala tehsils. Waters quality of these tanks varies greatly across different seasons due to changes in temperature, rainfall, and human activities. Therefore, it is essential to systematically collect and analyse water samples during the three primary seasons: summer, monsoon, and winter. This approach allows for a comprehensive understanding of the temporal variations in physicochemical parameters. Monitoring water quality seasonally enables precise evaluation, identification of pollution sources, and the development of effective management strategies to ensure the sustainable use of these important waters.
Materials and Methods
Siddhewadi Tan
The samples of waters were gathered to different study sites of Siddhewadi Tank Tasgaon tehsil, namely Siddhewadi 1, Siddhewadi 2, Dahiwadi, and Wayphale. The Siddhewadi tank is present in the Agrani River basin, and water comes into them from the Agrani River and rainwater. Siddhewadi tank is a medium irrigation tank completed in 1978-1979. The total catchment area of the Siddhewadi tank is 166.40 sq.km. Gross storage capacity 303.003 mcft. Dead storage 87.617mcft, live storage 215.386mcft, maximum water level 302.95 mcft.
Morna tank
The water sample was collected from different stations of Morna Tank, Shirala tehsil, like Shirala, Padali, and Antari Kadamwadi. The Shirala tank,, presents near the Morna River water comes from the river and also rainwater. Morna tank medium irrigation tank total catchment area of the tank is 85.5(sq. km), the dead storage is 4.64(cubic mm), the live storage is 16.64(cubic mm), the gross storage capacity is 21,160.00 km3, maximum water level is 595.7(m), total length of tank 1115 (m), completion of tank 1985.
Methodology
The current study was carried out from August 2022 to July 2023, encompassing an entire annual cycle, encompassing seasonal changes during Summer (from February to May),Winters (from October to January),or Monsoon (from June to September). Seasonaly samples water were collected from eight locations in the study tanks during the morning hours (9:00–11:00 a.m.) using pre-cleaned, acid-washed plastic containers that were securely capped, labelled, and transported to the RIRD laboratory for analysis.The container where rinse three times before collection of water sample to avoid air bubbles and gas exchange. In the monsoon, a water sample was collected at four different locations of Siddhewadi and Morna Tank, depending on the addition of agricultural runoff, industrial waste, village waste, and domestic waste.In Summer due to evaporation of maximum water samples were collected at deep portion of both tanks.In winter,collect the water sample away from bank of upto 30cm. A total of 11 physicochemical parameters were assessed, including, temperature, turbidity, dissolved oxygen, calcium, magnesium, iron, fluoride, pH, electrical conductivity, total dissolved solid and total hardness. Examinations were performed with APHA (2017) standard procedures using suitable instruments, such as a digital pH meter, conductivity/TDS meter, and digital thermometer, to guarantee the accuracy and reliability of the results.
Results
Hydrogen Ion Concentration pH
The pH level shows how strong the acidic or basic nature of specific water is, and it can be regulated by chemical that has dissolved substances or biological mechanism within the solution.12 The pH level indicates the concentration of H+ ions in a liquid. It serves as a crucial indicator of both acidity and alkalinity. A pocket digital pH meter was used to determine the pH at the research site within the tank. In this current investigation, the pH of the Siddhewadi tank remained 7 to 8, while the pH of Morna remained 8 to 9. This indicates that the pH of the Morna tank was slightly increased due to biological activity, anthropogenic and domestic waste. Summertime saw the highest pH while wintertime saw the lowest. Siddhewadi pH was lower due to less human activity and less human habitat (Fig. 1). In Morna Tank, the pH was recorded higher than Siddhewadi Tank, which was maximum in summer and minimum in winter season.
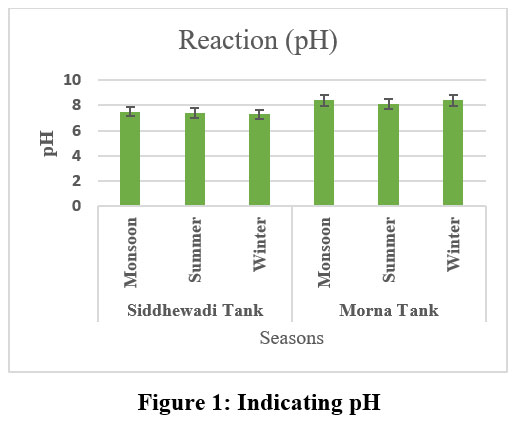 | Figure 1: Indicating pH
|
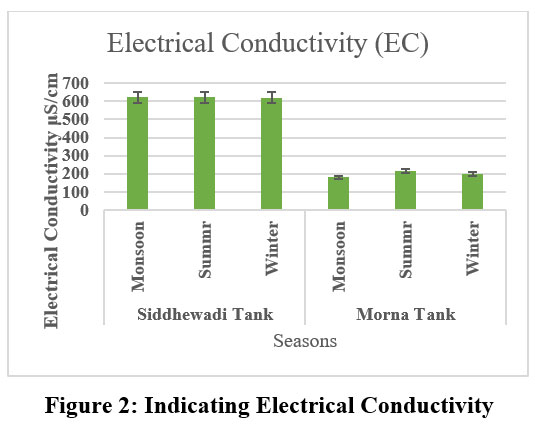 | Figure 2: Indicating Electrical Conductivity
|
Electrical Conductivity
Electrical Conductivity is crucial factor for assessing or monitoring quality of water and reflects the waters ability to transmit electric current varies based on how many ions are dissolve within it.13 The Electrical conductivity value serves as a measure of the overall nutrient concentration in a body of water. When using specific conductivity as a reference, readings exceeding 200uS/cm indicate greater nutrient enrichment levels. In the present study, EC was recorded in Siddhewadi tank, which is between 625uS/cm and Morna Tank, 100uS/cm to 200 uS/cm (Fig.). The capacity of a solution to carry an electrical current is determined by the movement of ions and is influenced by the type and quantity of ionic species present in that solution. This characteristic is known as electrical conductivity. It serves as a valuable method to evaluate the purity of water.14
Total Dissolved Solids (TDS)
The Total Dissolved Solids signify the level of salinity in water.27Its a very essential parameter for establishing the standards for water quality. Total Dissolved Solids (TDS) shows an impact on water quality. Water that has a higher Total Dissolved Solids (TDS) content often has an unpleasant taste. TDS values fluctuate between 305 and 311 in Siddhewadi Tank, and 136 to 138 mg / L recorded in Morna tank (Fig. 3). The maximum value was recorded in the monsoon season due to rainfall, and the minimum value was recorded in the summer season of both tanks. The World Health Organisation (W.H.O.) recommends TDS level 500 mg/lit.15
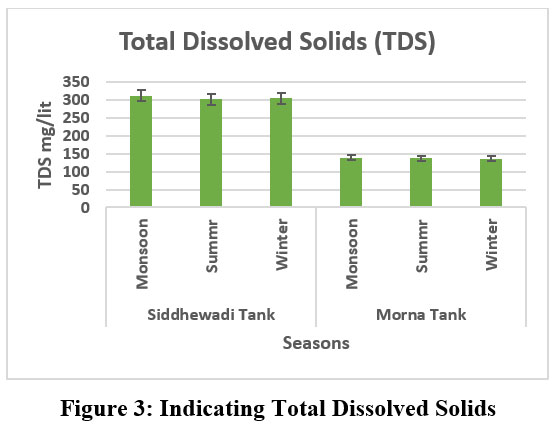 | Figure 3: Indicating Total Dissolved Solids
|
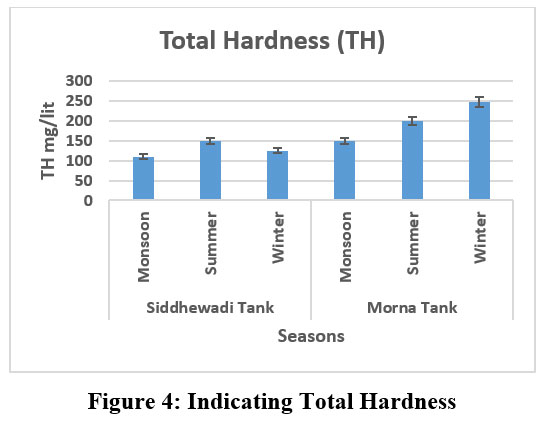 | Figure 4: Indicating Total Hardness
|
Total Hardness
Total hardness is the key chemical property that reflects the waters ability to interact with detergents.16 Total hardness in Siddhewadi tank ranges from 110 to 200, while in Morna tank it varies between 200 and 250mg/lit (Fig. 4). The highest values were recorded in the summer season in Siddhewadi tank, but in Morna tank, the maximum total hardness was recorded in winter, with the minimum values for both tanks observed during the monsoon.
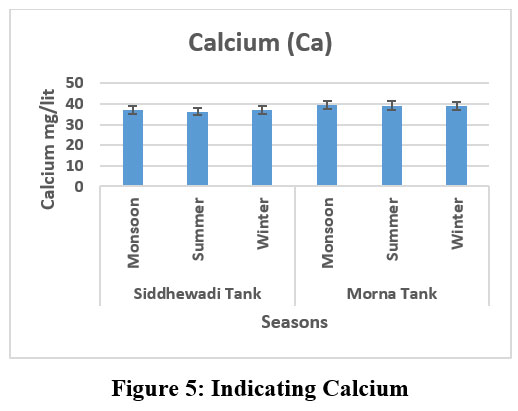
Calcium
In Morna Tank, the maximum calcium level ranges from 39.3 mg/L during the monsoon season. In Siddhewadi Tank, the recorded minimum calcium level is 36 mg/L (Fig. 5).
 | Figure 5: Indicating Calcium
|
 | Figure 6: Indicating Magnesium
|
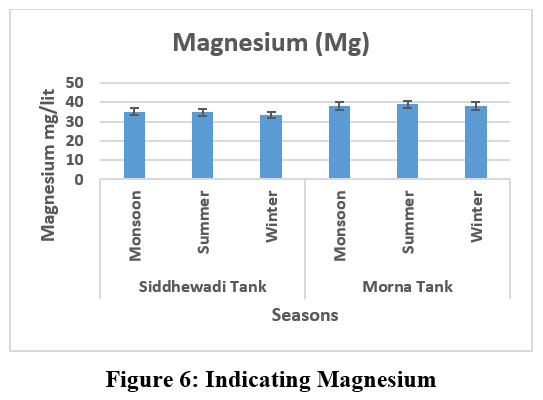
Magnesium
The maximum concentration of magnesium recorded in Morna Tank during the summer season was 39, while the minimum concentration observed in Siddhewadi Tank was 33 mg/l, (Fig. 6) recorded in either October or November is part of the winter season. A substantial concentration of magnesium can affect the quality of water.
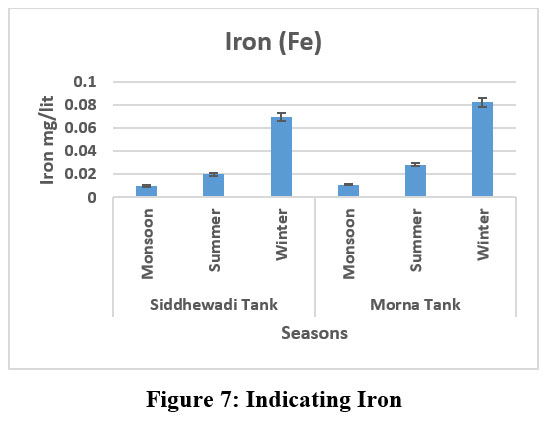
Iron
In the summer, iron levels were elevated in both tanks compared to other times of the year. The Siddhewadi tank had an iron concentration of 0.07 mg/L, while the Morna tank showed a slightly higher level at 0.0825 mg/L(Fig.7). This seasonal rise is primarily attributed to evaporation, reduced water levels, and interactions with sediments. The consistently higher readings in Morna may indicate more human activity or differences in the geology of the catchment area. These variations underscore the importance of ongoing monitoring to evaluate seasonal shifts in water quality.
 | Figure 7: Indicating Iron
|
 | Figure 8: Indicating Fluoride
|
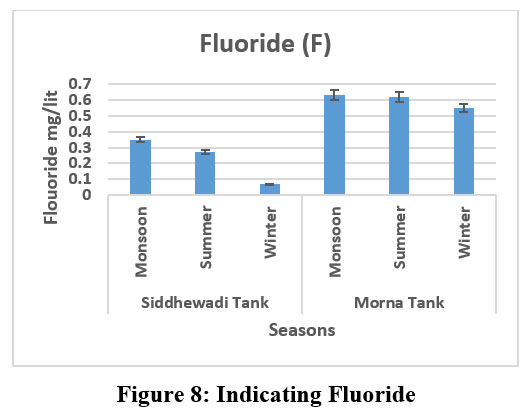
Fluoride
The fluoride concentration in both Siddhewadi and Morna tanks shows seasonal variation, but Morna Tank consistently has higher values. In Siddhewadi Tank, fluoride levels are 0.35 mg/L in monsoon, 0.275 mg/lit in summer, and 0.0675 mg/lit in winter, showing a sharp decrease during winter. In comparison, Morna Tank records 0.635 mg/lit in monsoon, 0.625, and 0.55 mg/l and 0.55 mg/l in winter (Fig. 8.), with relatively stable values across seasons. Overall, Morna Tank contains more fluoride than Siddhewadi Tank in all seasons.
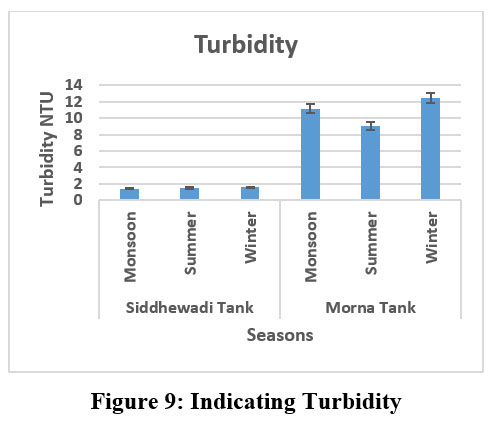
Turbidity
Turbidity refers to the level of cloudiness in water. Fresh water bodies accumulate slits, sand, clay, chemical sediments, bacteria, pathogens and decomposing organic matter leading to an evaluated turbidity level of water.17 In this study, the turbidity values observed for Siddhewadi Tank were low and stable, measuring 1.4 during the monsoon, 1.5 in summer, and 1.6 in winter. These values indicate clear water conditions with minimal suspended particles. In contrast, Morna Tank displayed significantly higher turbidity, with values of 11.125 in the monsoon, 9.05 in summer, and 12.4375 NTU in winter. Turbidity levels ranged from 1.2 to 14.5 NTU (Fig. 9), with higher values observed in winter due to the resuspension of bottom sediments. This supports the conclusion that Siddhewadi Tank exhibits better water clarity compared to Morna Tank.
 | Figure 9: Indicating Turbidity
|
 | Figure 10: Indicating Dissolved Oxygen
|
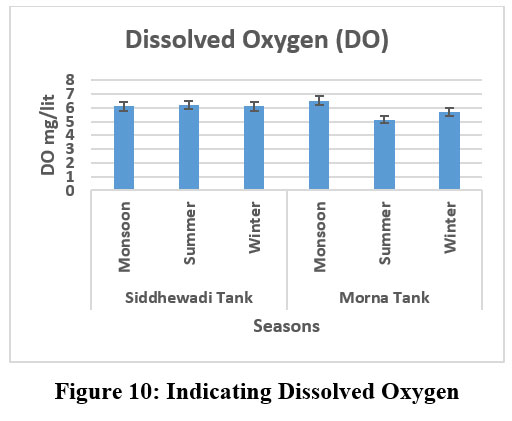
Dissolved Oxygen
As a key regulator of an organism's metabolic processes, dissolved oxygen controls the metabolism of the entire living population and serves as a gauge of the water's tropic status.18 Dissolved oxygen is crucial in regulating the metabolic processes of organisms, thereby influencing the metabolism of the entire living community. It is also utilized measure of the trophic condition of water.36 In Siddhewadi, the tank remained relatively stable throughout the seasons, measuring 6.1 mg/L mg/L in the monsoon, 6.2 mg/l in summer, again 6.1 mg/l in winter. These levels indicate healthy oxygenation that supports aquatic life. In contrast, the Morna tank showed more variation, with DO levels recording 6.52 mg /l in the monsoon, dropping 5.125 mg/l in summer, or rising slightly to 5.7mg/l in winter. This fluctuation, particularly the decline during summer, may be attributed to higher temperatures and the decomposition of organic matter. This comparison emphasises that Siddhewadi Tank maintains better oxygen stability, while Morna Tank shows greater susceptibility to seasonal changes.
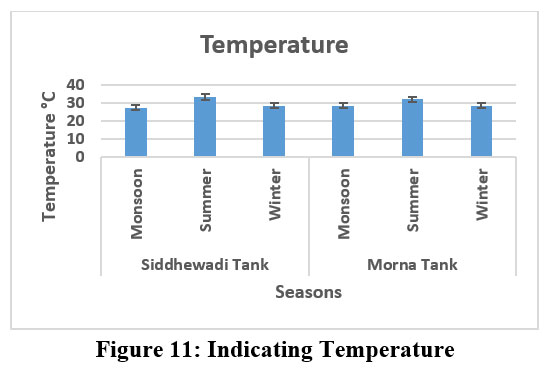
Temperature
Temperature plays an essential function in managing physicochemical or biological properties of water, particularly in freshwater ecosystems.39 The temperature of surface water perform a vital role in shaping both biochemical processes within aquatic ecosystems. Aquatic organisms such as macroinvertebrates, fish, and other aquatic life depend on particular temperature ranges for their optimal well-being. Temperature influences the oxygen levels in the water, the rate of photosynthesis in aquatic plants, and the metabolic functions of aquatic species. In this study, we measured temperatures using a thermometer. The water temperatures varied between 26.0°C and 32.0°C in both tanks (Fig. 11). The temperature data recorded can be found in Table No. 1 and Figure No. 11.
 | Figure 11 Indicating Temperature
|
Table 1: Indicating Average values of physicochemical parameters of Siddhewadi and Morna Tank during Monsoon, summer, and winter seasons during August 2022 –July 2023.
Parameters | Siddhewadi Tank | Morna Tank | ||||
Monsoon | Summer | Winter | Monsoon | Summer | Winter | |
Reaction pH | 7.5 | 7.4 | 7.3 | 8.4 | 8.12 | 8.4 |
Electrical Conductivity | 621.25 | 622.5 | 620.81 | 180.75 | 216.84 | 200.25 |
Total Dissolved Solids | 311.75 | 301.7 | 305.7 | 138.31 | 137.81 | 136.06 |
Total Hardness (TH) | 110.5 | 150.4 | 125.5 | 150.5 | 199.5 | 247.5 |
Calcium (Ca) | 37.11 | 36.21 | 37.05 | 39.375 | 39.18 | 38.81 |
Magnesium (Mg) | 35.18 | 34.92 | 33.5 | 38.18 | 39 | 38.1 |
Iron (Fe) | 0.01 | 0.02 | 0.07 | 0.011 | 0.0285 | 0.0825 |
Fluoride (F) | 0.35 | 0.27 | 0.067 | 0.63 | 0.62 | 0.55 |
Turbidity | 1.4 | 1.5 | 1.6 | 11.125 | 9.05 | 12.43 |
Dissolved Oxygen (DO) | 6.1 | 6.2 | 6.1 | 6.52 | 5.125 | 5.7 |
Temperature | 27.6 | 33.3 | 28.7 | 28.52 | 32.1 | 28.65 |
Discussion
Seasonal fluctuations significantly influence physicochemical water quality parameters, a pattern consistently highlighted in the literature. For instance, Chambal River (Rajasthan, India), the researcher studied from 2010 to 2022. The study showed that Electrical conductivity was higher in summer, while Turbidity was maximum during the rainy season. A similar trend was observed in both tanks.
The levels of pH fluctuated with the changing seasons.19 pH remains alkaline during the study period in Morna Lake, while neutral in Siddhewadi Lake. A similar trend of pH was observed during study period.20 Total hardness of water is primarily attributed the presence of magnesium and calcium.21 pH increasing in the summer season, Pimparkar.22 pH in Morna Tank remained consistently alkaline across seasons, whereas Siddhewadi Tank showed values closer to neutral. This difference suggests stronger buffering and bicarbonate/carbonate influence in Morna, while Siddhewadi reflects more dilute and neutral conditions. Similar alkaline trends in Indian lentic ecosystems were reported by Tirupati.23
Total dissolved solid and Electrical Conductivity were observed to be greater in Siddhewadi than in Morna. The increased levels of EC and TDS in Siddhewadi are likely due to ongoing ionic contributions from the local geology and human activities, including agricultural runoff. In contrast, the lower values in Morna suggest a more effective dilution process. Similar results were recorded by Vibhute.24 Electrical Conductivity (EC) is not directly related to health issues for humans or aquatic life; rather, it serves as a marker for other potential water quality concerns. Elevated EC levels indicate a significant presence of ionic substances in the water.25 Electrical Conductivity Comparable studies indicate variations in higher, lower, and mid-levels during the dry season acceptable range.26
Total dissolved solids decreased and increased due to human anthropogenic activities. Similar results were recorded.27,28 Total hardness increased in summer seasons due to higher temperatures.29,30 Calcium level is high in the summer and winter seasons.31 In the current research, iron concentrations exhibited seasonal fluctuations, with elevated levels observed in the summer, linked to evaporation, and reduced amounts noted during the monsoon as a result of rainfall dilution. Comparable seasonal patterns have been documented.32 Fluoride levels also showed variations throughout the seasons, with higher concentrations in the summer attributed to evaporation and lower levels during the rainy season due to dilution, as noted.33 Turbidity indicates how cloudy water is and is quantified in units of Nephelometric Turbidity Units. Organic bodies of water can gather materials such as chemicals, clay, silt, sand, residues, bacteria, pathogens, and decomposing organic matter, leading to higher turbidity levels.34,35 In this study period, Morna Lake, dissolved oxygen levels were highest during the monsoon, lowest during the summer, which reflects seasonal variations likely influenced by temperature and microbial decomposition of organic matter. Same results recorded. During summer, the lowest dissolved oxygen (DO) levels may result from higher water temperatures, which reduce oxygen solubility. Additionally, DO content decreases as microorganisms consume more oxygen while decomposing organic matter.36,37 The present study observed that the pattern of its seasonal fluctuation is similar.38 During the summer season, from both the Morna and Siddhewadi tanks, high temperatures were recorded, similar to those recorded by Reddy.39
Conclusion
The current research indicates that, based on the seasonal examination of physicochemical parameters, Siddhewadi tank has a comparatively safer water quality than Morna tank. Key parameters such as fluoride, turbidity, and total hardness in Siddhewadi remain within acceptable limits across all seasons, suggesting lower pollution levels and better ecological balance. In contrast, Morna tank shows elevated levels of fluoride and turbidity, especially during the monsoon and summer seasons, which may pose risks to both aquatic life and human uses. These findings suggest that Siddhewadi tank water is more suitable for domestic and aquatic purposes, while Morna tank needs proper treatment and regular monitoring to ensure safe use and environmental sustainability. Therefore, this study emphasises the urgent need for remedial measures to protect and conserve the Morna tank to prevent further deterioration.
Acknowledgment
Author Miss Ummekousar Mujawar expresses gratitude to the Mahatma Joyita Phule Research Fellowship (MJPRF-2022) from the Government of Maharashtra, India, for its financial support. We express our gratitude to Dr Deepa Jaiswal, Officer-In-Charge, and Rehanuma Sulthana, Assistant Zoologist at the Freshwater Biology Regional Centre of the Zoological Survey of India in Hyderabad, for their assistance in identifying macroinvertebrate species. We also appreciate the support from the Rayat Institute of Research and Development (RIRD) in Satara for offering a laboratory for our research activities.
Funding Source
“This research was funded by the Mahatma Jyotiba Phule Research Fellowship (MJPRF-2022) from the Government of Maharashtra, India.” Grant identifiers include “Fellowship2022_1817.” The author, Miss Ummekousar Mujawar, has been granted research assistance through the Mahatma Jyotiba Phule Research Fellowship (MJPRF-2022) by the Government of Maharashtra, India.
Conflict of Interest
The authors do not have any conflict of interest.
Data Availability Statement
This statement does not apply to this article
Ethics Statement
This research did not involve human participants, animal subjects, or any material that requires ethical approval
Informed Consent Statement
This study did not involve human participants, and therefore, informed consent was not required.
Permission to Reproduce Material from Other Sources:
Not Applicable.
Author Contributions
Ummekousar Mujawar: Concept development and methodology writing, as well as data gathering and analysis, along with the initial writing of the manuscript and original draft.
Mohan Abdar: Reviewing the manuscript and creating visual representations, overseeing the project, and managing permissions.
References
- Zikirov B, Zikirov I. Water as an important natural resource and ecological factor. Super Science J Geogr Nat Resour. 2022;2(1):10–16.
CrossRef - Saini R, Shrivastava V. Prediction of drinking water quality for effective public health management to avoid waterborne diseases. South Eastern Eur J Public Health. 2024:292–296.
CrossRef - Rawal NC. Quality of river waters of India. In: Proc of the 47th Research Session of the CPIP, Hubli Dharwar, Karnataka. Vol II. 1978:139–160.
- Thirupathaiah M. Analysis of water quality using physico-chemical parameters in Lower Manair reservoir of Karimnagar district, Andhra Pradesh. Int J Environ Sci. 2012;3(1).
- Wetzel RG. Limnology: Lake and River Ecosystems. New York, NY: Academic Press; 2001:1006.
- United Nations Environment Programme. Water Quality of World River Basins. UNEP/GEMS Environment Library. Nairobi, Kenya: UNEP; 1996:40.
- Philipose MT. Freshwater phytoplankton of inland fisheries. In: Proceedings of the Symposium on Algology. New Delhi, India; 1960:279–291.
- Gobler CJ, Drinkwater RW, Anthony AW, et al. Sewage- and fertilizer-derived nutrients alter the intensity, diversity, and toxicity of harmful cyanobacterial blooms in eutrophic lakes. Front Microbiol. 2024;15.
CrossRef - Zhang L. Different methods for the evaluation of surface water quality: the case of the Liao River, Liaoning Province, China. Int Rev Spat Plan Sustain Dev. 2017;5(4):4–18.
CrossRef - Paun I, Chiriac FL, Marin NM, et al. Water quality index, a useful tool for evaluation of Danube River raw water. Rev Chim (Bucharest). 2017;68(8):1732–1739.
CrossRef - Patidar H, Soni A. Investigation of seasonal changes in water quality characteristics of different ponds in Dist. Dhar, Madhya Pradesh, India. Cuestiones de Fisioterapia. 2025;54(3):6933–6938.
- Kabir ES, Kabir M, Islam SM, et al. Assessment of effluent quality of Dhaka export processing zone with special emphasis to the textile and dyeing industries. Jahangirnagar Univ J Sci. 2002;25:137–138.
- Keskar BD, Pawar BA. Studies on physico-chemical parameter analysis of Sina Dam from Ahmednagar District of Maharashtra in relation to fish culture. J Chem Health Risks. 2024;3(4):242–247. doi:10.22122/jchr.v3i4.6655
- World Health Organization. Guidelines for Drinking-water Quality. 2nd ed. Vol 1. Geneva, Switzerland: WHO; 1998.
- Hujare MS. Limnological studies of the perennial waterbody, Attigre tank, Kolhapur district, Maharashtra. Nature Environ Pollut Technol. 2008;7(1):43–48.
- Rasakatla B, Aruna M. Analysis of physico-chemical parameters of a fresh water lake in Nizamabad District, Telangana State. World J Biol Pharm Health Sci. 2023;16(1):21–30. doi:10.30574/wjbphs.2023.16.1.0408
CrossRef - Boyd CE. Suspended solids, color, turbidity, and light. In: Water Quality: An Introduction. 3rd ed. Springer; 2020:119–133.
CrossRef - Tarzwell CM. Water quality criteria for aquatic life. In: Biological problems in water pollution. Ed. O. S. Dept of Health Education and Welfare. P.H.S.; 1957:246–272.
- Pulugandi C. Analysis of water quality parameters in Vembakottai water reservoir, Virudhunagar district, Tamil Nadu. Res J Recent Sci. 2014;3:242–247.
- Rama Kumari, Sharma RC. Seasonal variation in the physico-chemical variables of Western Himalayan Sacred Lake Prashar, Himachal Pradesh, India. Int Res J Environ Sci. 2018;7(7):29-36.
- Sonawane VY. Water quality of drinking waters in Parbhani City: A case study. J Chem Pharma Res. 2020;2(5):104–107.
- Pimparkar AM, Patil SN, Patil BD, Kadam AK. Comparative assessment of wetland water quality from rural and urban areas of Aurangabad District, Maharashtra, India using water quality index. HydroResearch. 2023;6:269–278. doi:10.1016/j.hydres.2023.10.001
CrossRef - Triupathi, RajeshKhatakho, Sabine Schuter, Mohammed Majdalawi, Analyse Ecosytem Evaluation of Waterquality in Gubi Reservior treatmaent plant in Bauchi State, Nigeria, Intern Journ Eng Rese and devlop, 2016,12, (10):2278-800.
- Vibhute SM. Seasonal variation of physicochemical parameters in perennial tank of Atpadi, Maharashtra. Int J Adv Res Sci Commun Technol. 2022;2(4):1–2.
- Umar K, Kyari E, Mbaya Y, Arhye. Assessment of some physicochemical parameters of Gubi and Waya Reservoir in Bauchi State, Nigeria. Int J Sci Technol Res. 2020;9(2):5719–5723.
- Garg RK, Rao RJ, Uchchariya D, Shukla G. Seasonal variations in water quality and major threats to Ramsagar Reservoir, India. Afr J Environ Sci Technol. 2010;4(2):61–76.
- Pardeep S, Dwivedi HS. Water quality assessment of Kshir Sagar water body at Ujjain, Madhya Pradesh, India. Int J Adv Res Biol Sci. 2016;3(8):28–35.
- Mayer E. Monitoring pond water quality to improve production. Biomin. Published 2012. Accessed June 15, 2025. https://thefishsite.com/articles/monitoring-pond-water-quality-to-improve-production.
- Patil PP, Sontakke GK. Assessment of the water quality status of Alsand Lake, Dist. Sangli (M.S), India: ecological conservation and sustainability. Uttar Pradesh J Zool. 2025;46(3):162–167.
CrossRef - Deshmukh AN, Khadse GK, Pande NP. Assessment of water quality of Godavari River at Trimbakeshwar & Kopargaon, Maharashtra. Int J Innov Res Sci Eng Technol. 2015;4(1):18533–18539.
- Patil PP, Sontakke GK. Assessment of the water quality status of Alsand Lake, Dist. Sangli (M.S), India: ecological conservation and sustainability. Uttar Pradesh J Zool. 2025;46(3):162-167.
CrossRef - Jadhav S, Patil A. Seasonal variation of fluoride concentration in Manar Reservoir, Maharashtra. Int J Appl Res. 2017;3(5):363–366.
- Jayabhaye UM. Studies of physico-chemical parameters of Wadad Tank of Hingoli District, Maharashtra. J Aqua Biol. 2013:38–41.
- Singh AK, Mondal GC, Kumar S, Singh TB, Tewary BK, Sinha A. Major ion chemistry, weathering processes and water quality assessment in upper catchment of Damodar River basin, India. Environ Geol. 2008;54:745–758.
CrossRef - Amte GK, Shinde PP, Ansari GR. Physicochemical characteristics of Vadape Lake of Bhiwandi City, Dist-Thane, Maharashtra, India. Int J Eng Sci Invention. 2021;10(5):47–52.
- Patil PN, Sawant DV, Deshmukh RN. Physico-chemical parameters for testing of water: a review. Int J Environ Sci. 2012;3(3):1194–1207.
- Ruth OK, Johnson MEC. Water quality of Nadimi Lake, Hyderabad, Andhra Pradesh, India. J Aqua Biol. 2013;27(1):48–50.
- Rout C, Sharma A. Assessment of drinking water quality: A case study of Ambala cantonment area, Haryana, India. Int J Environ Sci. 2011;2(2):933–945.
- Reddy VK, Prasad KL, Swamy M, Reddy TR. Physico-chemical parameters of Pakhal lake of Warangal District, Andhra Pradesh, India. J Aqua Biol. 2009;24(1):77–80.


