Assessment of Land use and Land Cover Change in Shallabugh Wetland of Kashmir Himalaya using LANDSAT TM and LISS IV Satellite Datasets
Ishrat Bashir1
 , Farooq A Lone1
, Shafat A Mir1
, Bilal A Beigh3
*
and Ikhlaq A Mir2
, Farooq A Lone1
, Shafat A Mir1
, Bilal A Beigh3
*
and Ikhlaq A Mir2
1
Division of Environmental Sciences,
SKUAST-K,
Shalimar, Srinagar,
Jammu and Kashmir
India
2
Centre for Climate Change and Mountain Agriculture (CCMA),
SKUAST-K,
Shalimar, Srinagar,
Jammu and Kashmir
India
3
Department of Environmental Science and Limnology,
Barkatullah University,
Bhopal,
Madhya Pradesh
India
http://dx.doi.org/10.12944/CWE.17.3.6
Copy the following to cite this article:
Bashir I, Lone F. A, Mir S. A, Beigh B. A, Mir I. A. Assessment of Land use and Land Cover Change in Shallabugh Wetland of Kashmir Himalaya using LANDSAT TM and LISS IV Satellite Datasets. Curr World Environ 2022;17(3). DOI:http://dx.doi.org/10.12944/CWE.17.3.6
Copy the following to cite this URL:
Bashir I, Lone F. A, Mir S. A, Beigh B. A, Mir I. A. Assessment of Land use and Land Cover Change in Shallabugh Wetland of Kashmir Himalaya using LANDSAT TM and LISS IV Satellite Datasets. Curr World Environ 2022;17(3).
Download article (pdf) Citation Manager Publish History

Introduction
The Earth's surface is constantly transforming as a result of numerous factors, many of which are anthropogenic in nature.1 Only a small number of landscapes around the world are still in their natural condition.2 According to the 2019 report of Intergovernmental Panel on Climate Change, anthropogenic utilization has had a direct impact on more than 70% of the world's land surface.3 Changes in land use and land cover (LULC) are rapid, dynamic, and widespread, which in turn have adverse consequences for natural ecosystems on a local, regional, and global scale.4 LULC is an important tool in describing the environment in relation with both natural processes as well as anthropogenic actions.5,6,7,8 LULC change is considered as an important subject matter to study global-change and sustainable development.9,10,11,12,13,14,15 Pollution, degradation, and a catastrophic reduction of wetland ecosystems have resulted from LULC changes in catchment areas during the last five decades. 16,17 Since 1990, approximately 84% of wetlands have undergone ecological change, with 50% of the existing wetlands being lost.18 The LULC changes have a significant impact on the geography of the earth's surface.19 Human beings have been modifying the natural land cover to meet their increasing human needs, viz. economic, social, political, religious, recreation, etc.20
Increased population and allied human activities, particularly deforestation, rapid growth in industries and urbanization, have been found to be the most dominant factors responsible for causing change in LULC.21 Among these factors, increased population growth is thought to be a major factor for causing changes in LULC around the globe.20,22 Rapid population growth causes people to migrate to fragile ecosystems such as wetlands, lakes, and forests, resulting in the expansion of farmland and towns at the expense of natural land cover.20 These changes have a substantial impact on the physical environment as well as the social and economic situations of the people who live there.23
Ecologists throughout the world are concerned about the negative effects of shifting land use, especially when it comes to aquatic ecosystems.24 To address pressing environmental issues such as wetlands destruction, loss of agricultural fields and wildlife habitats, and unregulated development practices, it is necessary to assess LULC changes in the natural environment.18,25 The study of LULC not only involves analyzing the existing LULC changes, but may also be used to predict future changes.26 Therefore, information on existing LULC is essential for a better understanding of landscape dynamics, better decision-making, and implementation of management strategies to meet the ever-increasing demand for human requirements.27,28,29
Most of the studies in the early 1970’s were carried out by using exhaustive ground surveys and through the interpretation of aerial photographs.30 Since the 1970’s, numerous satellite systems have been launched to obtain information on the earth’s resources.31 Over the last five decades,32 remote sensing techniques have become an indispensable tool for mapping, analyzing, and monitoring spatial information about natural resources, particularly aquatic ecosystems. The combination of remote sensing and GIS is an effective and powerful tool for studying the spatial and temporal transformation of land cover, as they provide information in less time, at a lower cost, and with higher precision.33,34,34 Most researchers used satellite data to map land use change because of the multi-temporal availability of satellite imagery and the rapid development of image processing software.35,36,37
Wetlands in the Kashmir Himalayas face a lack of data on their spatial extent and how they have changed over time.38 LULC changes have occurred in the Kashmir Valley during the last five decades as a result of several anthropogenic activities, providing ample opportunity for multiple environmental challenges.39 An unparalleled rate of uncontrolled and unregulated human activities in the watershed of numerous wetlands in the Kashmir Valley has resulted in serious landscape changes.20 The most notable causes, particularly in the last 30 years, have been rapid population expansion, changes in agricultural techniques, expanding urbanization, deforestation, economic growth, and the implementation of developmental projects, among others.18 Many researchers have stated that the increased population has affected forest, farm, built-up, and horticultural areas, with the first two land uses declining while built-up and horticultural areas increasing.40 A comprehensive land use policy must be established to avoid the unsustainable expansion of multiple land uses at the expense of natural land cover. The landscape changes in the Shallabugh wetland ecosystem have not been monitored yet. The water quality and biotic setup of the Shallabugh wetland ecosystem may be affected by changing LULC patterns in the watershed. Shallabugh wetland serves as habitat for fish, waterfowl, and other wildlife species. Hence, the focus of the study is to detect and quantify the LULC change that has occurred in Shallabugh wetland due to various human activities as mapped through LANDSAT TM and LISS IV satellite images from 1990 to 2018.
Study area
The Shallabugh wetland is located in the Ganderbal district at a distance of about 20 km northwest of Srinagar city. The wetland is located at an altitude of about 1580 m amsl and within the geographical coordinates of 34º10' N latitude and 74º42' E longitude (Fig. 1). The wetland is primarily fed by Anchar Lake and numerous tributaries of Sindh and Jhelum River.41 The wetland is an important staging and wintering base for migratory avifauna. More importantly the ecosystem is a breeding area for different species of waterfowl. The waterbody has extensive macrophyte reed beds of Phragmites communis and Typha angustata, abundant growth of Nymphaea sp. in open water areas and mats of Lemna minor in some areas. Willow plantations and paddy fields can be seen in the nearby locations. As a result, the area is extremely important habitat for waterfowl. The widespread changes in LULC patterns due to siltation, agricultural activities, encroachment, grazing, and pollution have resulted in the selection of the Shallabugh wetland for assessment.
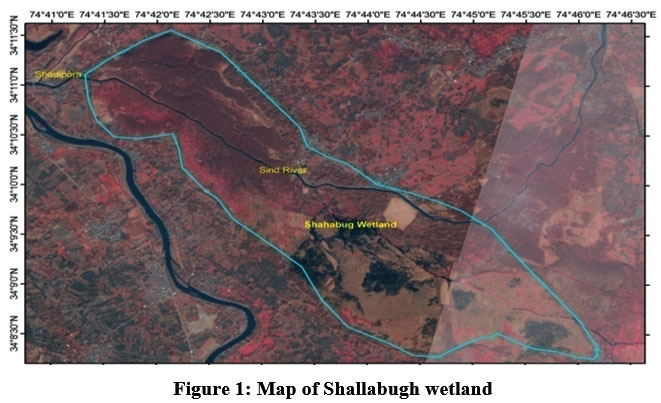 | Figure 1: Map of Shallabugh wetland.
|
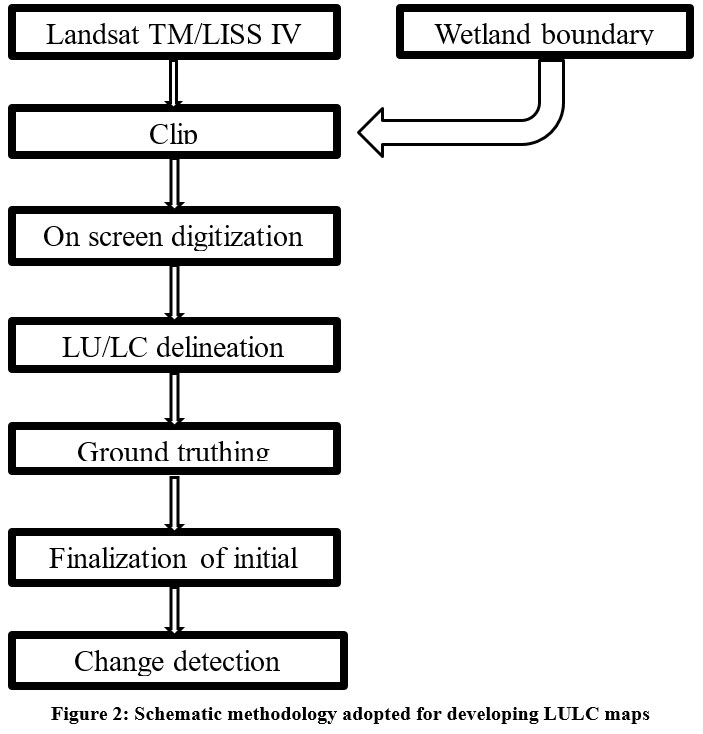
The data and methodology adopted for developing LULC maps
Satellite images are a principal source of data for mapping LULC change detection over time in any geographical area. The use of satellite images from two or more dates is common in remote sensing approaches for studying and measuring LULC changes. For comparison, at least two multispectral satellite images are necessary. LANDSAT TM (15 September 1990) obtained from Earth Explorer and LISS IV (18 October 2018) acquired from NRSC Hyderabad were used to assess LULC changes in the Shallabugh wetland. Images from the autumn season were used, taking into consideration the vegetative attributes of the location, to minimize the effects of the changing seasons and obtain better results. Table 1 lists the specifications of the satellite data used to evaluate landscape dynamics.
When collecting spatial data from several sources, it is necessary for all datasets to overlap accurately. All of the maps must be geo-referenced to the same projection system. In geo-referencing, an uncorrected, raw image from an arbitrary coordinate system is transformed into a map projection coordinate system. Image pixels are positioned and corrected in order to align and fit into real-world map coordinates. The nearest neighborhood technique was used in the re-sampling process. Ground truthing of doubtful areas was done by acquiring field characteristics from several mapped LC classes and relating them to matching image attributes using GPS (global positioning system). After ground truthing and the development of an interpretation key, the images were visually evaluated on screen and the various classes of LULC were demarcated using Arc-GIS software. To map different LULC classes, false colour composite (FCC) images created from selected bands of satellite data were used for onscreen visual interpretation. The percent change for various LULC classes was obtained by the following formula 42:
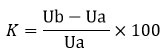
Where K represents the %age of LU change, and Ua and Ub represent the LU types at the start and end of a period, respectively. Positive values specify an increase in LU area, while negative values show a decline in LU area compared to the previous year. Figure 2 depicts the flowchart of the methodology used in this investigation.
Table 1: Spatial data used to assess the LULC change of Shallabugh wetland.
| Data type | Source | Data specifications | Time Period |
LANDSAT TM | Spatial | Earth Explorer | 30 m resolution (Path 149, Row 36 | 15 September 1990 |
LISS IV | Spatial | NRSC Hyderabad | 5.8 m resolution (Path 96, Row 50 | 18 October 2018 |
 | Figure 2: Schematic methodology adopted for developing LULC maps
|
Results
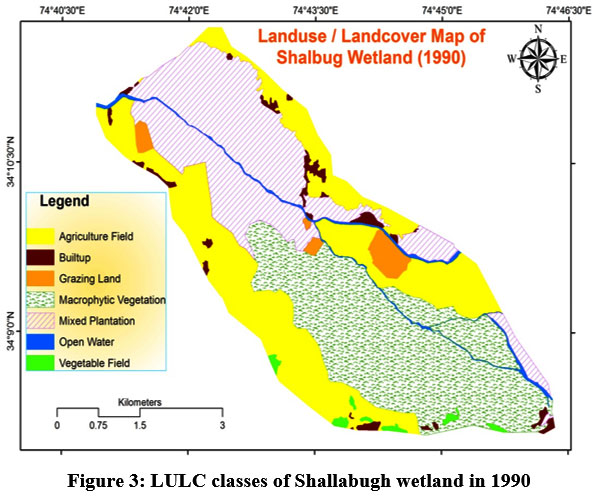
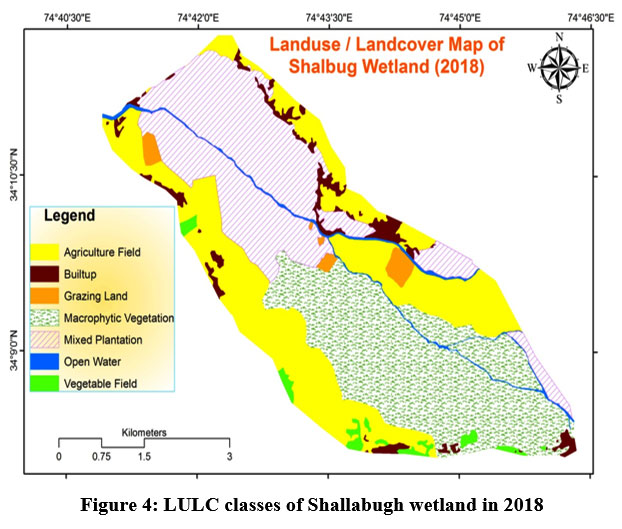
The LULC map depicts the spatial distribution and extent of several LULC categories. Shallabugh wetland has observed considerable LULC changes. The description of the various LULC classes in the study area is illustrated in Figs. 3, 4 and Table 2, respectively. The LULC maps generated for the Shallabugh wetland for two different years (1990 and 2018), with a gap of 28 years, revealed seven different LULC classes viz. macrophytic vegetation, mixed plantation, open water, grazing land, agriculture field, built-up area, and vegetable field. In years 1990 and 2018, the area occupied by macrophytic vegetation was 33.87% and 32.36%, mixed plantation (28.06% and 28.70%), open water (1.84% and 1.65%), grazing land (2.23% and 1.59%), agriculture (31.17% and 30.35%), built-up (2.05% and 3.83%), and vegetable field (0.77% and 1.51%). Throughout all time periods evaluated in the study, macrophytic vegetation has the highest share and vegetable field have the lowest share of all the defined categories of LULC in the study region.
The information contained in the LULC maps derived from LANDSAT TM (1990) and LISS IV (2018) satellite data has shown many variations in the LULC of Shallabugh wetland from 1990 to 2018. The macrophytic vegetation, open water, grazing land, and agriculture field have registered a decline, while mixed plantation, built-up area, and vegetable field have increased. The area of land under macrophytic vegetation has decreased from 864.60 ha in 1990 to 826.08 ha in 2018, a 38.52 ha (4.4%) decrease, while the area of open water has decreased from 47.00 ha in 1990 to 42.17 ha in 2018, a 4.83 ha (10.3%) decrease. The area of grazing land has declined by about 16.34 ha (28.6%) from 1990 to 2018. The results also show that the area of the agriculture field has been reduced from 795.65 ha in 1990 to 774.74 ha in 2018, a 20.91 ha (2.6%) decrease. The mixed plantation has increased from 716.36 ha in 1990 to 732.80 ha in 2018, a 16.44 ha (2.28%) increase. The built-up has increased from 52.42 ha in 1990 to 97.72 ha in 2018, a 45 ha (86.8%) increase, and the vegetable field has increased from 19.76 ha in 1990 to 38.62 ha in 2018, a 18.86 ha (96.1%) increase.
 | Figure 3: LULC classes of Shallabugh wetland in 1990.
|
 | Figure 4: LULC classes of Shallabugh wetland in 2018.
|
Table 2: Area under different LULC classes and the change in the LULC pattern of Shallabugh wetland between 1990 and 2018.
| Area (ha) | Area (%) | Area change | |||
1990 | 2018 | 1990 | 2018 | ha | % | |
Macrophytic vegetation | 864.60 | 826.08 | 33.87 | 32.36 | -38.52 | -4.4 |
Mixed Plantation | 716.36 | 732.80 | 28.06 | 28.70 | +16.44 | +2.28 |
Open water | 47.00 | 42.17 | 1.84 | 1.65 | -4.83 | -10.3 |
Grazing Land | 56.83 | 40.49 | 2.23 | 1.59 | -16.34 | -28.6 |
Agriculture Field | 795.65 | 774.74 | 31.17 | 30.35 | -20.91 | -2.6 |
Built up | 52.42 | 97.72 | 2.05 | 3.83 | +45 | +86.8 |
Vegetable Field | 19.76 | 38.62 | 0.77 | 1.51 | +18.86 | +96.1 |
Discussion
The assessment of the LULC maps of the Shallabugh wetland revealed remarkable changes in almost all the LULC classes during the period from 1990 to 2018. These changes are largely attributed to human activities that drive LULC changes.43 The area under the open water has significantly decreased by 4.83 ha (10.3%) from 1990 to 2018. The main cause behind the decline of the open water area is the nonstop inflow of sediments from Sindh Nallah and its tributaries, which brings an enormous amount of sediments that are deposited directly into the wetland and reduces its water holding capacity.18,44 The macrophytic vegetation area decreased by 38.52 ha (4.4%) due to the transformation into plantation area.20 The depth of the wetland has been reduced considerably, and as such, much of the wetland has been converted into marshland, which has resulted in a decline in macrophytic vegetation cover and open water area. Another significant change observed was a decrease of 20.91 ha (2.2%) in grazing land during the same period. The main reason for the decrease in grazing land was the conversion into agricultural land. A 16.44 ha (2.28%) increase was observed in mixed plantation, which could be attributed to afforestation efforts by the locals and Sind forest division Ganderbal.44
One of the most significant changes observed during the present study includes the expansion of built-up area by 45 ha (86.8%) and vegetable field by 18.86 ha (96.1%) and a decrease of 20.91 ha (2.6%) of agricultural land. The main reason behind the increase in vegetable field and build-up area indicates the conversion of agricultural land and macrophytic vegetation areas.18,44 The agricultural lands are being transformed into buildings as the need for land is increasing day by day for the construction of commercial, residential, and other infrastructural projects at the cost of agricultural land. Several authors have reported the loss of agricultural lands to rapid urbanization.18,44,45,46,47
Conclusion
Land use changes are a common and dynamic occurrence on the earth's surface. Change in one land use cover leads to change in another land cover as well. For administration and land use planning tasks, understanding of land use change is very essential. For LULC analysis, remote sensing and GIS technology are widely used. The present study used LANDSAT TM and LISS IV satellite images and Arc-GIS software to demonstrate the pattern of LULC dynamics in the Shallabugh wetland from 1990 to 2018. The study revealed that the Shallabugh wetland has undergone enormous LULC changes over the last 28 years (last three decades). The built-up area, vegetable field, and mixed plantation area showed significant expansion. On the other hand, a reduction was observed in macrophytic vegetation, open water, grazing land, and agriculture field. The impact of population growth and development activities on land use changes is clearly demonstrated in this study. Any change in land use becomes very critical for the ecological beauty of the Shallabugh wetland as it serves as a habitat for fish, waterfowl, and other wildlife species. Therefore, due attention is needed to the enhancement of the ecological balance of Shallabugh wetland.
Conflict of Interests
All contributing authors declare no conflict of interest.
Funding Sources
The authors declare that no funds, grants, or other support
References
- Chu HJ, Lin YP, Huang YL, Wang YL, (2009) Detecting the land-cover changes induced by large-physical disturbances using landscape metrics, spatial sampling, simulation, and spatial analysis. Sensors. 9(9): 6670-6700.
CrossRef - Ayele G T, Tebeje AK, Demissie SS, Belete M, et al. (2018) Time series land cover mapping and change detection analysis using geographic information system and remote sensing, Northern Ethiopia. Air, Soil and Water Research. 11, 1178622117751603.
CrossRef - IPCC. (2019). IPCC Special Report on Climate Change, Desertification, Land Degradation, Sustainable Land Management, Food Security, and Greenhous gas fluxes in Terrestrial Ecosystems. Summary for Policymakers.
- Lambin EF, Geist HJ. (2006) Land use and land cover change: Local processes and global impacts. Environmental Sciences. 1:1-8.
CrossRef - Jansen LM, di Gregorio A. (2002) Parametric land cover and landuse classification as tools for environmental change detection. Agriculture Ecosystems & Environment. 91: 89–100.
CrossRef - Bender O, Boehmer HJ, Jens D, Schumacher KP. (2005) Using GIS to analyze long-term cultural landscape change in Southern Germany. Landscape and Urban Planning. 70: 111–125
CrossRef - Mendoza ME, Granados EL, Geneletti D, Diego R, Pérez-Salicrup DR, Salinas V. (2011). Analyzing land cover and land use change processes at watershed level: a multitemporal study in the Lake Cuitzeo Watershed, Mexico (1975–2003). Applied Geography. 23(1):237–250.
CrossRef - Fayaz A, Shafiq M, Singh H, Ahmed P. (2020) Assessment of spatiotemporal changes in land use/land cover of North Kashmir Himalayas from 1992 to 2018. Modeling Earth Systems and Environment. 6(2):1189–1200.
CrossRef - Verburg PH, Chen Y, Veldkamp TA. (2000) Spatial explorations of land use change and grain production in China. Agriculture. Ecosystems & Environment. 82: 333–354.
CrossRef - Lambin EF, Geist HJ, Lepers E. (2003) Dynamics of land use and cover change in tropical regions. Annual Review of Environment and Resources. 28: 205–241.
CrossRef - Liu J, Liu M, Tian H, Zhuang D, Zhang Z, Zhang W, Tang X, Deng X. (2005) Spatial and temporal patterns of China’s cropland during 1990–2000: An analysis based on Landsat TM data. Remote Sensing of Environment. 98: 442–456.
CrossRef - Sanneke van Asselen S, Verburg PH. (2013) Land cover change or land-use intensification: simulating land system change with a global-scale land change model. Global Change Biology. 19: 3648–3667.
CrossRef - Gao P, Niu X, Wang B, Zheng Y. (2015) Land use changes and its driving forces in hilly ecological restoration area based on GIS and RS of Northern China. Scientific Reports. 5:11038. DOI: 10.1038/srep11038.
CrossRef - Zomer R, Neufeldt H, Xu J, Ahrends A, Bossio D, Trabucco A, Noordwijk M, Wang M. (2016) Global tree cover and biomass carbon on agricultural land: the contribution of agroforestry to global and national carbon budgets. Scientific Reports. 6. Article no. 29987.
CrossRef - Hu Y, Dong Y, Batunacun. (2018) An automatic approach for land-change detection and land updates based on integrated NDVI timing analysis and the CVAPS method with GEE support. Journal of Photogrammetry and Remote Sensing. 146: 347–359.
CrossRef - Alam A, Rashid SM, Bhat MS, Sheikh AH. (2011) Impact of land use/land cover dynamics on Himalayan wetland ecosystem. Journal of Experimental Sciences. 2(3): 60-64.
CrossRef - Guo M, Li J, Sheng C, Xu J, Wu L. (2017) A review of wetland remote sensing. Sensors. 17(4): 777.
CrossRef - Jamal S, Ahmad WS. (2020) Assessing land use land cover dynamics of wetland ecosystems using Landsat satellite data. SN Applied Sciences. 2: 1891. DOI: 10.1007/s42452-020-03685-z.
CrossRef - Foley JA, DeFries R, Asner GP, Barford C, Bonan G, Carpenter SR, Chapin FS, Coe MT, Daily GC, Gibbs HK, Helkowski JH. (2005) Global consequences of land use. Science. 309(5734): 570-574.
CrossRef - Ganaie TA, Jamal S, Ahmad WS. (2020) Changing land use/land cover patterns and growing human population in Wular catchment of Kashmir Valley, India. GeoJournal. 29: 1-8.
CrossRef - Andualem TG, Belay G, Guadie A. (2018) Land use change detection using remote sensing technology. Journal of Earth Science and Climate Change. 9: 496. DOI: 10.4172/2157-7617.1000496
CrossRef - Mhawish YM, Saba M. (2016) Impact of population growth on land use changes in Wadi Ziqlab of Jordan between 1952 and 2008. International Journal of Applied Sociology. 6(1): 7-14.
- Zubair AO. (2006) Change detection in land use and Land cover using remote sensing data and GIS (A case study of Ilorin and its environs in Kwara State). p-176. Department of Geography, University of Ibadan.www.geospatialworld.net/uploads/thesis/OpeyemiZubair_ThesisDOC.doc.
- Turner MG, Gardner RH, O’neill R.V, O’Neill RV. (2001) Landscape ecology in theory and practice. Springer, New York. DOI 10.1007/978-1-4939-2794-4_1.
- Liu T, Yang, X. (2015) Monitoring land changes in an urban area using satellite imagery, GIS and landscape metrics. Applied Geography. 56: 42-54.
CrossRef - Xiao J, Shen Y, Ge J, Tateishi R, Tang C, Liang Y, Huang Z. (2006) Evaluating urban expansion and land use change in Shijiazhuang, China, by using GIS and remote sensing. Landscape and Urban Planning.75(1–2): 69-80.
CrossRef - Fan F, Weng Q, Wang Y. (2007) Land use land cover change in Guangzhou, China, from 1998 to 2003, based on Landsat TM/ETM+ imagery. Sensors. 7: 1323-1342.
CrossRef - Seif A, Mokarram M. (2012) Change detection of gil playa in the northeast of Fars province Iran. American Journal of Scientific Research. 86: 122-130.
- Arveti N, Etikala B, Dash P. (2016) Land use/land cover analysis based on various comprehensive geospatial data sets: a case study from Tirupati Area, South India. Advances in Remote Sensing. 5(02), 73.
CrossRef - Maktav D, Erbek FS. Jurgens, C. (2005) Remote sensing of urban areas. International Journal of Remote Sensing. 26(4): 655-659.
CrossRef - Rogana J, Chen D. (2004) Remote sensing technology for mapping and monitoring land-cover and land-use change. Progress in Planning. 61: 301-325.
CrossRef - Badreldin, N, Gossens R. (2013) Monitoring land use/land cover change using multi-temporal Landsat satellite images in an arid environment: a case study of El-Arish, Egypt. Arabian Journal of Geosciences. 7: 1671–1681. DOI: 10.1007/s12517-013-0916-3.
CrossRef - Apan AA, Raine SR, Paterson MS. (2002) Mapping and analysis of changes in the riparian landscape structure of Lockyer valley catchment, Queensland, Australia. Landscape and Urban Planning. 59: 43-57.
CrossRef - Sudhira HS, Kumar VS. (2000) Monitoring of lake water quality in Mysore City. International Symposium on Restoration of Lakes and Wetlands: Proceedings of Lake. 1-10.
- Deng JS, Wang K, Hong Y, Qi JG. (2009) Spatio-temporal dynamics and evolution of land use change and landscape pattern in response to rapid urbanization. Landscape and Urban Planning. 92(3-4): 187-198.
CrossRef - Kamp U, Growley BJ, Khattak GU, Owen LA. (2008) GIS Based Landslide Susceptibility Mapping for the 2005 Kashmir Earthquake Region. Geomorphology. 101(4): 631-642.
CrossRef - Dengsheng LA, Guiying LB, Emilio MA. (2013) Spatio-temporal analysis of land-use and land-cover change in the Brazilian Amazon. International Journal of Remote Sensing. 34(16): 5953-5978.
CrossRef - Iqbal MF, Khan IA. (2014) Spatiotemporal land use land cover change analysis and erosion risk mapping of Azad Jammu and Kashmir, Pakistan. The Egyptian Journal of Remote Sensing and Space Sciences. 17(8): 209-229.
CrossRef - Alam A, Bhat MS, Maheen M. (2019) Using Landsat satellite data for assessing the land use and land cover change in Kashmir valley. GeoJournal. 22: 1-5.
CrossRef - Joshi PK, Sarnam S, Shefali A, et al. (2000) Land cover assessment in Jammu & Kashmir using phenology as discriminant, an approach of wide swath satellite (IRS-WiFS). Curr Sci. 81(4): 92–398p.
- Qadri SS. (1989) Ecological factors affecting waterfowl in the wetlands of Kashmir. Ph.D. Thesis, University of Kashmir, Srinagar.
- Mushtaq F,Pandey AC. (2013) Assessment of land use/land cover dynamics vis-à-vis hydrometeorological variability in Wular Lake environs Kashmir Valley, India using multitemporal satellite data. Arabian Journal of Geosciences. 7: 4707-4715. DOI: 10.1007/s12517-013-1092-1.
CrossRef - Lambin EF, Geist HJ, Lepers E. (2003) Dynamics of land use and cover change in tropical regions. Annual Review of Environment and Resources. 28: 205–241.
CrossRef - Singh RK, Singh M, Singh SK, Pal D, Tripathi N, Singh RS. (2018) Land use/land cover change detection analysis using remote sensing and GIS of Dhanbad district, India. Eurasian Journal of Forest Science. 6(2): 1-12.
CrossRef - Kombe WJ, Kreibich V. (2002) Reconciling major threat to the environmental and natural systems of informal and formal land management: An agenda for the region. Other interesting findings touch on an improving tenure security and urban governance in poor countries. Habitat International. 24: 231-240.
CrossRef - Mallupattu PK,Reddy JS. (2013) Analysis of land use/land cover changes using remote sensing data and gis at an urban area, Tirupati, India. The Scientific World Journal. DOI: 10.1155/2013/268623.
CrossRef - Onyango DO, Opiyo SB. (2022) Detection of historical landscape changes in Lake Victoria Basin, Kenya, using remote sensing multi-spectral indices. Watershed Ecology and the Environment. 4: 1-11.
CrossRef


