Climate Change’s Impact on Water Resources, Chak Watershed, Afghanistan
Naqiburahman Rahmani1
*
 , Homayoun Khoshnod2
, Deva Pratap3
and Venkata Reddy Keesara3
, Homayoun Khoshnod2
, Deva Pratap3
and Venkata Reddy Keesara3
1
Faculty of Remote Sensing and GIS,
National Institute of Technology,
Warangal,
Telangana
India
2
Faculty of Hydraulic structure in Integrated Water Resources Management,
Kabul Polytechnic University (KPU),
Kabul,
Afghanistan
3
Department of Civil Engineering, Faculty of Remote Sensing and GIS,
National Institute of Technology,
Warangal,
Telangana
India
http://dx.doi.org/10.12944/CWE.20.3.28
Copy the following to cite this article:
Rahmani N, Khoshnod H, Pratap D, Keesara V. R. Climate Change’s Impact on Water Resources, Chak Watershed, Afghanistan. Curr World Environ 2025;20(3). DOI:http://dx.doi.org/10.12944/CWE.20.3.28
Copy the following to cite this URL:
Rahmani N, Khoshnod H, Pratap D, Keesara V. R. Climate Change’s Impact on Water Resources, Chak Watershed, Afghanistan. Curr World Environ 2025;20(3).
Download article (pdf)
Citation Manager
Publish History

Introduction
The Chak watershed is located in arid and semi-arid area between Latitudes 330 59’ 7’’ to 340 27’ 59’’ and Longitudes 670 37’ 14’’ to 680 65’ 6’’ with an area of 5,831 km2. Topography alpine with steep slopes.
Many regions in the world, including Chak watershed, are prone to floods and droughts and efficient infrastructures, which will mitigate floods with water collection and subsequent water usage during drought seasons, along with the decrease of water in the irrigation season.
In this study area, there are four variations in weather seasons classified in a year: winter season which included from (Dec to Feb), is the rainy season and cold season of the year, spring season which included from (March to May), is variable season summer seasons which included from (June to Sep) it is the wet season or heat season and fall season which included from (Oct to Nov.) months. Global heating up is the most prevailing problem of the world in the last three decades.
South Asia seriously attends to be affected by climate variation impacts because their economy is highly dependent on agriculture. As a result of the quick rise in population, urbanization, hydropower demand, and agriculture, the region's water resources have already been affected. Significant changes are in the global climate cycle of water that causes changes in the regime of precipitation and temperature.
The parameters which are comparing are surface Changeable, such as Temperature, Precipitation, and wind. Geographic Information Systems and (GIS) Remote Sensing (RS) Over the past few decades, have been using as an impressive tool for climate change analyses and adaptation. The major focus of Remote Sensing applications in hydrology includes the estimation of hydro-metrological states ((LULC) land use/land cover, surface temperature, water quality, soil moisture, surface roughness, and snow cover), fluxes such as evapotranspiration that can influence hydrologic processes.
The models generally use mathematical and empirical expressions to define the relationship among the model inputs parameters and output parameters. SWAT is the most widely used model to investigate the problems related to water resources and non-point source pollutions across the globe with various scales and surround conditions.
Soil and water assessment tools are a spatial semi-distributed or continuous and physically established hydrological model,
General Circulation Models (GCMs) and Regional climatic Models (RCMs) are vital for estimating future climatic data based on the RCP scenarios.
From the glacier mountain ranges of the Hindukush to the Drylands of the South, Afghanistan’s ecosystems are not only stunningly beautiful but provide crucial services. Afghanistan watersheds have significant diversity such as a strong factor of formation of fluvial landforms as their active part and river waters are the serious life force for all people of Afghanistan. In Afghanistan, all watersheds, basins, and sub-basins are mostly sourced from the melting of snow and glaciers of the Hindu Kush and Pamir mountains and flowing since steepest gradients towards lowlands. The whole volume of water is estimated to be about 150000 m3 that falls in the mountains.
Materials and Methods
Data that are required to use as inputs to run a model in SWAT are; Geospatial data (DEM, soil data, land use/land cover data) and Climate information (Precipitation, Maximum and Minimum Temperature) that are historic and future data. The methodology used in the research is shown in table 1. According to methodology, spatial data that is required to be collected is the DEM data, Soil data, and Land use/Land cover data of the Chak Watershed and then we could prepare a Slope map from DEM and Soil classes map from soil map by using SWAT in GIS interface. For this area, the climate model data is used and it is obtained from RCM CORDEX – South Asia. The CORDEX data is on a 0.5o pulp for Afghanistan.
The climate data should be clipped and the quantile mapping bias correction method applied by using R scripts. Then observed data that are collected from a rain gauge station that is located in Chak watershed. Geospatial data of Chak watershed that are used in SWAT model setup and HRUs analysis are DEM, Land use/Land cover as well as soil maps. After the setup of the model, the model will run for observed data with SWAT, and the SWAT model will calculate the runoff of the Chak Logar River basin by using observed data of the study area, calibration and validation are done which shows the SWAT model error.
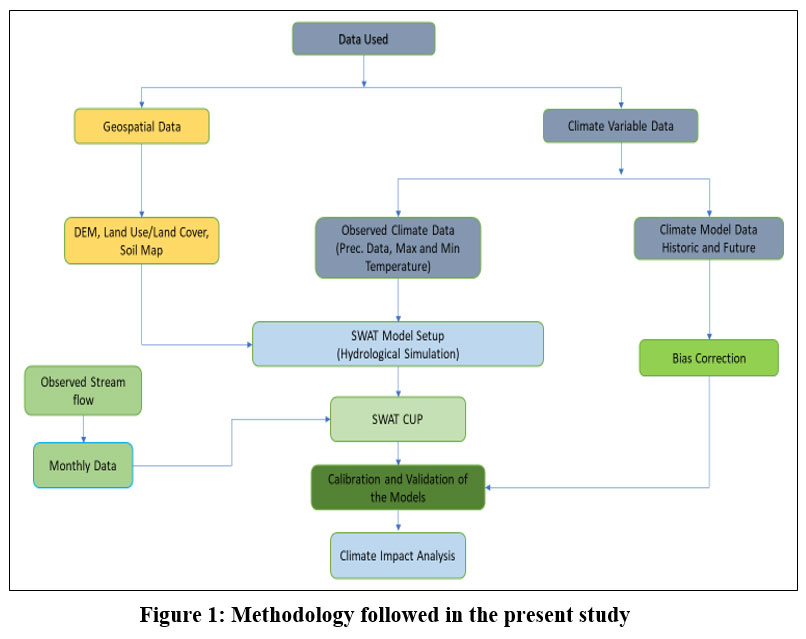 | Figure 1: Methodology followed in the present study
|
Data
The data used for the simulation of the water-related activities in the river basin are accordingly 1. Digital Elevation Model data of 30 m resolution (DEMs), 2. supervised classified Land use/land cover 30 m resolution, 3. Soil data from FAO digital soil map with 1:5,000,000 scale, 4. Weather information for the historical 2006 to 20018 poised from the Ministry of Water and Energy of Afghanistan, 5.The Regional Climate Model (RCM) Combination of CORDEX South Asia, 6. Beijing Climate Centre Climate System Model Version 1.1
Table 1: data Description
Sort | Format | Description | Sources |
DEM | Raster | 30m Resolution | USGS Web sits |
Land use | Raster | 30m Resolution | MAIL/AF |
Weather Data | DBF | Temperature, wind speed, precipitation, solar radiation, and relative humidity | MEW/AF |
Weather Data | DBF | Precipitation, Temperature in 0.250X 0.250Resolution | World Climate Research Program me (WCRP), |
Soil | Raster | Soil FAO 1:5,000,000 scale | FAO-UNESCO |
Observed Discharge | DBF | Monthly Observed Discharge 2006-2018 | MEW/AF |
SWAT model
The hydrological distribution model (SWAT) is selected in this research because the model can delineate watershed from a DEM and further divide it into sub-basins. After creating the sub-basins, the model creates multiple hydrological response units (HRUs) based on the basin's soil category, land use, and terrain conditions.
![]()
In the above equation final storage is represented by St a
The surface runoff is computed by two different methods: one is the Soil Conservation Service (SCS) method and second is Ampt and Green penetration technique, we used the first technique for this research. The equation for explaining the SCS CN2 is followed by the bottom calculation (2).
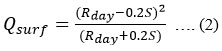
The SCS curve number technique computing the soil’s absorbency, land use and precursor soil water situations as function.
Watershed delineation
ArcGIS platform is used for watershed delineation in this study, and the Digital Elevation Model (DEM) is used to create the drainage for the specific watershed area and represent the opening area on behalf of its threshold assessment. The Chak watershed is manually divided into 14 sub-watersheds. The land cover Land use and soil information are covered so that the rudimentary elements of modeling in the result of the Hydrologic Response Unit, (HRUs) are adapted. This study is described by obtaining completely land-living types and soil category getting (100 Hectare) or further of sub-basins toward an explanation part of that the negligible land-living types and loam category (100 Hectare of a sub-basin) remained 100 % sub-basin areas re-allotted to mainland usages to reproduce HRUs response.
The hydrology response unit parameters in the Chak watershed show different models in future periods with some differences but snow-fall, snow-melt, and precipitation have more than 150 mm increase in the future in Fig. 2.
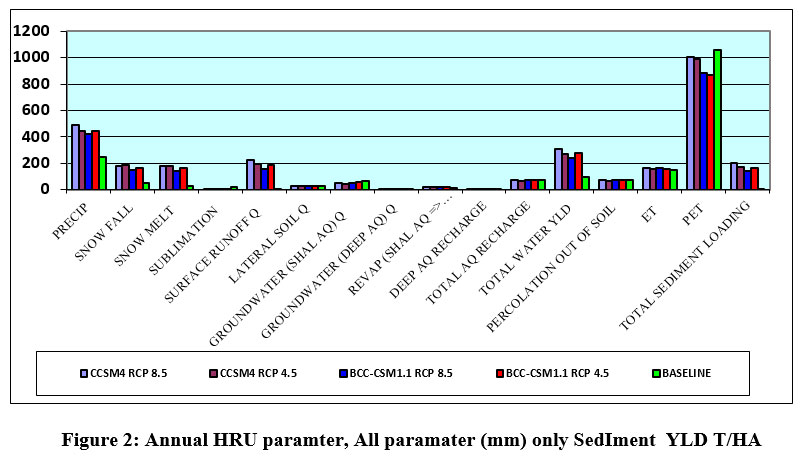 | Figure 2: Annual HRU paramter, All paramater (mm) only SedIment YLD T/HA
|
Calibration and validation
In the amount of skill and metrology, calibration is the assessment of capacity values brought by an expedient below examination with individuals of a calibration regular of known correctness in this procedure, model parameters diverse. Aimed at calibration, validation, and doubt investigation of the SWAT model SWAT-CUP program is used, which SWAT-CUP is open-source software and can be used and copied freely.
The 95PPU calculated at the growing circulation of a production variable that was achieved from the Latin Hypercube Sampling technique by 2.5% and 97.5% levels and not allowing 5% of bad simulations.
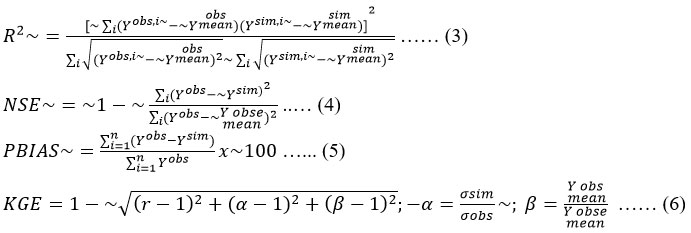
Where the observed data is shown by Yobs
The SWAT distribution model was performed by applying the predefined parameters and after that considered for calibration by applying the SUFI-2 equation. The organized (HRU) numbers and sub-basins were 12 and 150, corresponding.
Several iterations have been made to complete the simulated result with the observed information. SWAT-CUP offers several different functions. Table 1 shows the primary and last interval of the calibration parameters; the final interval was used accordingly in the validation phase without changes. Upon leaving the study area, the measuring station was used for flow calibration. In the 9-year record, the 2007-2015 period was considered to be the calibration period, and the 2016-2018 period was considered for monthly validation. The trend line for the graph among the observed and simulated competent correlation monthly flow value displays, in Table 2 all sensitivities estimate the average of the variations resulting from the variations of each parameter.
Table 2: SWAT fitted parameters and their descriptions
Name of Parameter | Explanation | fitting value | Disparity methods |
GW_DELAY | Ground postponement time | 47.265003 | Add |
GW_REVAP | Groundwater Revap coefficient | 0.086690 | Replacement |
EPCO | Plant uptake recompense factor. | 0.958500 | Multiply |
ALPHA_BF | Bae flow alpha factor | 0.767500 | Replacement |
GWQMN | Threshold depth of water in the shallow aquifer for return flow to occur | -485.000000 | Add |
TLAPS | Temperature lapse rate | -6.297750 | Replacement |
IPET | potential evaporation equation | 2.000000 | Replacement |
TIMP | Snow pack and temperature lag factor | 0.107500 | Replacement |
ESCO | Soil evaporation compensation factor | 0.958500 | Multiply |
SMTMP | Snow melts base temperature | 3.485000 | Replacement |
CN2 | SCS runoff curve number | -0.072500 | Multiply |
SOL_AWC | Available water capacity | 0.041050 | Multiply |
SMFMN | Minimum snowmelt rate during a year | 1.231250 | Replacement |
SMFMX | Maximum melt rate for snow during the year | 2.071250 | Replacement |
SFTMP | Snowfall temperature | -3.935000 | Replacement |
In table 2 all sensitivities estimate the average of the variations resulting from the variations of each parameter in the objective function, while all the parameters are changing and this will give a relative sensitivity based on the linear approximation. The state t provides a measure of sensitivity, which means that a more sensitive value has a high absolute value. The P values define the meaning of sensitivity, it means that the meaning of values close to zero is more than others. Figure 3 shows the sensitivity analysis of the Chak basin.
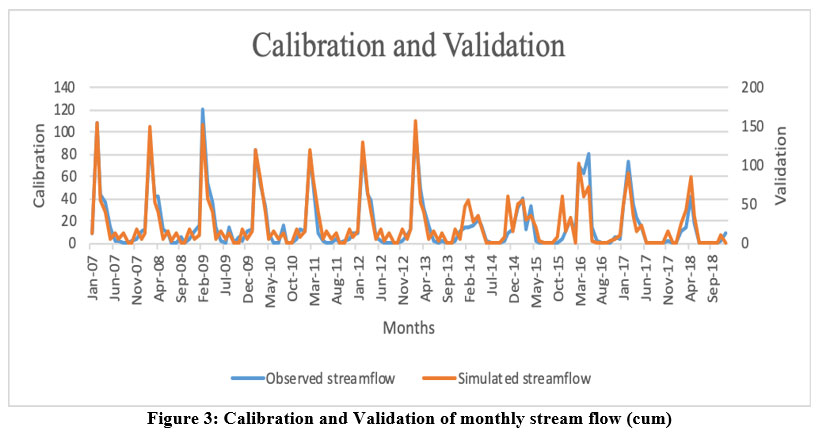 | Figure 3: Calibration and Validation of monthly stream flow (cum).
|
Figure 3. Shows that monthly stream-flow variation in calibration and validation period of times for both Observed and Simulated values, in which the calibration period from Jan 2007 to Dec 2015 and the Validation period from Jan 2016 to Dec 2018.
The hydrograph and geometric pointers during validation and calibration are given into Table 3, Correspondence. That can be view the model of SWAT consistently underestimating peak flows in calibration while overestimating them in validation. The elevated validation estimates might reflect the possibility that water infiltrating deeply into the aquifer was excluded from the model simulation. The following table provides calibration and validation statistics comparing average monthly simulated and gauged flows.
Table 3: Average monthly simulated and gauged flow calibration and validation statistics
Statistical Parameters | KGE | NSE | R2 | PBIAS |
Calibration Period | 0.56 | 0.59 | 0.87 | -2 |
Validation Period | 0.40 | 0.76 | 0.93 | 1.8 |
To assess climate change, the analysis of the long-term trend (29 years) of variables such as (flow-flow, precipitation and temperature) was performed by applying the Mann-Kendall adapted location test and the orientation range was measured, using Sen's pending evaluator.
Sensitivity analysis
This analysis was taken a historical period of time for 12 years and available parameters for that period are 15. These subtle parameters were measured for model calibration.
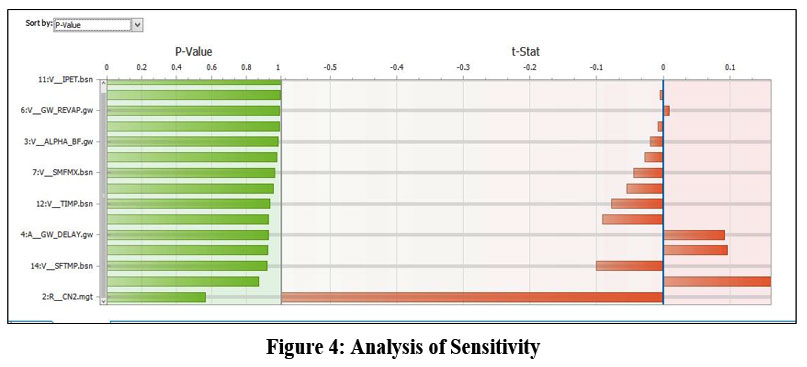 | Figure 4: Analysis of Sensitivity
|
Results
Temperature analysis
The maximum and minimum temperature variation as shown in Figures below as 1.80C to 2.20C
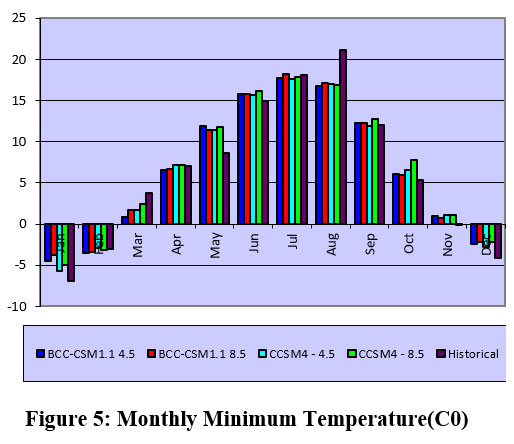 | Figure 5: Monthly Minimum Temperature(C0)
|
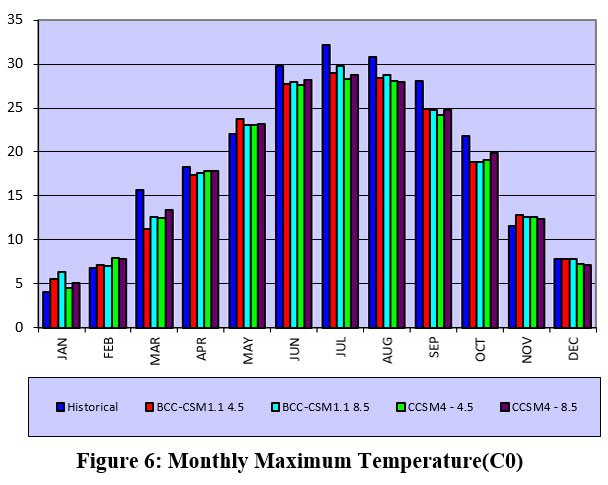 | Figure 6: Monthly Maximum Temperature(C0)
|
The maximum and minimum temperature variation as shown in Figure. 5 and Figure. 6.as 1.80C to 2.20C The RCM (2022–2050) linear trend of the monthly temperature, stream-flow, and rainfall for RCP 4.5 and RCP 8.5 states, correspondingly with reference toward baseline period, the yearly average temperature increased by 2.20 C established on RCP 4.5 and RCP 8.5 states, respectively. For that the baseline period (2007–2018) and RCM (2022–2050) RCP 4.5 and RCP 8.5 scenario. The model evaluation for simulated monthly climate data output of baseline (2006–2018) and future data BCC-CSM1.1 and CCSM4 models (2022–2050) remained used to route the model. The maximum yearly temperature is 320C in the baseline period and the maximum annual temperature in the future is predicted as 29.80C in July, the minimum annual temperature in the baseline model is -4.40C, and modeled minimum annual temperature in the future is predicted -6.80C in January.
Precipitation analysis
By the end of March melting of the snow starts and the rainy season is coming, it can be observed in (RCP) models shown in Figure. 7.
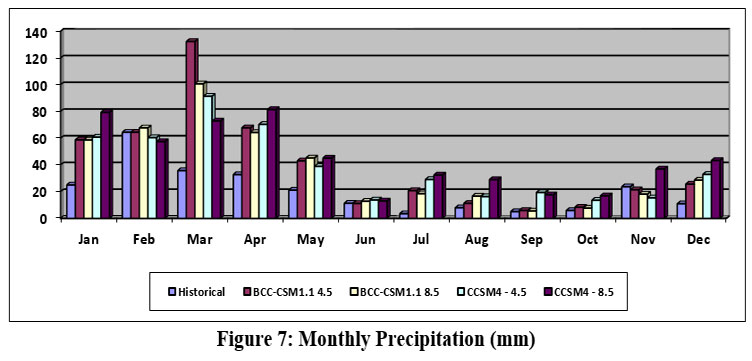 | Figure 7: Monthly Precipitation (mm)
|
The amount of precipitation in the baseline period increased in both scenarios from 50 mm to 138 mm in Mar, Apr, May, and July, also the amount of precipitation in Feb is decreased due to the geographic location of the Chak watershed located in the snow region. by the end of March melting of the snow starts and the rainy season is coming, it can be observed in (RCP) models shown in fig.7.
Stream flow analysis
The stream-flow increases from Feb to Jun as 50 cum to 200 cum shown in Figure. 8.
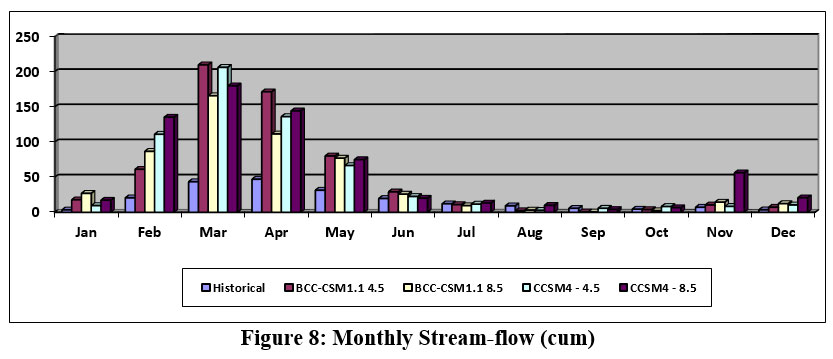 | Figure 8: Monthly Stream-flow (cum)
|
Long-term variations in monthly stream flow are observed. the stream-flow increases from Feb to Jun as 50 cum to 200 cum shown in Figure. 8 It is all because after Feb, the warm season starts, and snow melts slowly, the snow effect the water balance and stream-flow, in the same time the rainy season is observed in Chak watershed area.
By the seasonal analysis for the Chak watershed, repesents in the Figure. 9, Figure. 10, Figure. 11 and Figure12 shows the precipitation as below.
.jpg) | Figure 9: Seasonal precipitation (mm)
|
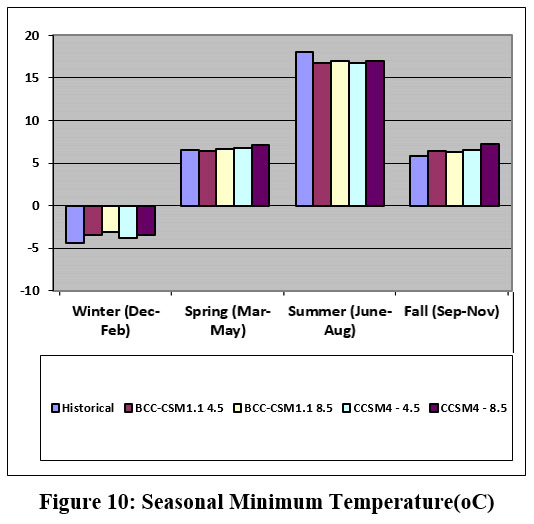 | Figure 10: Seasonal Minimum Temperature(oC)
|
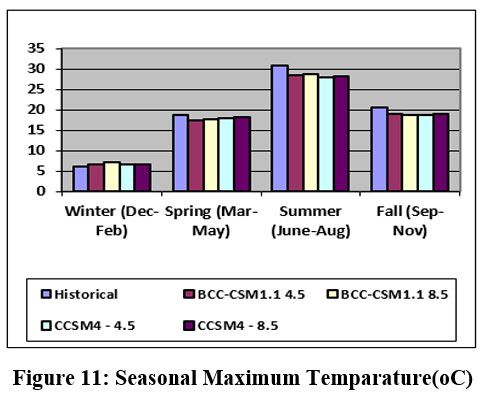 | Figure 11 Seasonal Maximum Temparature(oC)
|
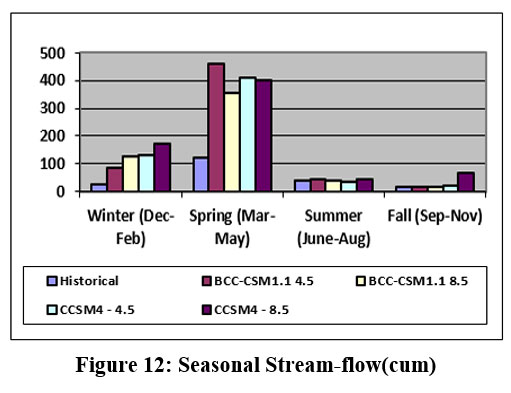 | Figure 12: Seasonal Stream-flow(cum)
|
By the seasonal analysis for the Chak watershed, Figure. 9. represents the precipitation in winter and spring seasons are the rainiest, different models predicted the different values, but all show that precipitation is increasing in the upcoming associated with the baseline historical period. The Figure. 10. shows the minimum Temperature in the winter season is the minimum for all four models predicting that it is decreasing from -4.4oC to -6.8 oC. The Figure. 11. represents the maximum temperature in the summer season is maximum in the Chak watershed area and the maximum temperature is 32 oC predicted by models. Figure. 12.shows the seasonally stream-flow variations, which the spring season is the have more stream-flow, 461cum.
Conclusions
The results from the model show that there is an increase in stream flow in Chak water shed, the precipitation was found to be increasing at the rate of 50 mm to 200 mm monthly per period 2022-2050 from both (RCP 4.5 and RCP 8.5) scenarios, as the amount of precipitation in the baseline period increased in both scenarios from 50 mm to 138 mm in Mar, Apr, May, and July, also the amount of precipitation in Feb is decreased due to the geographic location of the Chak watershed located in the snow region, so by the end of March snow melting starts and the rainy season is coming. Forecast to be a reduction in the average yearly temperature of 2.7 °C, and a growth in the average monthly stream flow of 48.1cum to 150 cum from 2022 to 2050 under both (RCP 4.5 and RCP 8.5) scenarios. The Modeling outcomes show that these will principal to substantial changes in the basin's water balance and hydrological regime.
Due to the climate change impact, snow melt contributes to an increase in annual discharge of up to 91 % at the outlet of the basin and it will help to make floods, degradation of agricultural lands, in some cases losses of irrigation constructions and it will also help to destruct water main infrastructures and facilities located along in the Chak watershed.
As for the current literatures in Kabul River basin this is the first research using the SWAT model for the prediction of stream-flows under climate change scenarios in the Chak watershed. The impact on agriculture production, irrigation and urban society is very much required for understanding the effect of global climate variation on the hydrological effect of the mentioned area.
Acknowledgment
The authors would like to thank the Government of India for providing the opportunity to do this work under the Indian Council for Cultural Relations (ICCR) scholarship program, the Ministry of Energy and Water, and the Ministry of Agriculture, Irrigation and Livestock of the Islamic Republic of Afghanistan for providing field data. The author also would like to thank Prof. Raghavan Srinivasan, Director of Spatial Sciences Laboratory, AgriLife Research, Texas A&M University, College Station, USA, and Prof. Venkataramana Sridhar, Department of Biological Systems Engineering, Virginia Polytechnic Institute and State University, Blacksburg, USA for their constant support and encouragement.
Funding Sources
The author(s) received no financial support for the research, authorship, and/or publication of this article.
Conflict of Interest
The authors do not have any conflicts of interest.
Data Availability Statement
The datasets generated and/or analyzed during this study are publicly available. These data can be accessed freely at online site.
Ethics Statement
This research did not involve human participants, animal subjects, or any material that requires ethical approval.
Informed Consent Statement
This study did not involve human participants, and therefore, informed consent was not required.
Permission to reproduce material from other sources:
Not Applicable
Author Contributions
Naqiburahman RAHMANI: Conceptualization, Methodology, Writing Original Draft. Data Collection, Analysis.
Homayoun khoshnod: Writing – Review & Editing.
Deva PRATAP: Visualization, Supervision, Project Administration.
Venkata Reddy KEESARA: Visualization, Supervision.
References
- Ummah MS. Harirud River Basin. Sustainability (Switzerland). 2019;11(1):1-14. http://scioteca.caf.com/bitstream/handle/ 123456789/1091/RED2017-Eng-8ene.pdf?sequence=12&isAllowed=y%0A http://dx.doi.org/10.1016/j.regsciurbeco. 2008.06.005%0Ahttps://www.researchgate.net/publication/305320484 _SISTEM_PEMBETUNGAN_TERPUSAT_STRATEGI_MELESTARI
- Amu T, Basin D. THE AFGHAN PART OF AMU DARYA BASIN Impact of Irrigation in Northern Afghanistan on Water Use in the Amu Darya Basin Coordinator of the Emergency Irrigation Rehabilitation Project of the Ministry of Energy and Water of Afghanistan, FAO Kabul.
- Tani H, Tayfur G. Modelling Rainfall-Runoff Process of Kabul River Basin in Afghanistan Using ArcSWAT Model. Journal of Civil Engineering and Construction. 2023;12(1):1-18. doi:10.32732/jcec.2023.12.1.1
CrossRef - Sediqi MN, Komori D. Assessing Water Resource Sustainability in the Kabul River Basin: A Standardized Runoff Index and Reliability, Resilience, and Vulnerability Framework Approach. Sustainability (Switzerland). 2024;16(1). doi:10.3390/su16010246
CrossRef - AFGHANISTAN CLIMATE RISK COUNTRY PROFILE.; 2021. www.worldbank.org
- Bahrawi JA, Elhag M, Aldhebiani AY, Galal HK, Hegazy AK, Alghailani E. Soil Erosion Estimation Using Remote Sensing Techniques in Wadi Yalamlam Basin, Saudi Arabia. Advances in Materials Science and Engineering. 2016;2016. doi:10.1155/2016/9585962
CrossRef - Zhao F, Wu Y, Qiu L, Sun Y, Sun L, Li Q, et al. Parameter uncertainty analysis of the SWAT model in a mountain-loess transitional watershed on the Chinese Loess Plateau. Water (Switzerland). 2018;10(6). doi:10.3390/w10060690
CrossRef - Wiedmann T, Lenzen M, Keyßer LT, Steinberger JK. Scientists’ warning on affluence. Nat Commun. 2020;11(1). doi:10.1038/s41467-020-16941-y
CrossRef - Zhou P, Ge Y, Jiang Y, Xie Y, Si Z, Yang H, et al. Assessment of Soil Erosion by the RUSLE Model Using Remote Sensing and GIS: A Case Study of Jilin Province of China. Published online 2020. doi:10.20944/preprints202011.0435.v1
CrossRef - Probst E, Mauser W. Climate Change Impacts on Water Resources in the Danube River Basin: A Hydrological Modelling Study Using EURO-CORDEX Climate Scenarios. Water (Switzerland). 2023;15(1). doi:10.3390/w15010008
CrossRef - Maqsoom A, Aslam B, Hassan U, Kazmi ZA, Sodangi M, Tufail RF, et al. Geospatial assessment of soil erosion intensity and sediment yield using the Revised Universal Soil Loss Equation (RUSLE) model. ISPRS Int J Geoinf. 2020;9(6). doi:10.3390/ijgi9060356
CrossRef - Yuksel A, Gundogan R, Akay AE. Using the remote sensing and GIS technology for erosion risk mapping of Kartalkaya Dam watershed in Kahramanmaras, Turkey. Sensors. 2008;8(8):4851-4865. doi:10.3390/s8084851
CrossRef - Suresh Kumar •, Kalambukattu JG. Modeling and Monitoring Soil Erosion by Water Using Remote Sensing Satellite Data and GIS.; 2022.
CrossRef - YUKSEL Aladdin EARM. Using The Wepp Model to Predict Sediment yield. Published online 2001.
- Mearns LO, Gutowski W, Jones R, Leung R, Mcginnis S, Nunes A, et al. A regional climate change assessment program for North America. Eos (Washington DC). 2009;90(36):311. doi:10.1029/2009EO360002
CrossRef - Murtinho F. What facilitates adaptation? An analysis of community-based adaptation to environmental change in the Andes. Int J Commons. 2016;10(1):119-141. doi:10.18352/ijc.585
CrossRef - King M, Sturtewagen B. Making the Most of Afghanistan’s River Basins Opportunities for Regional Cooperation. www.ewi.info
- Nepal S. Impacts of climate change on the hydrological regime of the Koshi river basin in the Himalayan region. Journal of Hydro-Environment Research. 2016;10:76-89. doi:10.1016/j.jher.2015.12.001
CrossRef - Dile YT, Daggupati P, George C, Srinivasan R, Arnold J. Introducing a new open source GIS user interface for the SWAT model. Environmental Modelling and Software. 2016;85:129-138. doi:10.1016/j.envsoft.2016.08.004
CrossRef - Ayivi F, Jha MK. Estimation of water balance and water yield in the Reedy Fork-Buffalo Creek Watershed in North Carolina using SWAT. International Soil and Water Conservation Research. 2018;6(3):203-213. doi:10.1016/j.iswcr.2018.03.007
CrossRef - Akhtar M, Ahmad N, Booij MJ. The impact of climate change on the water resources of Hindukush-Karakorum-Himalaya region under different glacier coverage scenarios. J Hydrol (Amst). 2008;355(1-4):148-163. doi:10.1016/j.jhydrol.2008.03.015
CrossRef - Thilakarathne M, Sridhar V. Characterization of future drought conditions in the Lower Mekong River Basin. Weather Clim Extrem. 2017;17:47-58. doi:10.1016/j.wace.2017.07.004
CrossRef - Mor JR, Ruhí A, Tornés E, Valcárcel H, Muñoz I, Sabater S. Dam regulation and riverine food-web structure in a Mediterranean river. Science of the Total Environment. 2018;625:301-310. doi:10.1016/j.scitotenv.2017.12.296
CrossRef - Bajracharya AR, Bajracharya SR, Shrestha AB, Maharjan SB. Climate change impact assessment on the hydrological regime of the Kaligandaki Basin, Nepal. Science of the Total Environment. 2018;625:837-848. doi:10.1016/j.scitotenv.2017.12.332
CrossRef - Jha M, Pan Z, Tackle ES, Gu R. Impacts of climate change on streamflow in the Upper Mississippi River Basin: A regional climate model perspective. Journal of Geophysical Research D: Atmospheres. 2004;109(9). doi:10.1029/2003JD003686
CrossRef - Monowar Kamal G, Field Coordinator A. SUPPORTED BY SDC WATERSHED ATLAS OF AFGHANISTAN IST EDITION-WORKING DOCUMENT FOR PLANNERS Raphy Favre, Watershed Consultant TABLE OF CONTENT.; 2004.
- AFGHANISTAN CLIMATE RISK COUNTRY PROFILE.; 2021.
- Sridhar V, Kang H, Ali SA. Human-induced alterations to land use and climate and their responses for hydrology and water management in the Mekong River Basin. Water (Switzerland). 2019;11(6). doi:10.3390/w11061307
CrossRef - Abbaspour KC, Yang J, Maximov I, Siber R, Bogner K, Mieleitner J, et al. Modelling hydrology and water quality in the pre-alpine/alpine Thur watershed using SWAT. J Hydrol (Amst). 2007;333(2-4):413-430. doi:10.1016/j.jhydrol.2006.09.014
CrossRef - AFGHANISTAN CLIMATE RISK COUNTRY PROFILE.; 2021. www.worldbank.org
- Hernegran R, Norstedts Tryckeri G. Transboundary Water Management as an International Public Good Ministry for Foreign Affairs Ministry for Foreign Affairs of Sweden.; 2001.
- Kang H, Sridhar V. Combined statistical and spatially distributed hydrological model for evaluating future drought indices in Virginia. J Hydrol Reg Stud. 2017;12:253-272. doi:10.1016/j.ejrh.2017.06.003
CrossRef - Arnold JG, Moriasi DN, Gassman PW, Abbaspour KC, White MJ, Srinivasan R, et al. SWAT: MODEL USE, CALIBRATION, AND VALIDATION. Trans ASABE. 55(4):1491-1508. http://swatmodel.tamu.edu
CrossRef - Solomon S (Atmospheric chemist), Intergovernmental Panel on Climate Change., Intergovernmental Panel on Climate Change. Working Group I. Climate Change 2007: The Physical Science Basis: Contribution of Working Group I to the Fourth Assessment Report of the Intergovernmental Panel on Climate Change. Cambridge University Press; 2007.
- Juniati AT, Sutjiningsih D, Soeryantono H, Kusratmoko E. Proposing water balance method for water availability estimation in Indonesian regional spatial planning. In: IOP Conference Series: Earth and Environmental Science. Vol 106. Institute of Physics Publishing; 2018. doi:10.1088/1755-1315/106/1/012073
CrossRef - Dile YT, Daggupati P, George C, Srinivasan R, Arnold J. Introducing a new open source GIS user interface for the SWAT model. Environmental Modelling and Software. 2016;85:129-138. doi:10.1016/j.envsoft.2016.08.004
CrossRef - Hussainzada W, Lee HS. Hydrological modelling for water resource management in a semi-arid mountainous region using the soil and water assessment tool: A case study in northern Afghanistan. Hydrology. 2021;8(1):1-21. doi:10.3390/hydrology8010016
CrossRef - Arnold JG, Moriasi DN, Gassman PW, Abbaspour KC, White MJ, Srinivasan R, et al. SWAT: MODEL USE, CALIBRATION, AND VALIDATION. Trans ASABE. 55(4):1491-1508. http://swatmodel.tamu.edu
CrossRef - Zhao F, Wu Y, Qiu L, Sun Y, Sun L, Li Q, et al. Parameter uncertainty analysis of the SWAT model in a mountain-loess transitional watershed on the Chinese Loess Plateau. Water (Switzerland). 2018;10(6). doi:10.3390/w10060690
CrossRef - Farooq M, Shafique M, Khattak MS. Flood hazard assessment and mapping of River Swat using HEC-RAS 2D model and high-resolution 12-m TanDEM-X DEM (WorldDEM). Natural Hazards. 2019;97(2):477-492. doi:10.1007/s11069-019-03638-9
CrossRef - Gassman PW, Reyes MR, Green CH, Arnold JG, Gassman PW. THE SOIL AND WATER ASSESSMENT TOOL: HISTORICAL DEVELOPMENT, APPLICATIONS, AND FUTURE RESEARCH DIRECTIONS Invited Review Series. Trans ASABE. 2007;50(4):1211-1250.
CrossRef - Tani H, Tayfur G. Modelling Rainfall-Runoff Process of Kabul River Basin in Afghanistan Using ArcSWAT Model. Journal of Civil Engineering and Construction. 2023;12(1):1-18. doi:10.32732/jcec.2023.12.1.1
CrossRef


