Comparative Analysis of Fluoride Removal Using Activated Carbon Derived from three plant Sources: Adsorption Modelling, Regeneration and Environmental implication
Neilanuo Huozha
 , NikiliK Zhimo
and Daniel Kibami
*
, NikiliK Zhimo
and Daniel Kibami
*
1
Department of Chemistry,
Kohima Science College, Nagaland University,
Nagaland
India
http://dx.doi.org/10.12944/CWE.20.3.27
Copy the following to cite this article:
Huozha N, Zhimo N, Kibami D. Comparative Analysis of Fluoride Removal Using Activated Carbon Derived from three plant Sources: Adsorption Modelling, Regeneration and Environmental implication. Curr World Environ 2025;20(3). DOI:http://dx.doi.org/10.12944/CWE.20.3.27
Copy the following to cite this URL:
Huozha N, Zhimo N, Kibami D. Comparative Analysis of Fluoride Removal Using Activated Carbon Derived from three plant Sources: Adsorption Modelling, Regeneration and Environmental implication. Curr World Environ 2025;20(3).
Download article (pdf)
Citation Manager
Publish History

Introduction
Fluoride contamination: A global environmental and health concern
Fluoride, a naturally occurring element in the Earth's crust, is globally distributed unevenly in groundwater, and both its deficiency and excess in drinking water present significant health concerns. Humans are exposed to fluoride mainly in two ways; systemically, through drinking water, eating various foods, taking fluoride supplements and topically, through the use of dental products like toothpaste, mouth rinses, foams, and varnishes. Both forms of exposure work together to support dental health, helps to maintain strong teeth while preventing decay.1 Numerous epidemiologic investigations indicate that drinking water represents the most significant means for human exposure to fluoride. Its presence in water can result from natural geological processes or, in some cases, from the deliberate addition of fluoridating compounds such as salts.2 At low concentrations (0.5–1.0 mg/L), fluoride is beneficial for dental health.3,4 however, prolonged intake of fluoride-rich water leads to serious health problems. Dental fluorosis is the earliest and most common effect, followed by skeletal fluorosis and possible damage to organs such as the kidneys, thyroid, and liver.5-7 Globally, an estimated 179–200 million people are exposed to fluoride levels exceeding safe limits, highlighting the need for effective defluoridation methods.4 Millions of people worldwide suffer from fluoride contamination. This situation underscores the urgent need for effective, accessible, and sustainable defluoridation technologies. Several methods have been developed to address this widespread issue. These include precipitation,8 membrane processes,9 reverse osmosis,10 ion exchange,11 coagulation,12 and adsorption.13 Although methods such as reverse osmosis and ion exchange are effective, their high cost, energy demand, and maintenance requirements limit their use in rural and resource-limited areas.14 Adsorption has emerged as a viable and promising option since it is easy to use and has low design and operating costs. Researchers have studied the effectiveness of different adsorbents in removing fluoride from drinking water. A wide range of adsorbents has been explored, including natural materials,15-17 agricultural by-products.18 Clay-based options,19 and industrial or mineral-based adsorbents,20-25 have shown good potential in removing fluoride. Biomass-derived activated carbons are particularly attractive because they are renewable, inexpensive, and rich in surface functional groups such as –OH, –COOH, and –NH2 that enhance pollutant uptake.26, 27 However, most studies focus on single biomass sources, and direct comparative evaluations under identical preparation and operating conditions remain limited. In this study, Yam (Colocasia esculenta), Crofton weed (Ageratina adenophora), and Squash (Sechium edule) were selected due to their local availability, low economic value, and contrasting ecological characteristics. Yam and squash generate substantial agricultural residues, while Crofton weed is an invasive species posing environmental challenges. Converting these biomasses into activated carbon enables waste valorisation while addressing water contamination. Their distinct lignocellulosic compositions are also expected to influence pore development and surface chemistry during phosphoric acid activation, justifying their comparative assessment. Recent studies reported significant advances in fluoride removal using modified and biomass-derived activated carbons. Activated carbon supported with metal oxides such as Ce–Al composites, exhibit enhanced fluoride affinity through surface complexation and electrostatic interactions.28 Similarly, surface oxidation using nitric acid or hydrogen peroxide increases oxygen-containing functional groups, leading to improved adsorption efficiency.29 Despite the high capacities achieved by engineered composites, recent reviews highlight the continued need for simple, low-cost, and locally available biomass-based adsorbents for sustainable defluoridation, especially in rural and resource-limited areas.30, 31 Accordingly, this work aims to systematically compare phosphoric-acid-activated carbons derived from the three plant sources for fluoride removal. Adsorption performance is evaluated using equilibrium, kinetic, and regeneration studies, and practical applicability is verified using natural water samples to support the selection of efficient and sustainable biosorbents for defluoridation
Materials and Methods
Materials and chemicals
The stems, leaves, and peels of Yam (Colocasia esculenta), Squash (Sechium edule), and the stems and leaves of Crofton weed (Ageratina adenophora) were collected locally from Jotsoma village, Kohima district, Nagaland, India (25°39'40'' N, 94°04'49'' E). The collected biomass was thoroughly washed with tap water to remove dirt and adhering impurities, followed by repeated rinsing with distilled water. The samples were sun-dried for 2–3 days and subsequently oven-dried at 60 °C for 24 hours.
All chemicals used were of analytical grade. Sodium fluoride (NaF) was used for the preparation of synthetic fluoride solutions, phosphoric acid (0.1 M) served as the chemical activating agent, and hydrochloric acid (0.1 M) and sodium hydroxide (0.1 M) were used for pH adjustment. All reagents were obtained from Merck, and distilled water was used throughout the experiments for washing, dilution, and preparation of stock solutions to ensure consistency
Preparation of activated carbon (AC) Adsorbents
The preparation of activated carbon was carried out in two successive stages: carbonization of the raw biomass and chemical activation. Phosphoric acid was selected as the activating agent due to its effectiveness in promoting pore development and enhancing surface functionality. The presence of H3PO4 facilitates biomass decomposition and structural rearrangement, resulting in the formation of micro and mesopores while introducing oxygen-containing functional groups that enhance fluoride affinity. The dried biomass was carbonized at 450 °C for 3 hours in a muffle furnace. The resulting char was crushed, sieved to a particle size of 106 µm, and chemically activated by impregnation in 0.1 M H3PO4 at a biomass-to-acid ratio of 1:3 (w/v). The mixture was agitated at room temperature for 24 hours to ensure uniform penetration of the activating agent. After impregnation, the samples were washed repeatedly with deionized water until near-neutral pH (6–7), oven-dried at 80 °C, and stored in airtight containers. The prepared activated carbons were designated as YPAC (Yam plant activated carbon), CWAC (Crofton weed activated carbon), and SPAC (Squash plant activated carbon). Product yield was calculated based on the ratio of activated carbon obtained to the initial biomass weight:
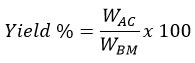
Where; WAC
Material characterization of activated carbon (AC)
The physicochemical properties of SPAC, CWAC, and YPAC were characterized using standard analytical techniques. Proximate analysis was performed following the ASTM D1762-84 method. Carbon, hydrogen, and nitrogen contents were determined using a CHN analyser (2400 Series II, PerkinElmer, USA). Specific surface area and pore characteristics were measured by the Brunauer–Emmett–Teller (BET) method using a Quantachrome ASiQ0000-4 instrument. Surface morphology was examined using scanning electron microscopy (JSM-6390LV, JEOL, Japan), while surface functional groups were identified by Fourier-transform infrared (FTIR) spectroscopy (Spectrum 100 and Frontier IR, PerkinElmer). Residual fluoride concentrations were measured using an ion-selective electrode (Orion 4 Star pH/ISE meter, Thermo Scientific). The point of zero charge (pHZPC) of each activated carbon was determined by the batch equilibrium method as reported by Babic.32
Adsorbate preparation
A fluoride stock solution of 1000 mg/L concentration was prepared by dissolving 2.178 g of sodium fluoride (NaF, Merck Company) in deionised water and making up the volume to 1 litre using a volumetric flask. This stock solution was then diluted to prepare intermediate concentrations of 100 mg/L fluoride solutions. From the 100 mg/ L solution, a series of fluoride solution ranging from 1 to 10 mg/L were subsequently prepared by appropriate dilution.
Adsorption equilibrium studies
To identify the optimal conditions for the removal of fluoride pollutants, batch adsorption experiments were conducted. An initial adsorbent dosage of 0.5 g was chosen as the starting point for the experiment. Unless otherwise stated, all adsorption experiments were carried out in 250 mL of fluoride solution in Erlenmeyer flasks agitated at 165 rpm. Adsorbent dosage was varied from 0.1 to 1.0 g while keeping the initial fluoride concentration, solution pH, and contact time constant. Contact time studies were performed over 5 min–24 hours at an adsorbent dosage of 1 g, using optimised fluoride concentrations of 4 mg/L for YPAC and 2 mg/L for CWAC and SPAC, with solution pH maintained at 2 for YPAC and CWAC and 3 for SPAC. The effect of initial fluoride concentration was examined in the range of 1–10 mg/L at a fixed adsorbent dosage of 0.5 g and a contact time of 24 hours, without pH adjustment. The influence of solution pH was evaluated between pH 2 and 10 at an adsorbent dosage of 1 g and a contact time of 24 hours. All adsorption experiments were conducted in triplicate, and average values were reported. The percentage of fluoride removal and adsorption capacity (qe) was obtained using the equations below:
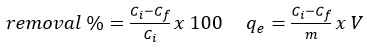
Where; Ci = initial fluoride concentration (mg/L), Cf= final fluoride concentration (mg/L), qe = adsorption capacity (mg/g), V = volume of the solution (L), m = mass of the adsorbent (g).
The present study also focuses on identifying the most appropriate equilibrium isotherm models to describe the adsorption of fluoride from aqueous solutions using the three different activated carbons. To evaluate the adsorption mechanism and surface interactions, widely employed isotherm models such as Langmuir, Freundlich and Temkin were applied to fit the equilibrium data. In addition, the adsorption kinetics were analysed using the pseudo-first-order, pseudo-second-order and Intraparticle diffusion models to determine the rate-controlling steps and assess the adsorption behaviour of the three activated carbons.
Regeneration studies
Regeneration experiments were conducted to evaluate the reusability of YPAC, CWAC, and SPAC. After adsorption, the spent adsorbent was separated by filtration and washed with distilled water to remove loosely bound fluoride. Desorption was performed by treating the adsorbent with 0.1 M NaOH solution at a solid-to-liquid ratio of 1 g per 250 mL and agitating for 2 hours at room temperature. Following desorption, the adsorbent was filtered, repeatedly washed with distilled water until neutral pH was achieved, oven-dried at 80 °C, and reused for subsequent adsorption cycles. Regeneration efficiency was evaluated over five consecutive cycles under identical experimental conditions.
Error analysis
To find the best adsorption isotherm and kinetic model that match the experimental data, two error analysis methods i.e., Chi-square test (X2)33 and Root Mean Square Error (RMSE) were employed.34 X2 and RMSE were calculated using the equation;
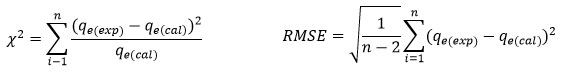
Where; qe(exp) and qe(cal) are the equilibrium capacity(mg/g) experimental and calculated values, n represents the number of observations. A smaller X2 value indicates that the model data closely match the experimental results, while a larger X2 suggests greater deviation between them, similarly smaller RMSE values indicate better curve fitting.
Results
Characterisation of YPAC, CWAC, and SPAC
Table 1: Physiochemical properties of YPAC, CWAC, SPAC
Proximate Analysis | |||||||||
Yield (%) | Activated Carbon | ratio | Moisture content (%) | Volatile matter content (%) | Ash content (%) | Matter soluble in water (%) | Matter soluble in acid (%) | Fixed Carbon (%) | Iodine number (mg/g) |
35.558 | YPAC | 1:3 | 2.188 | 13.486 | 1.503 | 1.9 | 1.818 | 79.105 | 876.337 |
30.246 | CWAC | 1:3 | 2.687 | 13.901 | 2.436 | 2.5 | 2.330 | 76.146 | 801.504 |
28.899 | SPAC | 1:3 | 3.271 | 13.971 | 2.621 | 3.2 | 2.872 | 74.065 | 728.846 |
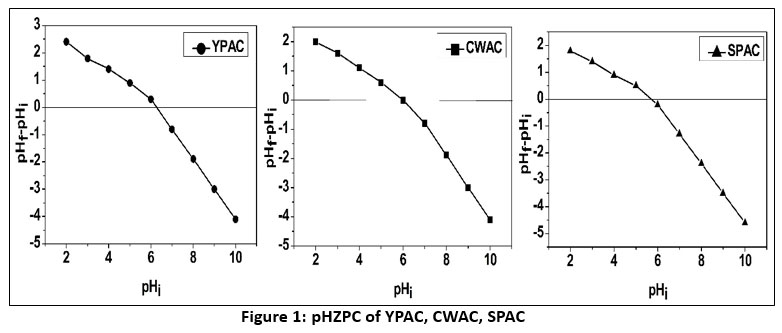
Table 2: Elemental Analysis and BET Surface Characteristics of YPAC, CWAC and SPAC
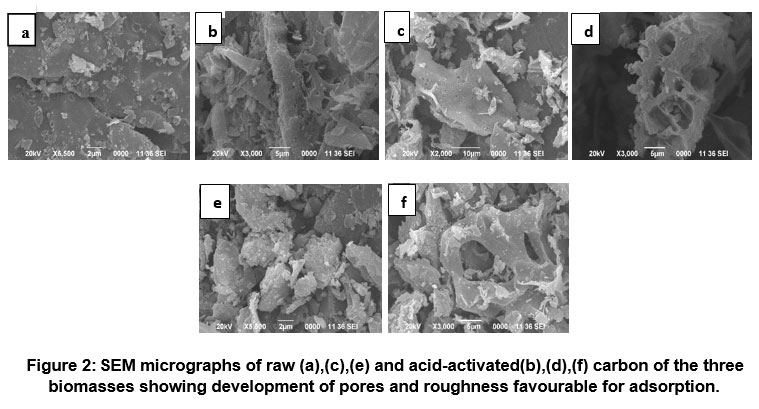 | Figure 2: SEM micrographs of raw (a),(c),(e) and acid-activated(b),(d),(f) carbon of the three biomasses showing development of pores and roughness favourable for adsorption.
|
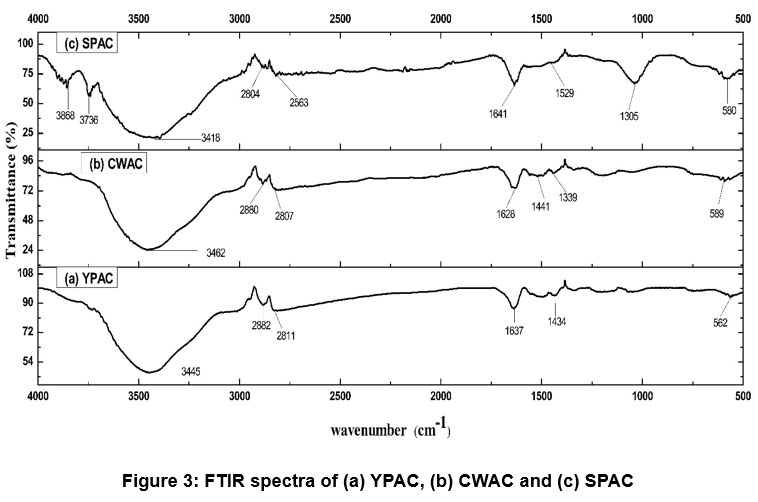 | Figure 3: FTIR spectra of (a) YPAC, (b) CWAC and (c) SPAC
|
Batch adsorption studies
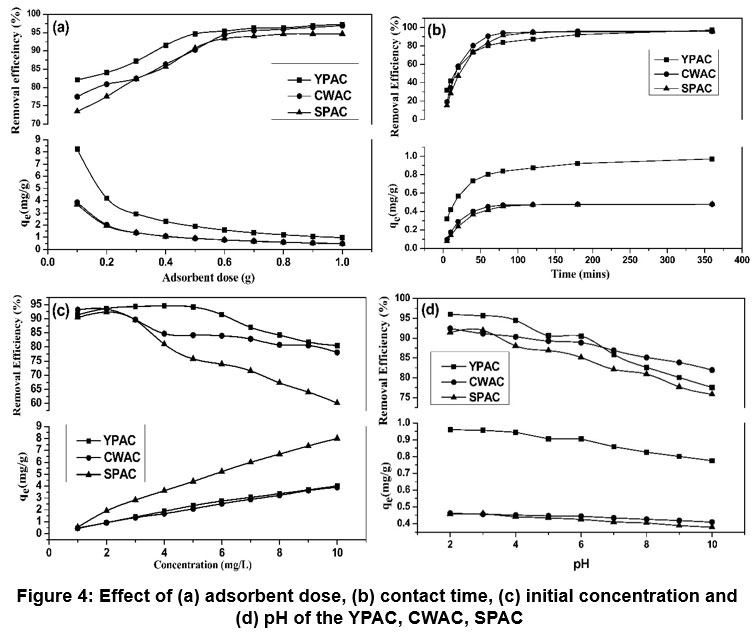 | Figure 4: Effect of (a) adsorbent dose, (b) contact time, (c) initial concentration and (d) pH of the YPAC, CWAC, SPAC
|
Isotherm studies
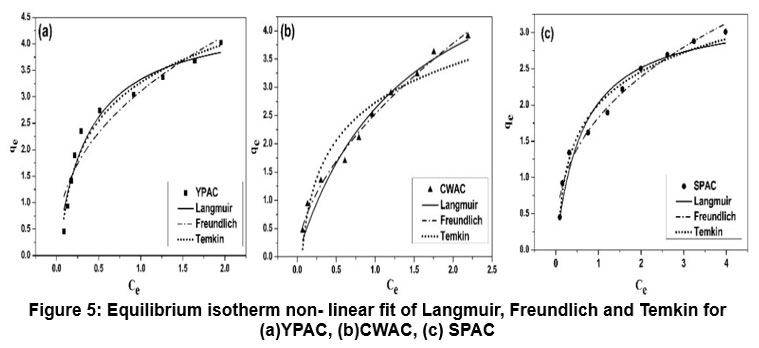 | Figure 5: Equilibrium isotherm non- linear fit of Langmuir, Freundlich and Temkin for (a) YPAC, (b) CWAC, (c) SPAC
|
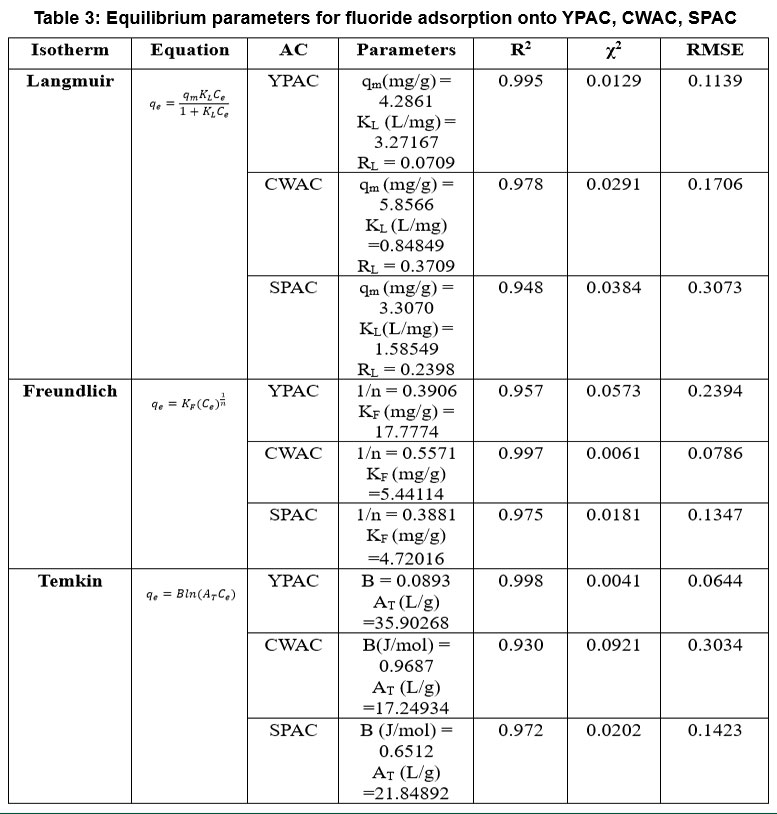 | Table 3: Equilibrium parameters for fluoride adsorption onto YPAC, CWAC, SPAC
|
Adsorption Kinetics
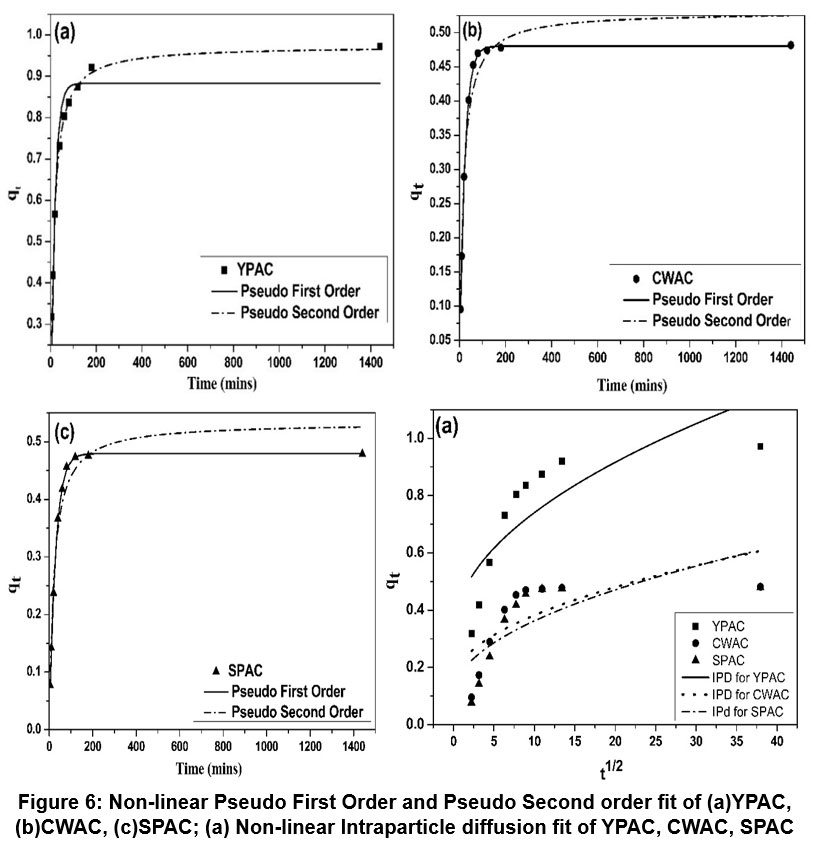 | Figure 6: Non-linear Pseudo First Order and Pseudo Second order fit of (a) YPAC, (b) CWAC, (c) SPAC; (a) Non-linear Intraparticle diffusion fit of YPAC, CWAC, SPAC
|
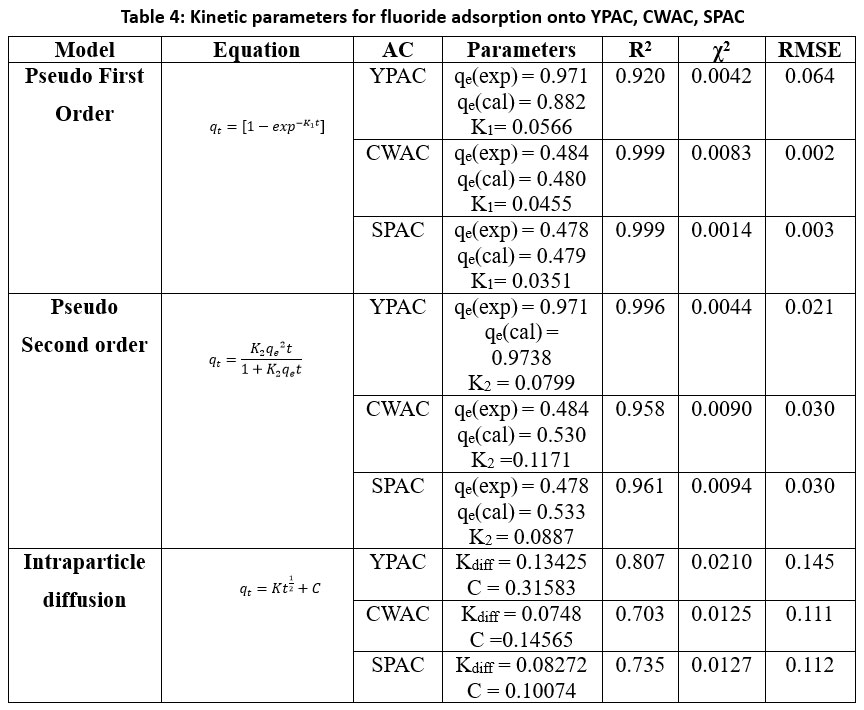 | Table 4: Kinetic parameters for fluoride adsorption onto YPAC, CWAC, SPAC
|
Regeneration studies
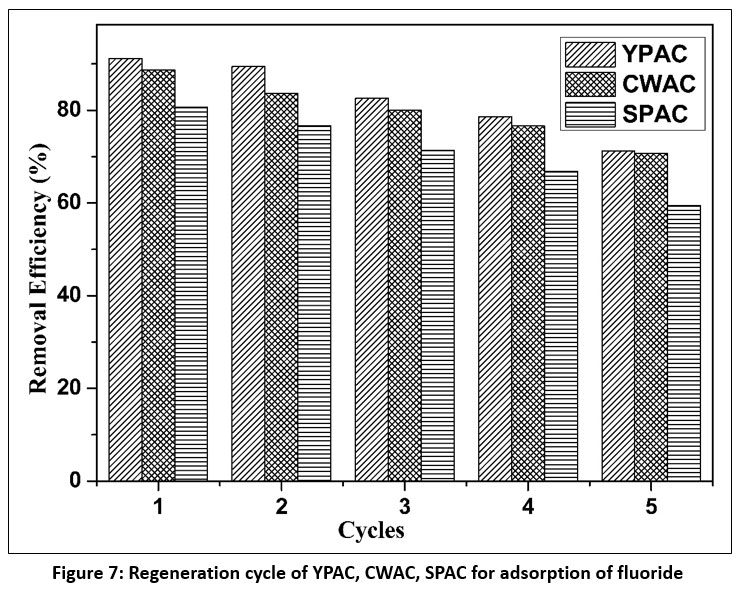 | Figure 7: Regeneration cycle of YPAC, CWAC, SPAC for adsorption of fluoride
|
Feasibility and implication with natural-water system
Table 5: Physiochemical properties and initial fluoride concentration of the water samples.
Sample no | pH | EC | TDS | Salinity | Fluoride |
1 | 6.9 | 19 | 12.35 | 14.25 | 3.29 |
2 | 5.6 | 39.6 | 25.70 | 29.70 | 3.89 |
3 | 5.8 | 20.6 | 13.39 | 15.45 | 4.29 |
4 | 6.8 | 4.45 | 2.89 | 3.33 | 4.50 |
5 | 7.1 | 5.55 | 3.60 | 4.16 | 4.81 |
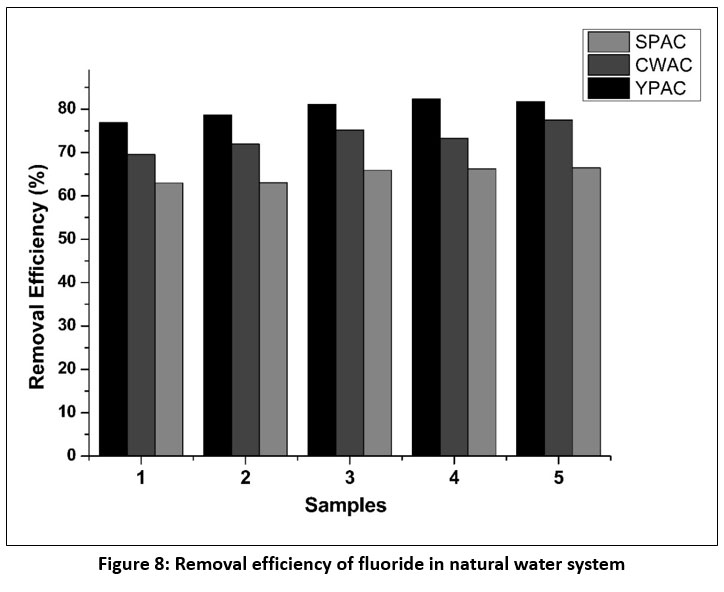 | Figure 8: Removal efficiency of fluoride in natural water system
|
Discussion
Influence of physicochemical properties on fluoride adsorption.
Proximate analysis serves as a key tool for evaluating the characteristics of carbonaceous materials and allows differentiation among activated carbons produced from different biomass sources.35The three activated carbons were synthesized at a consistent activation temperature of 450°C using a range of impregnation ratios from 1:1 to 1:5. Among these, the 1:3 impregnation ratio yielded the most favourable results in terms of yield and physicochemical properties, and therefore, only data from the 1:3 ratio are presented and discussed in the study Table 1. YPAC consistently demonstrates superior properties, including the highest carbon yield (35.56%), indicating efficient conversion of raw material, alongside very low ash (1.50%) and moisture (2.18%) content, signifying a purer product, which is a key consideration for activated carbon quality.36 Its substantial fixed carbon content 79.10% further underscores its efficient carbonization. Additionally, the relatively low water- and acid-soluble matter, particularly noted in YPAC, implies a strong resistance to leaching and chemical degradation in aqueous and acidic environments,37 while the higher iodine number (876.34 mg/g) indicates superior micropore development and enhanced adsorption potential, as the iodine number directly correlates with the activated carbon's surface area and adsorption capabilities.38, 39 CWAC, though lower in yield (30.25%), maintains relatively low moisture (2.69%) and ash (2.44%) contents, with fixed carbon at (76.15%) and an iodine number of (801.50 mg/g), demonstrating balanced performance with good adsorption potential despite slightly higher solubility values.40 SPAC has the lowest yield (28.90%) and higher moisture (3.27%) and ash (2.62%) contents, along with fixed carbon at (74.07%) and the lowest iodine number (728.85 mg/g), reflecting comparatively lesser but still adequate adsorption capabilities. All activated carbon samples exhibited consistently modest volatile matter values, suggesting a uniform and effective volatilization process during activation.41 The pHZPC values for the phosphoric-acid-activated carbons were around 6.3 for YPAC, 6.0 for CWAC, and 5.8 for SPAC Figure 2. It shows a balanced mix of acidic and basic functional groups on the carbon surfaces, which is common with phosphoric acid activation. This method adds oxygen-containing acidic groups while retaining some basic sites from the original biomass structure. When the solution pH is below 6.0, the adsorbent surfaces acquire net positive charges due to protonation reactions. This creates conditions that favour fluoride anion binding. When the pH rises above 6.0, surface deprotonation results in negative charges that repel fluoride ions.42
Table 2 delves into the detailed characterization of the three activated carbon samples, through elemental analysis and surface area measurements using the Brunauer-Emmett-Teller method, which are critical for understanding their adsorptive capabilities. Elemental analysis, specifically CHN content, provides insights into the purity and carbonaceous nature of the materials, while BET surface area and total pore volume quantify the porous structure essential for adsorption processes.43 Notably, SPAC, despite displaying the highest carbon content at (78.4%), exhibits the least BET surface area (731.46 m²/g) and overall pore volume (0.391 cm³/g), indicating a less developed porous structure then the other two. The observation highlights that while higher carbon content generally correlates with increased activation, it does not singularly guarantee superior porosity, underscoring the critical role of activation conditions.44 Conversely, YPAC, with a slightly lower carbon content of (76.0%), demonstrates the most extensive porosity, reflected in its superior surface area (884.44 m²/g) and pore volume (0.561 cm³/g). This indicates better activation and pore development in YPAC, which is crucial for creating robust pore networks.45 CWAC presents intermediate values for both carbon content and textural properties. Furthermore, variations in hydrogen and nitrogen content across the samples imply subtle differences in surface chemistry and potential interaction sites, which can significantly affect adsorption and reactivity.46,47
SEM analysis provides visual evidence of the physical changes induced by the phosphoric acid activation process. Even though they all use the same activating agent, the inherent differences in the raw plant structures will lead to distinct final activated carbon morphologies. Initially, the unactivated samples of all the three Figure 2(a, c, e) biomass types exhibit smooth, dense, compact surfaces with limited porosity. Following activation, Yam Figure 2(b) displays a highly porous and fragmented surface with well-defined pores and cracks, indicating significant pore development. Crofton weed’s activated carbon Figure 2(d) demonstrates a significant increase in porosity, with large interconnected channels and an open structure that notably enhances surface accessibility. Squash’s activated carbon Figure 2(f), similarly, shows a more open and porous texture with clearly visible voids and surface roughness, signifying improved surface area.48,49 These morphological developments highlight how phosphoric acid effectively enhances pore formation across diverse biomass sources, thereby enhancing their textural properties and potential for adsorption and catalytic applications.50 Yam develops the most organized pore structure, suggesting the activation process worked best for it, while Crofton weed and Squash also undergo beneficial structural changes essential for their performance.
FTIR spectrum Figure 3 shows the presence of the different surface functional groups. All three materials exhibit significant hydroxyl (O–H) stretching vibrations, typically around 3400 cm-1 , and C–H stretching in aliphatic chains, indicating the presence of carbon-hydrogen bonds.51 Olefinic and aromatic C=C vibrations, commonly observed around 1600 cm-1 and 1400-1500 cm-1 respectively, confirm the carbonaceous framework. Notably, SPAC also shows C–O stretching at 1035 cm-1, suggesting alcohols, ethers, or esters, while YPAC and CWAC display similar oxygen-containing groups in varying intensities.52
Effect of operational parameters on fluoride removal
Batch experiments results demonstrate that adsorbent dosage, initial concentration, pH, and contact time collectively influence fluoride removal, with YPAC consistently showing superior performance compared to CWAC and SPAC under all conditions Figure 4. Increasing the adsorbent dose from 0.1 to 1.0 g led to higher removal percentages, peaking at 97.2% for YPAC, followed by CWAC and SPAC with 96.9% and 94.7%, this strong improvement is attributed to more adsorption sites and larger surface area. However, adsorption capacity per gram decreased due to oversaturation of active sites.53 The studies revealed that the majority of fluoride uptake occurred within the first 60 minutes, after which the rate slowed, suggesting rapid occupation of active sites followed by equilibrium, aligning with diffusion -controlled adsorption behaviour. As initial fluoride concentration increased (1–10 mg/L), adsorption capacity (qe) rose due to greater mass transfer driving force, but removal efficiency declined slightly, likely due to site saturation.54 pH significantly affected fluoride removal, with optimal performance observed in acidic to near-neutral conditions (pH 3–6), where YPAC reached 96% removal, CWAC 92% and SPAC 91% removal, because of the attraction between fluoride ions and the positively charged adsorbent surface.13 At higher pH, decreased removal efficiency was likely due to increased repulsion as the adsorbent surface acquired a more negative charge.
Adsorption equilibrium behavior and isotherm interpretation
Non-linear Langmuir, Freundlich, and Temkin models Figure 5 were used to analyse the equilibrium adsorption data, with the key parameters summarized in Table 3. For YPAC, Langmuir model provided the best fit (R² = 0.995, x² = 0.0129, RMSE = 0.1139), with RL value of 0.0710 confirming that fluoride adsorption occurs favourably as a monolayer on homogeneous sites. In contrast, CWAC showed the best correlation with the Freundlich model (R² = 0.997, x² = 0.0061, RMSE = 0.0786), indicating heterogeneous multilayer adsorption, SPAC also fitted well to Freundlich model (R² = 0.975, x² = 0.0181, RMSE = 0.1347). The Temkin model yielded the highest fit for YPAC (R² = 0.998, x² = 0.0041, RMSE = 0.0644), reflecting a uniform distribution of adsorption energies, whereas CWAC showed the weakest fit (R² = 0.930, x² = 0.0921). The results demonstrate that YPAC favours Langmuir-type monolayer adsorption, CWAC follows Freundlich multilayer behaviour and SPAC leaned toward Freundlich-type behaviour with some Temkin agreement, reflecting that surface uniformity and site heterogeneity played key roles in governing their adsorption performances.55-58 Separation factor RL was calculated using the equation;
Kinetic behavior and adsorption mechanism
Pseudo-first-order, Pseudo-second-order, and Intraparticle diffusion models Figure 6 were used to analysed the adsorption kinetics of fluoride onto YPAC, CWAC, and SPAC, with summarized key parameters in Table 4. To assess the suitability of each kinetic models, the correlation coefficients R², x², and RMSE values were compared and the model with R² closest to unity and the lowest error values was selected. For YPAC, the pseudo-second-order model (R² = 0.996, x² = 0.0044, RMSE = 0.021) was found to be the best fit, as the calculated qe(cal) (0.974 mg/g) closely matched the experimental qe(exp) (0.971 mg/g), confirming that fluoride adsorption occurs predominantly via chemisorption. In contrast, CWAC and SPAC were best described by the PFO model, with very high correlation coefficients (R² = 0.999 for both), low x² (0.0083 and 0.0014, respectively), and minimal RMSE values (0.002 and 0.003), demonstrating that the adsorption process on these carbons is mainly controlled by physisorption. Although intraparticle diffusion contributed to the adsorption mechanism, its lower R² values (0.703–0.807) indicate that it was not the sole rate-limiting step.59-61
Regeneration performance and reusability assessment
The regeneration performance of YPAC, CWAC, and SPAC was evaluated to determine their reusability and long-term applicability for fluoride removal. Figure 7. illustrates the variation in fluoride removal efficiency over successive adsorption–desorption cycles.
All the three activated carbons exhibited a gradual decline in fluoride removal efficiency with increasing regeneration cycles, indicating progressive loss of adsorption capacity upon repeated reuse. In the first cycle, YPAC showed the highest removal efficiency (91.18%), followed by CWAC (88.70%) and SPAC (80.65%). A consistent decrease was observed in subsequent cycles, with YPAC maintaining comparatively higher efficiency throughout the study, followed by CWAC and SPAC. By the fifth cycle, fluoride removal efficiencies had declined to 71.22% for YPAC, 70.65% for CWAC, and 59.45% for SPAC. The reusability of the activated carbons beyond the fifth regeneration cycle becomes less favourable, likely due to a reduction in effective surface area. This reduction in adsorption performance may be attributed to incomplete desorption of fluoride ions, resulting in blockage of active sites, as well as possible alterations in surface functional groups during repeated alkaline regeneration cycles. Similar declines in adsorption efficiency have been reported in earlier studies, where pore obstruction and structural degradation limited the accessibility of adsorption sites.62,63,13 Despite the gradual decrease in performance, all three adsorbents retained appreciable fluoride removal capacity over multiple cycles, highlighting their potential for sustainable and cost-effective fluoride remediation applications.
Practical applicability in natural water systems
Natural water samples were collected from various locations in and around Dimapur region using airtight containers and were analysed within 48 hours to ensure sample integrity. Initial measurements of total dissolved solids (TDS), electrical conductivity (EC), salinity, and fluoride concentration were analysed for the samples using calibrated meters (Microprocessor COND-TDS-SAL Meter) and a fluoride ion-selective electrode (ISE) summarized in Table 5. Fluoride removal was investigated using five independently collected natural water samples with fluoride concentrations ranging from 3.8 to 4.2 mg/L in order to assess the consistency and practical relevance of the adsorption process. All experiments were conducted at the natural pH of the water, using a fixed adsorbent dose of 1g and a contact time of 24 hours, with each condition performed in triplicate to ensure reproducibility. As shown in Figure 8, all activated carbon materials exhibited stable fluoride removal across the different natural water samples. Among the three adsorbents, YPAC achieved the highest removal efficiencies (76.92–82.34%), followed by CWAC (69.51–77.49%) and SPAC (62.96–66.47%). The persistence of this trend across multiple water matrices suggests that fluoride uptake is largely governed by the intrinsic surface properties of the activated carbons rather than by sample specific variations in water chemistry. Only minor variations in removal efficiency were observed between samples, indicating that the adsorption process remained effective despite natural differences in water composition. Within the investigated conditions, sensitivity to location specific variations was limited, and the presence of commonly occurring background ions did not appear to significantly hinder fluoride adsorption. Conducting the experiments without pH adjustment enhances the environmental relevance of the findings and reflects conditions likely to be encountered in practical treatment scenarios. Overall, the use of multiple natural water samples strengthens confidence in the reproducibility of the results and supports the applicability of the investigated activated carbons for fluoride removal from diverse natural water sources
Adsorption mechanism
To understand how fluoride interacts with the phosphoric acid activated carbons prepared from Colocasia esculenta (Yam), Ageratina adenophora (Crofton weed) and Sechium edule (Squash), it is essential to consider their surface chemistry and textural properties, which together control the adsorption mechanism. The high BET surface areas and well-developed pore structures of the activated carbons provide abundant accessible adsorption sites and diffusion pathways for fluoride ions, as confirmed by SEM observations. FTIR spectra reveal the presence of oxygen-containing functional groups such as –OH, C=O, and C–O on all three carbons, which play a key role in fluoride uptake through hydrogen bonding and electrostatic interactions, as reported in similar biomass-derived activated carbon systems.52,46 Surface charge effects further influence the adsorption process, as reflected by the pHZPC values of 6.3 for YPAC, 6.0 for CWAC, and 5.8 for SPAC. At solution pH values below the respective pHZPC, protonation of surface functional groups results in positively charged adsorbent surfaces, which enhances electrostatic attraction toward negatively charged fluoride ions. As the pH increases beyond the pHZPC, surface deprotonation leads to electrostatic repulsion, resulting in reduced fluoride adsorption. This pH dependent behaviour is consistent with previously reported fluoride adsorption mechanisms on activated carbons.13,2 Kinetic analysis provides further insight into the nature of adsorption. Fluoride adsorption onto YPAC follows the pseudo-second-order model, indicating that chemisorption involving stronger surface fluoride interactions dominate the uptake process. In contrast, CWAC and SPAC follow pseudo-first-order kinetics, suggesting that physisorption plays a more significant role in their adsorption behaviour. This distinction explains the higher adsorption stability and capacity observed for YPAC compared to the other two carbons.42, 59, 60 Isotherm analysis supports these findings, with YPAC fitting the Langmuir model, indicating monolayer adsorption on relatively homogeneous surface sites, whereas CWAC and SPAC conform better to the Freundlich model, reflecting heterogeneous surface characteristics and multilayer adsorption. Although intraparticle diffusion contributes to fluoride uptake in all cases, it is not the sole rate-limiting step, suggesting that surface interactions play a dominant role in the overall adsorption mechanism.55, 56 ,58 Similar fluoride adsorption mechanisms have been reported in recent biochar- and activated-carbon-based systems, where electrostatic attraction, hydrogen bonding, and surface complexation dominate fluoride uptake. Fe3O4-impregnated macroalgal biochar has been shown to enhance adsorption kinetics through improved surface reactivity and magnetic recovery.64 Advanced kinetic analyses further confirm that surface reaction-controlled adsorption often governs fluoride uptake rather than intraparticle diffusion alone,30 which is consistent with the kinetic behaviour observed in the present study.
Limitations of the study
Although this study provides strong evidence of the effectiveness of the prepared activated carbons for fluoride removal, certain advanced analyses were not included. Analyses such as X-ray diffraction (XRD), X-ray photoelectron spectroscopy (XPS), Boehm titration, which could provide more detailed information on the nature of surface functional groups and chemical states were not carried out. To understand the energetic nature of adsorption, thermodynamic studies and advanced computational modelling such as DFT which predict adsorption behaviour were not performed primarily due to time constraints, resource availability and financial support.
Comparison of YPAC, CWAC, and SPAC with other adsorbents
YPAC, CWAC and SPAC perform well compared with the reported agro-based adsorbents Table 6. According to the Langmuir model, YPAC has the highest qmax of the three at 4.28 mg·g-1. With Freundlich KF values of 5.44 and 4.72, respectively, CWAC and SPAC exhibit notable heterogeneous surface uptake. These capacities are significantly greater than those of inexpensive materials with a qmax of 0.53 mg/g, such as common biofilter media65 and spent coffee-ground biochar.66 Higher qmax values are reported for engineered composites, heavily modified carbons (e.g., CS/OP/AC@MgO),67 and some chemically modified date-stem carbons.68 However, these require multi-step synthesis to reach those levels. In the referenced study, phosphogypsum-modified vinasse-shell biochar69 exhibits a comparatively high Freundlich KF and good practical performance. Further recent engineered adsorbents such as Ce–Al oxide supported activated carbon28 and Fe3O4-impregnated biochar systems64 exhibit higher adsorption capacities than many unmodified carbons. However, these materials typically require multi-step synthesis, chemical modification, and higher production costs. In contrast, the phosphoric-acid-activated carbons developed in the present study offer a balance between adsorption efficiency, simple preparation, and practical applicability, making them more suitable for scalable defluoridation applications.
Table 6: Comparative study of adsorption capacity of YPAC, CWAC, SPAC with other adsorbents.
Adsorbent | SBET (m2/g) | Parameter (qmax/ KF) | Isotherm model | References |
Yam (YPAC) | 884.4 | qmax= 4.28 | Langmuir | Current study |
Crofton Weed (CWAC) | 803.2 | KF = 5.44 | Freundlich | Current study |
Squash (SPAC) | 731.4 | KF = 4.72 | Freundlich | Current study |
Bio filter | ----- | qmax =0.53 | Langmuir | 65 |
Coffee ground | 12.94 | qmax= 0.53 KF = 0.05 | Langmuir/ Freundlich | 66 |
chitosan/orange peels/activated Carbon@ MgO | 79.45 | qmax =26.92 | Langmuir | 67 |
Date stems | 992 | qmax = 20.05 | Langmuir | 68 |
Phosphogypsum-Modified Vinasse Shell Biochar | 71.3 | KF = 6.48 | Freundlich | 69 |
Cost-effectiveness and practical relevance
Beyond their adsorption performance, the practical value of YPAC, CWAC, and SPAC lies in their economic and environmental advantages. The plant sources used; Yam, Crofton weed and Squash are locally abundant, renewable and often regarded as agricultural residues or invasive species, making them essentially cost-free raw materials. Compared to commercial activated carbons or engineered adsorbents, which typically require costly precursors and multi-step synthesis, biomass-derived carbons can reduce production costs by up to 60–80% due to minimal processing and chemical input.70,71 Moreover, phosphoric acid activation, as used in this study, is a relatively low-cost and scalable technique that enables high surface area development without the need for specialized equipment.50 These adsorbents are viable options for fluoride remediation in rural and limited-resource regions due to their high regeneration capacity and economic advantages. In line with recent advancements in affordable and ecologically friendly water treatment technologies, their implementation consequently lowers waste production and promotes the circular use of local biomass.26, 13 Recent assessments highlight that although advanced composite adsorbents demonstrate superior adsorption capacities, their economic and chemical demands often limit large-scale deployment. Comprehensive reviews stress that biomass-derived activated carbons remain the most feasible option for decentralized and rural water treatment due to their low cost, availability, and environmental compatibility.30,31 Recent groundwater studies using nut-shell-derived activated carbon further support the viability of plant-based carbons for real-world fluoride remediation.72
Comparative performance of YPAC, CWAC, and SPAC
The superior fluoride adsorption performance of YPAC compared to CWAC and SPAC can be attributed to a combination of its textural properties, surface chemistry, and adsorption mechanism developed during phosphoric acid activation. YPAC exhibits the highest BET surface area and pore volume, providing a greater number of accessible adsorption sites and facilitating efficient diffusion of fluoride ions into the internal pore structure. SEM analysis further indicates that YPAC possesses a more uniform and interconnected pore network, which enhances mass transfer compared to the relatively less developed pore structures observed in CWAC and SPAC. FTIR analysis confirms the presence of oxygen-containing functional groups on all three activated carbons; however, the relatively higher density of these functional groups on YPAC strengthens fluoride binding through hydrogen bonding and electrostatic interactions. In addition, the higher pHZPC value of YPAC (6.3) results in a more positively charged surface under acidic to near-neutral conditions, enhancing electrostatic attraction toward negatively charged fluoride ions. Kinetic analysis shows that fluoride adsorption on YPAC follows the pseudo-second-order model, indicating chemisorption and stronger surface–fluoride interactions, whereas CWAC and SPAC are governed mainly by pseudo-first-order kinetics associated with physisorption. Together, these factors explain the consistently higher adsorption capacity, removal efficiency, and stability of YPAC relative to CWAC and SPAC, with CWAC showing moderate performance and SPAC exhibiting comparatively lower efficiency due to reduced porosity and weaker surface interactions.
Conclusion
Phosphoric acid-activated carbons derived from Colocasia esculenta (yam), Ageratina adenophora (crofton weed), and Sechium edule (squash) were shown in this study to be highly effective in fluoride removal from water. FTIR confirmed that the activated carbons had a lot of oxygenated functional groups that act as active sites, and they also had large surface areas (884.4, 803.2, and 731.5 m²/g, respectively) and well-developed porous structures. The greatest adsorption capacity and removal efficiency of all of them was demonstrated by YPAC, which under ideal circumstances reached over 90%, while CWAC and SPAC achieved slightly lower but still substantial removals. Isotherm analysis indicated that fluoride adsorption onto YPAC followed the Langmuir model, suggesting monolayer adsorption, whereas CWAC and SPAC followed the Freundlich isotherm, indicating heterogeneous adsorption behaviour. Kinetic studies revealed that fluoride adsorption onto YPAC was best described by the pseudo-second-order model, implying chemisorption, while CWAC and SPAC followed the pseudo-first-order model, suggesting that physisorption dominated their adsorption process. The pHZPC values (6.3 for YPAC, 6.0 for CWAC, and 5.8 for SPAC) explained the strong adsorption at acidic pH due to electrostatic attraction between positively charged surfaces and fluoride species. The practical applicability of the prepared activated carbons was further validated using five independently collected natural water samples with fluoride concentrations ranging from 3.2 to 4.8 mg/L, tested without pH adjustment. Consistent fluoride removal was observed across all samples, with YPAC achieving the highest removal efficiencies, followed by CWAC and SPAC. The limited variation in performance among different water samples indicates that fluoride adsorption was primarily governed by the intrinsic surface properties of the activated carbons rather than by location-specific differences in water chemistry. Regeneration studies demonstrated that the adsorbents retained appreciable fluoride removal capacity over multiple adsorption–desorption cycles, although a gradual decline in efficiency was observed with repeated reuse. Despite this reduction, the materials maintained reasonable performance, highlighting their potential for sustainable and cost-effective fluoride remediation. From an environmental standpoint, the use of locally available and underutilized plant biomass for activated carbon production contributes to waste valorisation and reduces dependence on commercially manufactured adsorbents. The ability of the prepared carbons to remove fluoride effectively under natural pH conditions and across multiple natural water samples highlights their potential for environmentally sustainable and low-impact water treatment applications, particularly in fluoride-affected regions. While these results highlight the potential of these plant-based adsorbents as low-cost and sustainable options for fluoride remediation, further studies on long-term regeneration stability, performance in diverse water matrices, and simple scale-up approaches would help advance them towards real-world application.
Acknowledgement
The authors gratefully acknowledge the Sophisticated Analytical Instrumentation Facility (SAIF) and the Department of Chemical Sciences, Tezpur University, for providing the analytical and laboratory facilities essential for the work.
Funding Sources
This work was supported by the National Fellowship for Scheduled Tribes (NFST), Government of India (Award No-202122-NFST-NAG-01020 for Neilanuo Huozha; 202122-NFST-NAG-01023 for Nikili K Zhimo).
Conflict of Interest
The authors do not have any conflict of interest.
Data Availability Statement
All data generated during this study are included within the manuscript.
Ethics Statement
This research did not involve human participation, animal subjects or any material requiring ethical approval.
Informed Consent Statement
This study did not involve human participants and therefore informed consent was not required.
Permission to Reproduce Material from other sources
Not Applicable
Authors Contribution
Neilanuo Huozha- Conducted the experiment, analysed the data and prepared the initial draft;
Nikili K Zhimo – Assisted with laboratory work and data organisation;
Daniel Kibami – Supervised the study and reviewed the manuscript. All authors approved the final version.
References
- Mahdi A., Jain A., Bhatnagar M., Bhatnagar R. Fluoride Toxicity. In: Food Toxicology. CRC Press; 2016:355.
CrossRef - Habuda-Stanic M., Ergovic Ravancic M., Flanagan A. A review on adsorption of fluoride from aqueous solution. Materials. 2014;7(9):6317-6366. doi:10.3390/ma7096317
CrossRef - World Health Organization. Guidelines for Drinking-Water Quality. Vol 1. World Health Organization; 2004.
- Jha S.K., Singh RK, Damodaran T., Mishra VK, Sharma DK, Rai D. Fluoride in groundwater: toxicological exposure and remedies. J. Toxicol. Environ. Health, Part B. 2013;16(1):52-66. doi:10.1080/10937404.2013.769420
CrossRef - Mandinic Z., Curcic M., Antonijevic B., Carevic M., Mandic J., Djukic-Cosic D., Lekic C.P. Fluoride in drinking water and dental fluorosis. Sci. Total Environ. 2010;408(17):3507-3512.
CrossRef - National Research Council; Division on Earth; Board on Environmental Studies; Committee on Fluoride in Drinking Water. Fluoride in Drinking Water: A Scientific Review of EPA's Standards. National Academies Press; 2007.
- Dumpala S., Ramaneswari K,. Chintada V. Fluoride toxicity and potential health. In: Fluorides in Drinking Water: Source, Issue, and Mitigation Strategies. 2024:63–72.
CrossRef - Reardon E.J., Wang Y. A limestone reactor for fluoride removal from wastewaters. Environ. Sci. Technol. 2000;34(15):3247-3253. doi:10.1021/es990542k
CrossRef - Ghosh D., Sinha M.K., Purkait M.K. A comparative analysis of low-cost ceramic membrane preparation for effective fluoride removal using hybrid technique. Desalination. 2013;327:2-13. doi:10.1016/j.desal.2013.08.003
CrossRef - Shen J., Schäfer A. Removal of fluoride and uranium by nanofiltration and reverse osmosis: a review. Chemosphere. 2014;117:679-691. doi:10.1016/j.chemosphere.2014.09.090
CrossRef - Guo Q., Tian J. Removal of fluoride and arsenate from aqueous solution by hydrocalumite via precipitation and anion exchange. Chem. Eng J. 2013;231:121-131. doi:10.1016/j.cej.2013.07.025
CrossRef - Gong W.X., Qu J.H., Liu R.P., Lan H.C. Effect of aluminum fluoride complexation on fluoride removal by coagulation. Colloids Surf. A Physicochem. Eng Asp. 2012;395:88-93. doi:10.1016/j.colsurfa.2011.12.010
CrossRef - Bhatnagar A., Kumar E., Sillanpää M. Fluoride removal from water by adsorption—a review. Chem. Eng J. 2011;171(3):811-840. doi:10.1016/j.cej.2011.05.028
CrossRef - Maheshwari R.C. Fluoride in drinking water and its removal. J. Hazard. Mater. 2006;137(1):456-463. doi:10.1016/j.jhazmat.2006.02.024
CrossRef - Suneetha M., Sundar B.S., Ravindhranath K. Removal of fluoride from polluted waters using active carbon derived from barks of Vitex negundo plant. J. Anal. Sci. Technol. 2015;6(1):1-19. doi:10.1186/s40543-014-0042-1
CrossRef - Amalraj A., Pius A. Removal of fluoride from drinking water using aluminum hydroxide coated activated carbon prepared from bark of Morinda tinctoria. Appl. Water Sci. 2017;7(6):2653-2665. doi:10.1007/s13201-016-0479-z
CrossRef - Joshi S., Pradhananga M.A., Pradhananga R.R. Adsorption of fluoride ion onto zirconyl-impregnated activated carbon prepared from lapsi seed stone. J. Nepal Chem Soc. 2012;30:13-23. doi:10.3126/jncs.v30i0.9330
CrossRef - Dehghani M.H., Farhang M., Alimohammadi M., Afsharnia M, McKay G. Adsorptive removal of fluoride from water by activated carbon derived from CaCl3-modified Crocus sativus leaves. Chem. Eng. Commun. 2018;205(7):955-965. doi:10.1080/00986445.2018.1423969
CrossRef - Kofa GP, Gomdje VH, Telegang C, Koungou SN. Removal of fluoride from water by adsorption onto fired clay pots. J. Appl. Chem. 2017;2017:1-7. doi:10.1155/2017/6254683
CrossRef - Nigussie W., Zewge F., Chandravanshi BS. Removal of excess fluoride from water using waste residue from alum manufacturing process. J. Hazard. Mater. 2007;147(3):954-963. doi:10.1016/j.jhazmat.2007.01.126
CrossRef - Lavecchia R., Medici F., Piga L., Rinaldi G. Fluoride removal from water by adsorption on a high alumina content bauxite. Chem. Eng. Trans. 2012;26:225-230. doi:10.3303/CET1226038
- Mulugeta E., Zewge F., Johnson C.A., Chandravanshi BS. Aluminium hydro(oxide)-based adsorbent for defluoridation of drinking water. Water SA. 2015;41(1). doi:10.4314/wsa.v41i1.15
CrossRef - Vivek Vardhan C.M., Srimurali M. Removal of fluoride from water using lanthanum-impregnated bauxite. SpringerPlus. 2016;5(1):1426. doi:10.1186/s40064-016-3112-6
CrossRef - Liu H., Deng S., Li Z., et al. Preparation of Al–Ce hybrid adsorbent and its application for defluoridation of drinking water. J. Hazard. Mater. 2010;179(1-3):424-430. doi:10.1016/j.jhazmat.2010.03.021
CrossRef - Kebede B., Beyene A., Fufa F. Sorptive removal of fluoride from drinking water using iron ore. Appl. Water Sci. 2016;6(1):57-65. doi:10.1007/s13201-014-0210-x
CrossRef - Sud D., Mahajan G., Kaur M.P. Agricultural waste material as potential adsorbent for heavy metal ions. Bioresour. Technol. 2008;99(14):6017-6027. doi:10.1016/j.biortech.2007.11.064
CrossRef - Robledo-Peralta A., Torres-Castañón L.A., Rodríguez-Beltrán R.I, Reynoso-Cuevas L. Lignocellulosic biomass as sorbent for fluoride removal. Polymers. 2022;14(23):5219. doi:10.3390/polym14235219
CrossRef - Guo S., Zheng F., Xu J., et al. Enhanced fluoride removal from drinking water by activated carbon supported Ce–Al oxides: performance and mechanism. RSC Adv. 2025; 15:14363-14374. doi: 10.1039/d5ra00397k
CrossRef - Ergovic Ravancic M., Habuda-Stanic M. Fluoride adsorption from water using activated carbon modified with nitric acid and hydrogen peroxide. Water (Basel). 2024;16(23):3439. doi.org/10.3390/w16233439
CrossRef - Gebrewold B.D, Werkneh A.A, Kijjanapanich P., Rene E.R., Lens P.N.L, Annachhatre A.P. Low-cost materials for fluoride removal from groundwater: adsorption, surface modification and regeneration—a critical review. J Environ Manage. 2024. doi.org/10.1016/j.jenvman.2024.122937
CrossRef - Das K., Sukul U., Chen J.S., Sharma R.K., Banerjee P., Dey G. ,et al. Transformative and sustainable insights of agricultural bioadsorbents for defluoridation. J Clean Prod. 2024. doi.org/10.1016/j.heliyon. 2024.e29747
CrossRef - Babic BM, Milonjic SK, Polovina MJ, Kaludierovic BV. Point of zero charge and intrinsic equilibrium constants of activated carbon cloth. Carbon. 1999;37(3):477-481. doi:10.1016/S0008-6223(98)00216-4
CrossRef - Jumasiah A., Chuah T.G., Gimbon J., Choong T.S.Y, Azni I. Adsorption of basic dye onto palm kernel shell activated carbon. Desalination. 2005;186(1–3):57–64. doi:10.1016/j.desal.2005.05.015
CrossRef - Vijayaraghavan K.T.V.N., Padmesh T.V.N., Palanivelu K., Velan M. Biosorption of nickel(II) ions onto Sargassum wightii. J. Hazard. Mater. 2006;133(1-3):304-308. doi:10.1016/j.jhazmat.2005.10.016
CrossRef - Azad D., Pateriya R.N., Sharma R.K. A review on preparation and characterization of activated bio-char. Int. J. Environ. Climate Change. 2021;11(4):106-117. doi:10.9734/ijecc/2021/v11i430398
CrossRef - Linares-Solano A., Martín-Gullón I., de Lecea C.S.M, Serrano-Talavera B. Activated carbons from bituminous coal. Fuel. 2000;79(6):635-643. doi:10.1016/S0016-2361(99)00184-2
CrossRef - Rivera-Utrilla J., Sánchez-Polo M., Gómez-Serrano V., Álvarez P.M., Alvim-Ferraz M.C.M, Dias J.M. Activated carbon modifications for water treatment. J. Hazard Matter. 2011;187(1-3):1-23. doi:10.1016/j.jhazmat.2011.01.033
CrossRef - Mianowski A., Owczarek M., Marecka A. Surface area of activated carbon determined by iodine number. Energy Sources A. 2007;29(9):839-850. doi:10.1080/00908310500430901
CrossRef - Ceyhan A.A., Sahin Ö., Baytar O., Saka C. Characterization of activated carbon prepared by two-stage pyrolysis. J. Anal. Appl. Pyrolysis. 2013;104:378-383. doi:10.1016/j.jaap.2013.06.009
CrossRef - Zheng Z.Q., Xia H.Y., Srinivasakannan C., Peng J.H., Zhang L.B. Activated carbon from Crofton weed by microwave CO2 activation. Chem. Eng. Process. 2014;82:1-8. doi:10.1016/j.cep.2014.05.001
CrossRef - Astika I.M., Negara D.P., Kencanawati C.I.P.K., Nindhia T.G.T., Hidajat F. Properties of bamboo activated carbon at different temperatures. IOP Conf. Ser. Matter Sci. Eng. 2019;539:012010. doi:10.1088/1757-899X/539/1/012010
CrossRef - Pongener C., Bhomick P.C., Supong A., Baruah M., Sinha U.B., Sinha D. Adsorption of fluoride onto activated carbon from Manihot esculenta. J. Environ. Chem. Eng. 2018;6(2):2382-2389. doi:10.1016/j.jece.2018.02.045
CrossRef - Rodriguez-Reinoso F., Molina-Sabio M. Textural and chemical characterization of microporous carbons. Adv. Colloid. Interface Sci. 1998;76:271-294. doi:10.1016/S0001-8686(98)00049-9
CrossRef - Saadi W., Rodríguez-Sánchez S., Ruiz B., et al. One-step alkaline carbonate activated carbons from pomegranate peels. J. Environ. Chem. Eng. 2022;10(1):107010. doi:10.1016/j.jece.2021.107010
CrossRef - Katsaros F.K., Steriotis T.A., Stubos A.K., Kanellopoulos N.K., Tennison S.R. Effect of activation process on resin-based activated carbons. Stud. Surf. Sci. Catal. 2007;160:599-606. doi:10.1016/S0167-2991(07)80077-2
CrossRef - Yu X., Liu S., Lin G., et al. Roles of microstructures and functional groups in carbonaceous surfaces for acetone adsorption. RSC Adv. 2018;8(38):21541-21550.
CrossRef - Phothong K., Tangsathitkulchai C., Lawtae P. Pore development and functional groups in bamboo-based activated carbon. Molecules. 2021;26(18):5641. doi:10.3390/molecules26185641
CrossRef - Bidaei M.R., Azadfallah M., Yarahmadi R., Goleij N. Activated carbon from decayed wood using DBD plasma. BioResources. 2024;19(4). doi:10.15376/biores.19.4.9510-9530
CrossRef - Hadoun H., Sadaoui Z., Souami N., Sahel D., Toumert I. Mesoporous carbon from date stems by H3PO4 activation. Appl. Surf. Sci. 2013;280:1-7.
CrossRef - Puziy A.M., Poddubnaya O.I., Gawdzik B., Tascón J.M.D. Phosphorus-containing carbons: properties and utilization. Carbon. 2020;157:796-846. doi:10.1016/j.carbon.2019.10.018
CrossRef - Martinez M.L., Torres M.M, Guzman C.A., Maestri D.M. Activated carbon from olive stones and walnut shells. Ind. Crops. Prod. 2006;23(1):23-28. doi:10.1016/j.indcrop.2005.03.001
- Gurten I.I., Ozmak M., Yagmur E., Aktas Z.. Activated carbon from waste tea using K2CO3. Biomass Bioenergy. 2012;37:73-81. doi:10.1016/j.biombioe.2011.12.030
- Emmanuel K.A., Ramaraju K.A., Rambabu G., Rao A.V. Removal of fluoride from drinking water with HNO3-activated carbon. Rasayan J. Chem. 2008;1(4):802-818.
- Yadav A.K., Abbassi R., Gupta A., Dadashzadeh M.. Removal of fluoride by wheat straw, sawdust, and bagasse carbon. Ecol. Eng. 2013;52:211-218. doi:10.1016/j.ecoleng.2012.12.069
- Foo K.Y., Hameed B.H. Insights into modelling of adsorption isotherms. Chem. Eng J. 2010;156(1):2-10. doi:10.1016/j.cej.2009.09.013
- Langmuir I. The adsorption of gases on plane surfaces. J. Am. Chem Soc. 1918;40(9):1361-1403.
- Freundlich H. Over the adsorption in solution. J. Phys. Chem. 1906;57:385-470.
- Temkin M, Pyzhev V. Kinetics of ammonia synthesis. Acta Physicochim. URSS. 1940;12:217-222.
- Lagergren S. About the theory of so-called adsorption of soluble substances. Kungliga Svenska Vetenskapsakademiens Handlingar. 1898;24(4):1–39.
- Ho Y.S, McKay G. Pseudo-second order model for sorption processes. Process Biochem. 1999;34(5):451-465. doi:10.1016/S0032-9592(98)00112-5
- Mohamed Nasser S., Abbas M., Trari M. Rate-limiting step adsorption kinetics. Prog. React. Kinet. Mech. 2024;49:14686783241226858. doi:10.1177/14686783241226858
- Tripathy S.S., Bersillon J.L., Gopal K. Fluoride removal by alum-impregnated activated alumina. Sep Purif. Technol. 2006;50(3):310-317. doi:10.1016/j.seppur.2005.11.036
- Mohapatra M., Anand .S, Mishra B.K., Giles DE, Singh P. Review of fluoride removal from drinking water. J. Environ. Manag. 2009;91(1):67-77. doi:10.1016/j.jenvman.2009.08.015
- Kanwal S., Devrajani S.K., Hashmani S.A.K. Removal of fluoride from aqueous solution using Fe3O4-impregnated macroalgal biochar. Phycology. 2025;5(3):37. doi.org/10.3390/phycology5030037
- Yadav M., Singh N.K. Isotherm investigation for sorption of fluoride onto Bio-F. Appl. Water Sci. 2017;7(8):4793-4800. doi:10.1007/s13201-017-0602-9
- dos Santos H.V.R., Scalize P.S., Teran F.J.C., Cuba RMF. Fluoride removal using biochar from coffee grounds. Resources. 2023;12(7):84. doi:10.3390/resources12070084
- Tolkou A.K., Posantzis A., Maroulas K.N., et al. Fluoride removal by chitosan/orange peels/activated carbon@MgO. Processes. 2024;12(9):2043. doi:10.3390/pr12092043
- Bakhta S., Sadaoui Z., Bouazizi N., et al. Functional activated carbon for groundwater fluoride removal. RSC Adv. 2022;12(4):2332-2348. doi:10.1039/d1ra08209d
- Liu Z., Zhang J., Mou R. Phosphogypsum-modified vinasse shell biochar for fluoride removal. Molecules. 2023;28(22):7617. doi:10.3390/molecules28227617
- Yahya M.A., Al-Qodah Z., Ngah C.Z. Agricultural bio-waste as precursors for activated carbon: a review. Renew Sustain. Energy Rev. 2015; 46:218-235. doi: 10.1016/j.rser.2015.02.051
- da Paixão Cansado I.P., Geraldo P.F., Mourão P.A.M, Castanheiro JE, Carreiro EP. Utilization of biomass waste in water treatment. Resources. 2024;13(3):1-15. doi:10.3390/resources13030037
- Somkiattiyot P., et al. Enhanced fluoride removal from groundwater using activated carbon prepared from Borassus flabellifer nut shells. Curr Res Green Sustain Chem. 2025. doi.org/10.48048/tis.2025.9217
Abbreviations List
YPAC: Yam Plant Activated Carbon
CWAC: Crofton Weed Activated Carbon
SPAC: Squash Plant Activated Carbon
FTIR: Fourier-transform Infrared Spectroscopy
SEM: Scanning electron Microscopy
BET: Brunauer Emmett Teller
CHN: Carbon-Hydrogen-Nitrogen Elemental Analysis
pHZPC: pH Zero-point Charge
Ci: Initial Fluoride Concentration (mg/L)
Cf: Fina Fluoride Concentration (mg/L)
qe: Adsorption Capacity (mg/g)
qt: Adsorption Capacity at time t (mg/g)
RPM: Revolutions Per Minute
H3PO4: Phosphoric Acid
NaOH: Sodium Hydroxide; HCl: Hydrochloric Acid
PFO: Pseudo first-order kinetic model
PSO: Pseudo second-order kinetic model
IPD: Intraparticle diffusion model
RMSE: Root Mean Square
X2: Chi-Square error function
RL: Langmuir Separation Factor
qm: Maximum Adsorption Capacity
KL: Langmuir Constant
Kf: Freundlich Constant; n: Freundlich heterogeneity factor
AT: Temkin Constant
B: Temkin heat constant
TDS: Total Dissolved Solid
EC: Electrical Conductivity


