Monitoring Land Cover Changes in coastal tract of Odisha using Landsat ETM+ Imagery
Ranu Rani Sethi1 , Amiya Sagarsahu1 , R.C. Srivastava1 , Madhumita Das1 , Ashwani Kumar1 and Jugal Kishore Tripathy2
1
Directorate of Water Management,
Bhubaneswar,
Odisha
India
2
Aul Embankment Division,
Department of Water Resources,
Govt. Of Odisha,
India
http://dx.doi.org/10.12944/CWE.9.2.26
Copy the following to cite this article:
Sethi R. R, Sahu A. S, Srivastava R. C, Das M, Kumar A, Tripathy J. K. Monitoring Land Cover Changes in coastal tract of Odisha using Landsat ETM+ Imagery. Curr World Environ 2014;9 (2) DOI:http://dx.doi.org/10.12944/CWE.9.2.26
Copy the following to cite this URL:
Sethi R. R, Sahu A. S, Srivastava R. C, Das M, Kumar A, Tripathy J. K. Monitoring Land Cover Changes in coastal tract of Odisha using Landsat ETM+ Imagery. Curr World Environ 2014;9(2). Available from: http://www.cwejournal.org/?p=6532
Download article (pdf) Citation Manager Publish History
Land cover refers to surface cover on ground which includes vegetation, settlements, water base soil etc. Delineating and mapping land cover is important for global monitoring system, resource management and planning activities. Identification of land cover provides the baseline from which monitoring activities (change detection) can be performed, and provides the ground cover information for baseline thematic maps. Coastal areas, being favourable on biophysical and climatic conditions,have attracted human settlement since prehistoric times. Early settlements were established on the coastal areas for both commercial and naval purposes (Nurlu and Erdem 2002). More than half of the world’s population live on coastal areas (Hinrichsen,1998). All most all worlds’ coastal areas are exposed to rapid urban growth; increasing population pressure; expansion of major industries. As a result, land use and land cover of the coastal areas are changing dramatically because of natural processes as well as human activities. Land use and/land cover changes have become a central component for managing natural resources and monitoring environmental changes (Bottomley1998). Therefore, a lot of land cover and land use change models have been developed for assessing change on land use patterns for different purposes (U.S. EPA 2000).
Satellite data with their repetitive nature have proved to be useful in mapping land use/ land cover patterns and temporal changes. Methods of change detection in remote sensing typically analyze sequential images of the same area and evolve the detection and display of the image space. There are a number of such methods that are suitable for continuous monitoring the type of changes, including image differencing (Lyon et al., 1998). There are different methods that can be used in this context, including post-classification comparisons and multidate-classification (Cohen et al, 1998). Land use land cover change pattern of diara land of river Ganga using multi-temporal satellite data has been done by Kumar G. et al, 2008. As a general form, land cover classifications provide the fundamental information to appraise the impact of human interactions within the environment and to assess scientific foundations for sustainability, vulnerability, and resilience of land systems and their use (Han et al. 2004). Changes in land use and land cover are key factors for global environmental change (Bürgi, 1999). Growing human population causes land scarcity and the conversion of wild lands to agriculture and other uses and, thus, land use/land cover change. Population growth can push the rural poor onto marginal lands. Other important determinants of changes in land use and land cover include several types of policy: human settlement and land tenure policy, fiscal policy, trade policy, and agricultural policy. In addition, changes in technology (e.g., road building), culture, power, and political/economic institution scan influence land use/land cover change (Reid etal. 2000).The remote sensing (RS) and Geographical Information System (GIS) in the assessment of changes of land use/land cover are used increasingly(Iverson et al. 1994; Moody and Woodcock1995; Metzger and Muller 1996; Basnyat et al.1999; Mertens and Lambin 1999; Reid et al. 2000;Li et al. 2001; Apan et al. 2002; Backhaus et al.2002; Sahin and Kurum 2002; Göksel et al. 2004; Gulinck et al. 2001; Coskun et al. 2006;Nagendraet al. 2006). Remote sensing can provide valuable and timely information on natural resources and the environment (Waseret al. 2007). The percentage of land cover and land use types were calculated using Geographical Information System (Feoli et al. 2002; Weierset al.2004; Shalaby and Tateishi 2007). The Geographical Information System is a special type of tool evolved to analyze geographic data for efficient planning (Sengupta and Venkatachalam 1994).The GIS provided data about the environment by using raster images and other thematic maps which were pre processed, displayed, and analyzed(Apan et al. 2002). GIS and RS may play a vital role at the stages of exploration and analysis of local resources, planning, and evaluation. Current land use was studied using GIS, satellite RS, field observations, and published records. GIS analysis was carried out to create a comprehensive database, including land use, soil suitability, socioeconomic data, and rainfall (Göksel et al. 2004; Chang et al. 2008).
Eastern part of India comprising the State of Odisha, West Bengal, AndhraPradeshare vulnerable to multiple disasters such as tropical cyclones, storm surges, and Tsunamis. The threat of the coastal vulnerability to such hazards has increased many folds with the growing population. The economy of these states has received tremendous setbacks because several natural hazards occurred in succession. Especially coastal districts of Odisha have experienced major surges in the past. Severe flooding caused by storm surges during the 1999 super cyclone caused massive destruction to life and property. Extreme sea levels are major causes of concern for coastal flooding in this region. The loss of land to the sea has now become a more recurrent phenomenon. Identification of vulnerable areas and effective risk mapping and assessment is the need of the hour (Srinivasa Kumar et al., 2010). As the struggle for food runs swiftly and primarily, focus is to conserve the area covered by crops from getting eroded. This paper focuses the issue of change in land use/land cover classes and acreage of each class for a coastal village and itsnearbyareas of Odisha. The land cover (LC) is defined as the observed physical layer including natural and planted vegetation and human constructions, which cover thesurface of the Earth.
Study Area
Present study was conducted for Sunity gram panchayat, located in Mahakalapada block of Kendrapara districts of Odisha, which falls within the latitude & longitude range from 20.400to 20.500N and 86.450 to 86.750E respectively. The mean sea level is only 0-3m along the coast line.Mahakalapadais the most populous and largest in having geographical area of 490.57 sq. km. amongst all the blocks in Kendrapara district of Odisha. Total rainfall received across the year is 1509 mm. Area sown for agriculture is also highest in this block covering area of 28655 ha. Hence, maximum importance was given to this block primarily so as to get the observations for detecting the changes. Fig. 1shows the location of study area.
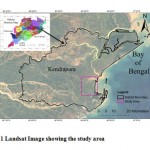 |
Figure 1: Landsat Image showing the study area Click here to View Figure |
Materials and Methods Remote Sensing Data
Remotely sensed data together with ancillary data (standard topographic map) have been used to investigate land cover change data of Suniti and its surroundings areas overthe past 6 years (2000-2006). Land cover changes were defined using Landsat ETM+ image of 23rd October, 2000 and 24thOctober, 2006. To improve and verify the accuracy of the image, topographic maps of 1:25 000 scale covering the study area, showing the main landscape features such as relief, soils, forests, shrubs, wetlands,etc. were referred. ArcGIS 10.0software was used for interpretation of satellite data by using ground controlpoints and ancillary data. Also this software was used forchange detection analyses. To detect the land cover changes within six years from 23rd October 2000 to 24th October 2006 , the ortho-rectified Landsat Enhanced Thematic Mapper+(Landsat ETM+) data downloaded from Global Land Cover Facility (GLCF) website (http://glcf.umiacs. umd.edu/) was used as reference for geo-rectification (Saranya K.R.L. etal 2014). Image-to-image registration was done in order to register the multitemporal raw images in the projection UTM N45 and datum WGS84 using the first-order (linear) polynomial function. Nearest Neighbor resampling was chosen in order to preserve the radiometry and spectralinformation in the imagery (Sabins 1987). The RMS error of the image to image registration achieved <1 (0.49–0.78) pixel. To reduce the error due to atmospheric conditions at different dates, top-of-atmosphere (TOA) reflectance program was used (Chavez 1996).ArcGIS 10.0 software enabled system was employed to process the acquired images.
Methodology
The procedure of the methodology is outlined in fig. 2.
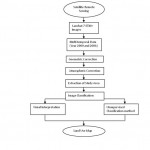 |
Figure 2: Flow Chart of Methodology (Saranya K. R. L. et al., 2014) Click here to View Figure |
Results and Discussions
From the acquired Landsat ETM+ image of the study area, change detection analysis was carried out. FCC (False Colour Composite) images were prepared with the band combinations 7, 4 and 2 to RGB (Red, Green and Blue) channels respectively for both the year 2000 & 2006. Fig.3 shows the FCC images (Pre-Classified) for both the years 2000 and 2006. Though images were well observed, but it could not be discriminated well for detecting the changes because of similar pattern in the images. Change of land cover is a must according to the brutality of natural calamities over those areas. Hence, remote sensing classification method was adopted to detect the changes quantitatively. Image interpretation elements (shape, size, tone, texture, pattern and association) were keysfor identifying the area used for specific purposes. Then satellite images were classified to prepare land use/land cover maps of 2000 and 2006. Iso cluster unsupervised classification was employed to generate land cover maps.Post classified images were observed to detect the changes. Fig.2 shows the post classified Landsat ETM+ images for both the year 2000 and 2006.
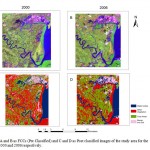 |
Figure 3 A and B: as FCCs (Pre Classified) and C and D as Post classified images of the study area for the year 2000 and 2006 respectively. Click here to View Figure |
Classified images could differentiate well the geographical entities like crops, water, other vegetation and soil and barren areas occupying within the study area showed in Table 1.
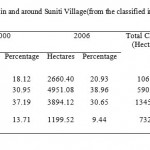 |
Table 1: land Cover Changes in and around Suniti Village (from the classified images for the year 2000 & 2006) Click here to View table |
Major land cover types were classified as agricultural areas, land with other vegetation, water bodies and soil/barren land. From the outcomes of the analysis it was found that water bodies and agricultural crop areas have increased with 2.81 % and 8.01 % within the period of the year 2000 to 2006 whereas other vegetation and areas of soil and barren have decreased with 6.54 % and 4.27% respectively. One of the reasons could be due to the effect of super cyclone in coastal areas during the year 1999. As per the official records, super cyclone damaged all most 90% of the agricultural and other crops in Odisha especially in Jagatsinghpur, Kendrapara districts. Situations prevailing aftermath of this disaster continued to be reconciled at a very slower rate. However, in the present study, analysis was carried out year 2000, which is after 1 year of the super cyclone. Based on the ground truth information collected from the study area, it showed that even in the year 2000, there was comparatively less cropped area due to the effect of post super cyclone in 1999. But gradually over the period of time, there was increase in cropped area in the coastal areas, which was reflected from the image analysis. During 2006 there was increase in crop coverage for most of the coastal Odisha. Water bodies have increased a little due to change in the geomorphology of the landscape within 6 years interval. Land cover having other vegetation inclusive of shrub, bushes and trees etc. have reduced because of the socio-economic developmental activities. Soil and barren areas have also reduced due to the settlement of the dwellings. Burgeoning of the population also induced to cause the change in those land covers.Quantitative outcomes made it easier to take the decision effectively and to promote the planning process for the well being of the locality and the coastal zone of the state as a whole.
Conclusion
Changes of land use and land cover over a period of 6 years between 2000 and 2006 in Suniti village and its surroundings were monitored by using Landsat ETM+ images. The image classification results showed that the land use and land cover in the study area experienced noticeable changes over the period of 6 years. Water bodies and agricultural crop areas have increased with 2.81 % and 8.01 % within the period of the year 2000 to 2006 whereas other vegetation and areas of soil and barren have decreased with 6.54 % and 4.27% respectively. Intensive agricultural planning must be undertaken to increase the food security and similar approach for the other regions must be carried out so as to meet the challenges. Effective utilization of satellite imagery has been properly done for the classification and to monitor the changes in the environmental components.The findings of this research will definitely be beneficial to the decision makers in making plan and developing strategy for the wellbeing of the coastal inhabitants and the habitats as well.
Acknowledgements
We would like to be sincerely thankful to Director, all the staffs whose have their active participation in this investigation.
References
- Ahmed M. H., B. M. El Leithy, J. R. Thompson, R. J. Flower, M. Ramdani , F. Ayache& S. M. Hassan, 2009.Application of remote sensing to site characterisation and environmental change analysis of North African coastal lagoons . Hydrobiologia (2009) 622:147–171; DOI 10.1007/s10750-008-9682-8.
- Akumu C.E, S. Pathirana, S. Baban& D, Bucher, 2010.Monitoring coastal wetland communities in north-eastern NSW using ASTER and Landsat satellite data. Wetlands Ecol Manage (2010) 18:357–365;DOI 10.1007/s11273-010-9176-0.
- Apan, A. A., Raine, S. R., & Paterson, M. S. (2002). Mapping and analysis of changes in the riparian landscape structure of the Lockyer Valley catchment, Queensland, Australia. Landscape and Urban Planning, 59, 43–57. doi:10.1016/S0169-2046(01)00246-8.
- Avila J. I. E & A.C. Jimenez.Chapter 14 Regionalizing Coastal Zones with Geospatial Tools for Integrated Coastal Zone Management D.R. Green (ed.), Coastal and Marine Geospatial Technologies, Coastal Systems and 139, Continental Margins 13, DOI 10.1007/978-1-4020-9720-1_14.
- Backhaus, R., Bock, M., &Weiers, S. (2002). The spatial dimension of landscape sustainability. Environment, Development and Sustainability, 4, 237–251. doi:10.1023/A:1021138602157.
- Basnyat, P., Teeter, L. D., Kathryn, M., Flynn, K. M., &Lockaby, B. G. (1999).Relationships between landscape characteristics and nonpoint source pollution inputs to coastal estuaries. Environmental Management, 23(4), 539–549. doi:10.1007/s002679900208.
- Bottomley, B. R. (1998). Mapping rural land use and land cover change in Carroll County, Arkansas utilizing multi-temporal Landsat Thematic Mapper satellite imagery. Dissertation, University of Arkansas.http://www.cast.uark.edu/local/brandon_thesis/.
- Bürgi, M. (1999).A case study of forest change in the Swiss lowlands. Landscape Ecology, 14, 567–575. doi:10.1023/A:1008168209725.
- Chavez, P. S. (1996). Image-based atmospheric correctionsrevisited and improved. Photogrammetric Engineering andRemote Sensing, 62, 1025–1036.
- Cohen, W.B., Forella, M., Gray, J., Helmer, E., and Anderson, K. 1998. An efficient and accurate method for mapping forest clearcuts in the pacific Northwest using Landsat imagery. Photogramm. Eng. Remote Sens., 64: 293-300.
- Coskun, H. G., Gulergun, O., & Yilmaz, L. (2006).Monitoring of protected bands of Terkos drinking water reservoir of metropolitan Ë™Istanbul near the Black Sea coast using satellite data. International Journal of Applied Earth Observation and Geoinformation, 8, 49–60. doi:10.1016/j.jag.2005.06.003.
- Feoli, E., Vuerich, L. G., &Woldu, Z. (2002). Processes of environmental degradation and opportunities for rehabilitation in Adwa, Northern Ethiopia. Landscape Ecology, 17(4), 315–325. doi:10.1023/A:1020566801067.
- Göksel, C., Mercan, D. E., Kabdasli, S., Bektas, F., &Seker, D. Z. (2004). Definition of sensitive areas in a lakeshore by using remote sensing and GIS. Fresenıus Environmental Bulletin, 13(9), 860–864.
- Gulinck, H., Mugica, M., Lucio, J. V., &Atauri, J. A. (2001). A framework for comparative landscape analysis and evaluation based on land cover data, with an application in the Madrid region (Spain). Landscape and Urban Planning, 55, 257–270. doi:10.1016/S0169-2046(01)00159-1.
- Han, K. S., Champeaux, J. L., &Roujean, J. L. (2004). A land cover classification product over France at 1 km resolution using SPOT4/VEGETATION data. Remote Sensing of Environment, 92, 52–66. doi:10.1016/j.rse.2004.05.005.
- Hinrichsen, D. (1998). Coastal waters of the world: Trends, threats and strategies. ISBN 1 55963 383 2, 275 pages. Washington, D.C.: Island Pres.
- Sabins, F. F. (1987). Remote sensing: principles and interpretation.New York: W.H. Freeman.
- Iverson, L. R., Cook, E. A., & Graham, R. L. (1994). Regional forest cover estimation via remote sensing: The calibration center concept. Landscape Ecology, 9(3), 159–174. doi:10.1007/BF00134745.
- Kesgin B. ,EnginNurlu., 2009.Land cover changes on the coastal zone of CandarliBay,Turkey using remotely sensed data. Environ Monit Assess (2009) 157:89–96.DOI 10.1007/s10661-008-0517-x
- Kumar, G., Sahoo, R.N., Tomar, R.K., Bhavanarayana, M., Gupta, V.K., Rao, C.S., Sehgal, V.K. and Chakraborty, D. 2008. Land Use Land Cover Change in Active Flood Plain using Satellite Remote Sensing. Jour. Agric. Physics, Vol. 8, pp. 22-28.
- Kumar Srinivasa T., R.S. Mahendra, ShaileshNayak, K.Radhakrishnan, and K.C.Sahu., 2010.Coastal Vulnerability Assessment for Orissa State,East Coast of India.Journal of Coastal Research, Vol. 26, No. 3, 2010;DOI: 10.2112/09-1186.1
- Li, X. J., Peterson, J., Liu, G. J., & Qian, L. X. (2001). Assessing regional sustainability: The case of land use and land cover change in the middle Yiluo catchment of the Yellow River basin, China. Applied Geography (Sevenoaks, England), 21(1), 87–106.doi:10.1016/S0143-6228(00)00020-5.
- Lyon, J. G., Yuan, D., and Lunetta, R. S., Elvidge, C.D.; A change detection experiment using vegetation indices. Photogrammetric Engineering and Remote Sensing 1998, 64, 143-150.
- Mertens, B., &Lambin, E. (1999). Modelling land cover dynamics: Integration of fine-scale land cover data with landscape attributes. International Journal of Applied Earth Observation and Geoinformation, 1(1), 48–52. doi:10.1016/S0303-2434(99)85027-2.
- Metzger, J. P., & Muller, E. (1996).Characterizing the complexity of landscape boundaries by remote sensing. Landscape Ecology, 11(2), 65–77. doi:10.1007/BF02093740.
- Moody, A., & Woodcock, C. E. (1995).The influence of scale and the spatial characteristics of landscapes on land-cover mapping using remote sensing. Landscape Ecology, 10(6), 363–379. doi:10.1007/BF00130213.
- Nagendra, H., Pareeth, S., &Ghate, R. (2006). People within parks—forest villages, land-cover change and landscape fragmentation in the TadobaAndhari Tiger Reserve, India.Applied Geography (Sevenoaks, England), 26(2), 96–112. doi:10.1016/j.apgeog.2005.11.002.
- Nurlu, E., &Erdem, U. (2002).An overview of the Turkish coastal zone management within the framework of the European Union.In D. Camarda& L. Grassini (Eds.), Proceedings of the second meeting on “agriculture and urbanization in the mediterranean region. Enabling-policies for sustainable use of soil and water” (pp. 107–111), Options Mediterraneennes, Series: A, Mediterranean Seminars 53, Bari.
- Reid,R. S., Kruska, R. L., Muthui, N., Taye, A.,Wotton, S., Wilson, C. J., et al. (2000). Land-use and landcover dynamics in response to changes in climatic, biological and socio-political forces: The case of Southwestern Ethiopia. Landscape Ecology, 15, 339– 355.doi:10.1023/A:1008177712995.
- Sahin, S., & Kurum, E. (2002). Erosion risk analysis by GIS in environmental impact assessments: A case study—SeyhanKopru Dam Construction. Journal of Environmental Management, 66(3), 239–247. doi:10.1016/S0301-4797(02)90574-8.
- Saranya K.R.L., et al. (2014). Decadal time-scale monitoring of forest fires in Similipal Biosphere Reserve, India using remote sensing and GIS. Environ Monit Assess (2014) 186:3283–3296 DOI 10.1007/s10661-014-3619-7.
- Sengupta, S., &Venkatachalam, P. (1994).Health-hazard assessment in an industrial-town with the help of Gram-GIS. Environmental Monitoring and Assessment, 32(2), 155–160. doi:10.1007/BF00547133.
- Shalaby, A., &Tateishi, R. (2007). Remote sensing and GIS for mapping and monitoring land cover and land-use changes in the Northwestern coastal zone of Egypt. Applied Geography (Sevenoaks, England), 27(1), 28–41. doi:10.1016/j.apgeog.2006.09.004.
- U.S. EPA (2000). Projecting land-use change, a summary of models for assessing the effects of community growth and change on land-use patterns. EPA/600/R-00/098, from U.S. Environmental Protection Agency, Office of Research and Development, USA.
- Waser, L. T., Kuechler, M., Schwarz, M., Ivits, E., Stofer, S., &Scheidegger, C. (2007). Prediction of lichen diversity in an UNESCO biosphere reserve—correlation of high resolution remote sensing data with field samples. Environmental Modeling and Assessment, 12(4), 315–328. doi:10.1007/s10666-006-9066-2.
- Weiers, S., Bock, M., Wissen, M., &Rossner, G. (2004). Mapping and indicator approaches for the assessment of habitats at different scales using remote sensing and GIS methods. Landscape and Urban Planning, 67(1–4), 43–65. doi:10.1016/S0169-2046(03)00028-8.
- Yilmaz R., 2010. Monitoring land use/land cover changes using CORINE land cover data: a case study of Silivri coastal zone in Metropolitan Istanbul. Environ Monit Assess (2010) 165:603–615; DOI 10.1007/s10661-009-0972-z.


