Comparative Analysis of Artificial Neural Network (ANN) and Wavelet Integrated Artificial Neural Network (W-ANN) Approaches for Rainfall Modeling of Southern Rajasthan, India
Vinayak Paradkar1
*
 and H K Mittal2
1
Centre for Protected Cultivation Technology,
Indian Agricultural Research Institute,
New Delhi,
India
2
Department of Soil and Water Engineering,
Maharana Pratap University of Agriculture and Technology,
Udaipur,
Rajasthan
India
http://dx.doi.org/10.12944/CWE.18.3.17
Copy the following to cite this article:
Paradkar V, Mittal H. K. Comparative Analysis of Artificial Neural Network (ANN) and Wavelet Integrated Artificial Neural Network (W-ANN) Approaches for Rainfall Modeling of Southern Rajasthan, India. Curr World Environ 2023;18(3). DOI:http://dx.doi.org/10.12944/CWE.18.3.17
Copy the following to cite this URL:
Paradkar V, Mittal H. K. Comparative Analysis of Artificial Neural Network (ANN) and Wavelet Integrated Artificial Neural Network (W-ANN) Approaches for Rainfall Modeling of Southern Rajasthan, India. Curr World Environ 2023;18(3).
Download article (pdf) Citation Manager Publish History

Introduction
Rainfall holds significant importance for agricultural, domestic, industrial, and recreational purposes. The per capita availability of surface water in India was 2309 cubic meters in 1991 and decreased to 1902 cubic meters in 2001. Projections indicate a further decline to 1401 cubic meters by 2025 and 1191 cubic meters by 20501. The mounting pressure on water resources is a consequence of the escalating population2. The formation of rainfall involves intricate interplays of dynamic, thermodynamic, and cloud microphysical processes across vast spatial and temporal scales3. The stochastic nature of rainfall makes its prediction a formidable challenge. The complexity is amplified by the difficulties in accurate measurement at scales relevant to hydrology and climatology4.
Prolonged dry spells or heavy rains during critical crop growth stages can lead to substantial yield reductions, significantly impacting the national economy 5. Predicting rainfall patterns becomes pivotal in assessing the overall consequences of climate change6. Globally, the surge in urbanization, industrialization, and population growth has heightened water demand7. Studying extreme rainfall events holds paramount significance for water resources management8.
Rajasthan heavily relies on rainfall, averaging 594.9 mm annually, with significant variability and sporadic dry spells, particularly in the west9. Southwest monsoons contribute 75 to 95% of the yearly rain, primarily between June and September, crucial for local farmers10. Any kind of deficiency in monsoon, mostly because of climate change causes higher frequencies of droughts in the parts of country such as Rajasthan as high as once every four years11. Limited water resources, erratic rainfall, and repetitive droughts may lead to reduced agricultural and economic conditions in some parts12. Therefore, there is a need to adopt a proactive approach by strengthening the scientific advancement in predicting rainfall. Hydrological data, crucial for predicting rainfall, often exhibits a non-linear character13. Traditional models like regression models have limitations because they operate under the assumption that data is both linear and stationary. Such models do not deal with nonlinearities in the data14. An Artificial Neural Network (ANN) can be defined as a computer program which mimics the brain’s information processing using interconnected artificial neurons. These neurons form layers and are linked by coefficients, creating a neural structure. ANNs excel at capturing complex nonlinear relationships in data, especially when conventional mathematical models fall short15. They've proven highly beneficial in tasks like rainfall forecasting and runoff modelling due to their nonlinear nature. ANNs have been in use as forecasting models for the past two decades in various scientific areas16.
Recently, the combination of wavelet analysis and artificial neural networks, known as ‘W-ANN’, has gained attention for its superior predictive accuracy compared to individual ANN analysis17, 18.Breaking down a non-stationary data series into various levels through wavelet decomposition bring forth a way to understand the underlying structure of the series and extract meaningful historical information19. By incorporating wavelet-transformed series into forecasting models, a hybrid wavelet-ANN approach enhances predictive ability across different resolution levels20. The effectiveness of wavelet function types on ANN model performance remains underexplored. Initial instances of the wavelet-ANN model were applied to financial time series forecasting21, groundwater level prediction22, and rainfall runoff modelling23, yielding varying degrees of accuracy. Focussing these aspects, the present study was conducted for on evaluating various ANN and hybrid W-ANN models for rainfall prediction of southern Rajasthan, India.
Materials and Methods
Study Area
Southern Rajasthan is an important physiographic unit of the Rajasthan state, situated amidst the embrace of the Aravalli mountain ranges. It consists of a total of seven districts, out of which six districts viz. Banswara, Dungarpur, Pratapgarh, Udaipur, Chittorgarh, and Rajsamand formed the Udaipur division. Bhilwara district, although not situated within the Udaipur division, is considered a component of southern Rajasthan24.This region experiences an average annual rainfall ranging from 400 to 1100 mm. It is categorized into two agro-climatic zones: IV A, characterized as Sub-humid Southern, and IV B, classified as Humid Southern25. The geographical coordinates of the region span from 23°01’10” to 26°01’15” N latitude and 73°01’10” to 75°43’30” E longitude, covering an expanse of 50,510 km2. The seven districts in the study area viz. Banswara, Dungarpur, Pratapgarh, Udaipur, Chittorgarh, Rajsamand, and Bhilwara occupy an area of 5037, 3770, 4117, 11724, 10856, 4551 and 10455 km2, respectively. The research area covers a distance of around 210 km from the southernmost point to the northernmost point and extends approximately 240 km from the westernmost to the easternmost point. Figure 1 illustrates visual representation of the study area’s location.
 | Figure 1: A chart depicting the geographical location of the study area
|
Artificial Neural Networks (ANNs)
An ANN technique is successful in hydrological modelling due to its flexibility, efficiency with nonlinear and noisy data, and superior accuracy compared to other models15. ANNs are mathematical models inspired by brain activity, utilizing distributed storage and parallel processing16.
ANN Architecture
An ANN functions as a computational system comprised of artificial neurons, each serving as a processing element. This dynamic mathematical framework is adept at discerning intricate non-linear connections within input and output datasets26. An ANN consists of interconnected units, with each unit possessing input and output capabilities, executing localized computations or functions. The output of a unit is dictated by its input/output characteristics. The architecture of an ANN is shaped by the inter-neuron weights, an activation function governing output generation in each neuron, and learning laws that specify the significance of weights concerning input to a neuron. Incoming signals undergo multiplication with corresponding weights as they progress toward the neurons. These signals aggregate at the neurons, and the resulting net input is subjected to the activation function to generate the output. A typical ANN architecture is depicted in Figure 2.
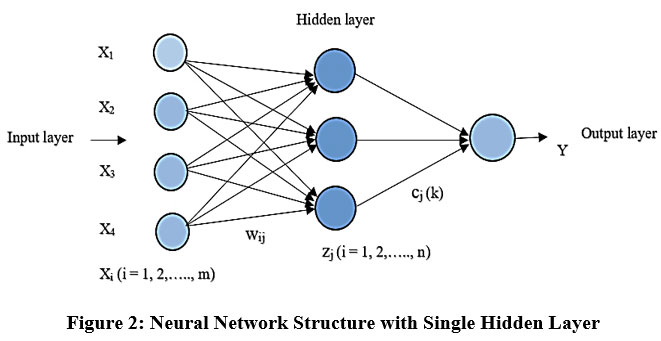 | Figure 2: Neural Network Structure with Single Hidden Layer
|
Let Xi (where, i=1,2,3,……..m) represent input characters and wi (where, i = 1,2,3,.....n) denote their respective weights. The node’s net input can be expressed by,
In this study, ANN models were formulated using ANN toolbox of MATLAB (R.2014a) software. The most widely used neural networks are Multilayer Perceptron (MLPs). As the hydrological state of the catchment area determines the catchment’s response to a rainfall event and due to intricate nature of the atmospheric events that generate precipitation, previous rainfall values are often used as input variables to ANN models3. In the situations where comprehensive data on the required temporal and spatial scales is lacking, past rainfall values are commonly employed as inputs for ANNs. This approach is chosen because past rainfall serves as an indirect indicator of the hydrological state. The study focused on developing three distinct ANN model categories for predicting rainfall at specific stations within the designated area (Table 1).
ANN Model A (Input Layer with Six Neurons): This model incorporated six neurons in the input layer, considering the rainfall data from the corresponding week over the previous three years and the rainfall of the three preceding weeks from the same year.
ANN Model B (Input Layer with Eight Neurons): Model B featured eight neurons in its input layer, encompassing the rainfall information for the same week over the previous four years and the rainfall of the four weeks preceding the current week in the same year.
ANN Model C (Input Layer with Ten Neurons): Model C was designed with ten neurons in its input stratum, utilizing the rainfall data from the same week over the previous five years and the rainfall of the five preceding weeks from the current year.
Table 1: Input and output data used for training of ANN models
| Category | Neurons in the input stratum | Neurons in the output stratum |
Model A | P(m-1), P(m-2), P(m-3) & P(M-1), P(M-2), P(M-3) | P(m) (Precipitation of mth week) |
Model B | P(m-1), P(m-2), P(m-3), P(m-4) & P(M-1), P(M-2), P(M-3), P(M-4) | P(m) (Precipitation of mth week) |
Model C | P(m-1), P(m-2), P(m-3), P(m-4), P(m-5) & P(M-1), P(M-2), P(M-3), P(M-4), P(M-5) | P(m) (Precipitation of mth week) |
In Table 1, Pm-n is the precipitation of the preceding ‘n’ week of the same year; RM-n is the precipitation of the same week of the preceding previous ‘n’ year.
An essential consideration in ANNs involves determining the optimal configuration, including the quantity of latent stratums and the respective quantity of neurons within each stratum. There is no systematic method but a trial and error procedure is still being preferred choice of most users27. The quantity of neurons in a latent layer is influenced by variables like input characters, output layer size, training cycles, noise in data, architecture, activation functions, and learning algorithms. While rules like having twice the input neurons can be helpful28, 29, a more accurate approach is multiplying 0.67 with the input-output sum30 or using (2n+1) based on input neurons31. However, the most effective method is experimenting with various hidden unit counts during training32. The quantity of neurons in the latent stratum ranged from 1 to 20. The decision on how many training cycles to use depends on the learning algorithm employed and the non-linearity between input-output. In the present study, a logsigmoid transfer function was used for generating outputs in ANNs. All neural network architectures were trained with the goal of a mean square error of 0.01 during both training and validation.
Learning Algorithms
A learning or training algorithm is a mathematical function that optimizes an error in order to modify the link weights. Two common types of algorithms used in this study are Levenberg Marquardt or L-M framework and the Resilient Back Propagation or R-P framework. L-M algorithm also denoted by trainlm, is a network training function that adjusts and refines the weights and bias values as per the L-M optimization33. It is the fastest backpropagation algorithm in the ANN toolbox and needs lesser learning cycles34. Theresilient backpropagation algorithm also denoted by trainrp, is a network training function that adjusts and refines the weights and biases as per the R-P algorithm35. This algorithm requires only a modest increase in memory36.
In the present study, the rainfall data from the year 1973 to 2022 i.e. 50 years of data was used for rainfall forecasting. Out of this, two-thirds part i.e. 33 years of data (from 1973 to 2005) was used for model development and one-third part i.e. 17 years of data (from 2006 to 2022) was used for model validation. ANN models were trained by adjusting interconnection weights for input-output matching. Training stopped based on validation dataset error increase. This approach helped select the best-performing ANN model. Performance assessment employed Pearson’s Correlation (R), Root Mean Squared Deviation (denoted as RMSE), and Average Absolute Deviation (denoted as MAE) on the validation set.
Wavelet based Artificial Neural Networks (W-ANNs)
While artificial neural networks (ANN) offer flexibility in modeling hydrological time series, they present limitations when dealing with highly non-stationary signals in hydrologic processes that exhibit seasonal variations. To address this challenge, the wavelet transform emerges as a valuable tool, capable of decomposing non-stationary data series into sub-levels at various scales37. This decomposition aids in enhancing the interpretation of the hydrological process. In recent years, the wavelet transform has demonstrated success in various engineering applications38. Its application extends to the investigation of the time-frequency characteristics of long-term climatic data39. The wavelet transform's ability to provide insightful decompositions of primary time series allows for an improved understanding of the underlying processes at various resolution levels20. Consequently, integration of an ANN coupled wavelet function results in a hybrid structure known as the wavelet-ANN (denoted as W-ANN). This hybrid approach proves effective in simultaneously capturing frequency and time-domain information from the signal, offering a robust framework for predicting hydrological processes40.
Wavelet Transform
Wavelets can be characterized within realm of mathematics and used to provide a representation of time series data in terms of time scales along with their interrelationships18. The process of wavelet analysis involves employing a mother wavelet function for the transformation. Wavelet transforms can be conducted in a continuous form, known as continuous wavelet transform (CWT), or a discrete form, referred to as discrete wavelet transform (DWT). Overall, wavelet transforms serve as a valuable tool for investigating time series, offering insights that contribute to forecasting and other empirical analyses39.
Continuous Wavelet Transformation
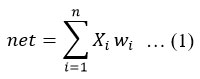
The wavelet transformation on time-scale basis of a continuous data signal, (?), is defined as follows41,
Where, g* denotes the complex conjugate and (?) is defined as mother wavelet. The character ? plays a role of dilation coefficient, while ? refers to a time shift of the f(?), which permits the signal around ? for the evaluation.
Discrete Wavelet Transformation
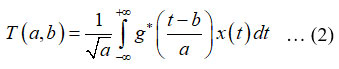
One straightforward discretization method for the CWT involves employing the trapezoidal rule. In this approach, N2 coefficients are generated from a dataset of length N. However, it results in redundant information encapsulated within these coefficients, which may or may not be advantageous42. To address this redundancy, an alternative is to adopt logarithmic continuous spacing for discretization of the scale. This choice allows for a better resolution of the b number of locations, enabling N transform factors to effectively denote a signal of capacity N. A discrete wavelet can be represented by,
Where, m and n denote integers which control the expansion and transcription, respectively; a0 is a particular expansion factor greater than 1; and b0 denote the position character which must be greater than 0. The commonly used and simple choice for these characters are a0 = 2 and b0 = 143.
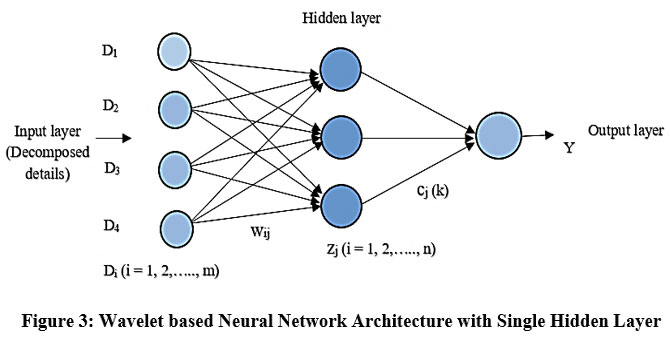
Haar wavelet is the most suitable wavelet for modeling applications because it shows shift invariant property44. It has better localization properties because it is a low pass filter concentrated over the narrowest support band45. Therefore, in this study, by the Haar wavelet decomposition process, the original data series was hierarchically converted into n-level sub series at different frequency bands to reduce the noise. The sub series, i.e. decomposed details derived from the original time series by using discrete wavelet transforms were used as input for ANN to develop hybrid wavelet based ANN models. Thereafter, the procedure opted for training and validation of ANN models was also adopted for W-ANN models. A typical W-ANN architecture is shown in Figure 3.
 | Figure 3: Wavelet based Neural Network Architecture with Single Hidden Layer.
|
Where, Di (where, i=1,2,3,……..m) are decomposed input characters and wi (where, i = 1,2,3,.....n) are their respective weights.
The research of 21, 22 derived the following equation to find the appropriate decomposition scale of the main time series.
Where, Y and Z are decomposition scale and length of the series, respectively. The performance of formulated W-ANN frameworks was evaluated in terms of the same statistical indices as used for evaluating ANN models. The performance of W-ANN frameworks was juxtaposed to that of ANN architectures.
Results
Rainfall Forecasting using Artificial Neural Network (ANN) Techniques
It was observed that, significant rainfall occurred from meteorological week 22 (MW-22) to meteorological week 42 (MW-42). The investigation into rainfall distribution in southern Rajasthan indicated that the weekly mean rainfall during the monsoon period (MW-22 to MW-42) exhibited a range from 2.1 to 68.4 mm, accompanied by corresponding standard deviations ranging from 9.3 to 79.7 mm. The selection of suitable ANN architecture for weekly rainfall forecasting was done based on training and validation data sets. The statistical performance of different models was evaluated for the training and validation phase. For Model A, the training period was 33 years (1976 to 2008) and the validation period was 14 years (2009 to 2022). Similarly, for Model B and Model C, the training period was 32 years (1977 to 2008) and 31 years (1978 to 2008), respectively.
Performance Evaluation of ANN Models for Varying Number of Inputs
It was observed that, Model C was best fitted for 74% of the selected stations followed by Model B (21% of stations) and Model A (5% of stations), respectively. Model A with six inputs was the lowest in terms of performance parameters. The performance measures R, MAE and RMSE for best fit ANN models in all three categories for the Arthuna station (as an example) are shown in Table 2. The comparison between actual and forecasted rainfall for the Arthuna station using best fitted ANN architecture 10-16-1 (Model C) during the second stage of the validation phase (2016-2022) is shown in Figure 4.
Table 2: Performance Metrics for Best Fit ANN Architectures for Arthuna Station
ANN Model (Best Fit) | Performance Measures | ||||||||
Training | Validation | Overall | |||||||
R | MAE | RMSE | R | MAE | RMSE | R | MAE | RMSE | |
6-12-1 | 0.811 | 6.111 | 1.286 | 0.801 | 5.613 | 1.309 | 0.806 | 5.862 | 1.297 |
8-11-1 | 0.832 | 5.226 | 1.201 | 0.829 | 5.322 | 1.205 | 0.830 | 5.274 | 1.203 |
10-16-1 | 0.854 | 4.812 | 1.147 | 0.867 | 4.624 | 1.125 | 0.860 | 4.718 | 1.136 |
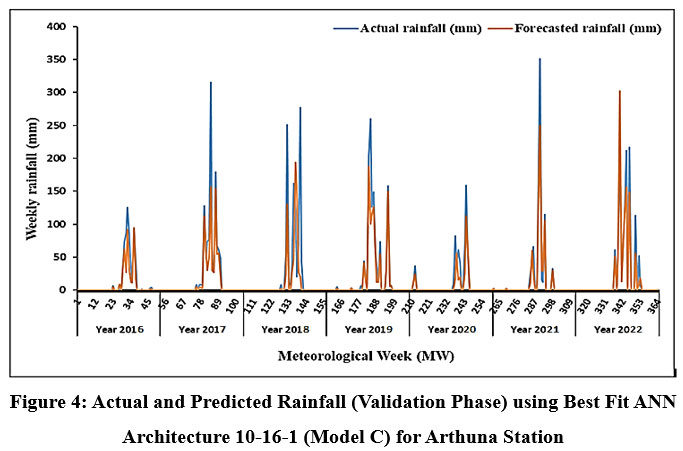 | Figure 4: Actual and Predicted Rainfall (Validation Phase) using Best Fit ANN Architecture 10-16-1 (Model C) for Arthuna Station
|
Performance Evaluation of ANN Models for Varying Neurons in Latent Layer
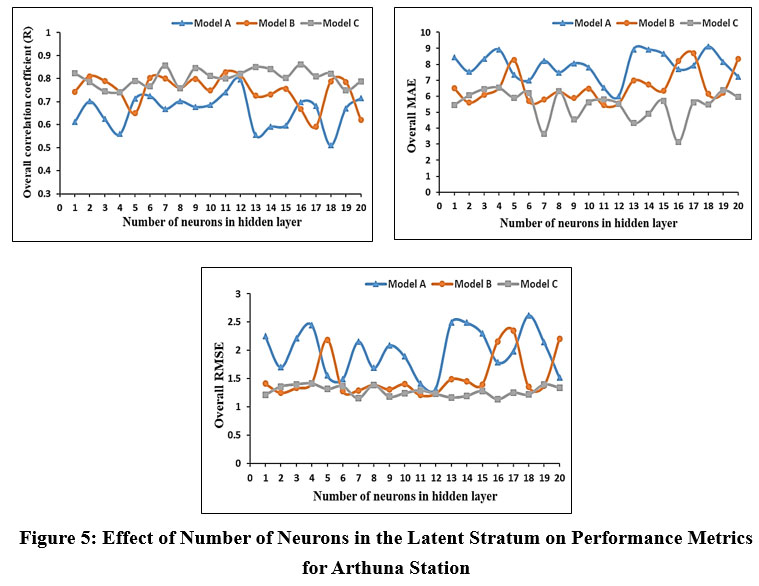
Three ANN categories with varying numbers of input characters were examined for different numbers of neurons (1-20) in the hidden stratum. The appropriate numbers of neurons in the latent layer of ANN models were decided on trial and error basis. It was observed that, the change in the quantity of neurons in the latent stratum not considerably affected the performance of models. R values in the training and validation phase changed with the change in the quantity of neurons in the latent layers for all categories of models. The overall R value remained nearly constant for different combinations of neurons in latent layer. The similar type of pattern was found in case of RMSE and MAE also. The change in overall value of performance indices R, MAE and RMSE with varying number of neurons in the latent stratum for Arthuna station is presented in Figure 5. It can be noted that, the highest value of overall R (0.861) in Model C was noted for 16 neurons in latent layer. Similarly, lowest values of MAE (3.121) and RMSE (1.132) in Model C were obtained for 16 neurons in latent layer. Therefore, ANN architecture 10-16-1 (Model C) was best fitted for Arthuna station. Similar process was undertaken for finding optimum number neurons in the latent layer for all stations in the study area.
 | Figure 5: Effect of Number of Neurons in the Latent Stratum on Performance Metrics for Arthuna Station
|
Rainfall Prediction using Hybrid Wavelet based Artificial Neural Network (W-ANN)
A black-box structure such as an ANN tends to underestimate peak values in time series data when confronted with sudden extreme inputs, such as heavy rainfall. In contrast, models like W-ANN, which incorporate information from current and past time steps with a focus on long-term periodicity memory, leverage historical data of extreme events to improve the accuracy of peak value forecasts. This approach allows for a more nuanced understanding and prediction of extreme occurrences in the time series46.
In the present study, the main rainfall data series was decomposed at various levels using the wavelet toolbox in MATLAB R2014a software. The decomposed details from discrete wavelet transform were then used as an input to ANN models as stated earlier and the performance of models was examined by the same statistical metrics as used in simple ANN models. Only the best fit models in simple ANN were used to formulate hybrid W-ANN models and their performance was compared.
Development of Hybrid W-ANN Models
Wavelet analysis was employed during the data pre-processing phase, enabling the extraction of low-frequency data over extended time intervals and high-frequency data over shorter time intervals. In the decomposition process using Haar wavelet, the original input data series was hierarchically converted into 3-level sub series at different frequency bands for reducing the noise according to equation 4. The original and approximation time series at decomposition level 3 in the validation phase for best fit ANN model (10-16-1) for Arthuna station is shown in Figure 6. The first data series is the original signal followed by decompositions at level 3 using wavelet transform. The main signal underwent decomposition at level 3 using the Haar wavelet, resulting in 4 sub-signals (level 3 coarse representation and level 1, 2, and 3 fine intricacies). These four sub-signals serve as input layer neurons for the development of optimal ANN models for each station.
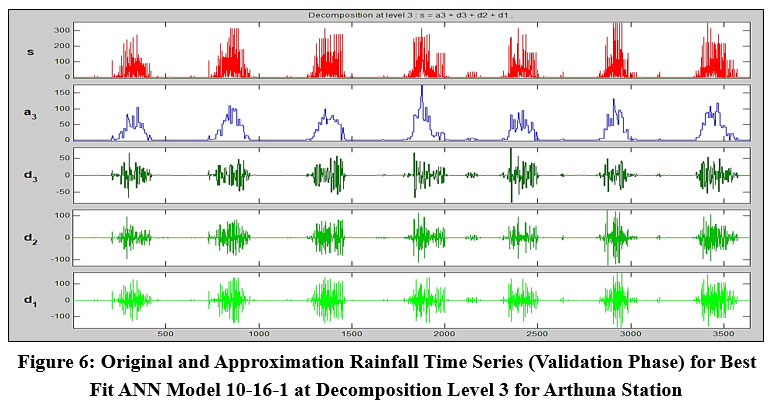 | Figure 6: Original and Approximation Rainfall Time Series (Validation Phase) for Best Fit ANN Model 10-16-1 at Decomposition Level 3 for Arthuna Station
|
Performance Evaluation of W-ANN Models
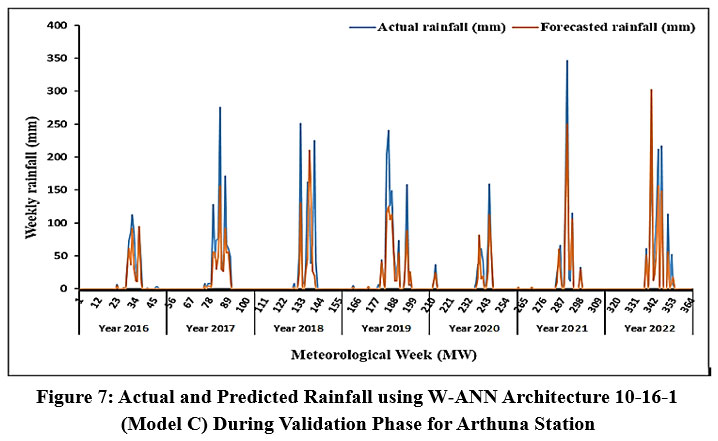
The evaluation of W-ANN architectures was done using the same statistical measures as used for ANN models. The performance measures for best fit W-ANN model 10-16-1 (Model C) for Arthuna station are shown in Table 3. It can be seen that, R, MAE and RMSE values were 0.868, 3.267 and 1.125, respectively. The value of R in the training phase (0.861) was increased in the validation phase (0.875) due to shorter period of data used in the validation phase than in the training phase. The pictorial representation of actual and predicted rainfall using best fit W-ANN architecture during the second stage of the validation phase (on unseen data from 2016-2022) for selected stations is shown in Figure 7.
Table 3: Performance Measures for Model C (W-ANN) Model for Arthuna Station
W-ANN Model (Best Fit) | Performance Measures | ||||||||
Training | Validation | Overall | |||||||
R. | MAE. | RMSE. | R. | MAE. | RMSE. | R. | MAE. | RMSE. | |
10-16-1 | 0.861 | 3.492 | 1.135 | 0.875 | 3.043 | 1.116 | 0.868 | 3.267 | 1.125 |
 | Figure 7: Actual and Predicted Rainfall using W-ANN Architecture 10-16-1 (Model C) During Validation Phase for Arthuna Station.
|
Comparison of ANN and W-ANN model performance
It was observed that, out of 58 stations, for 47 stations (81% of stations) the performance of W-ANN models was improved in terms of statistical metrics due to useful decomposition and extraction of information at appropriate resolution level. For 7 stations (12% of stations) the performance of W-ANN models was at par with that of ANN models, while for the remaining 4 stations (7% of stations) the performance of wavelet based models was observed poor than ANN models. Comparison analysis of performance indices of ANN and wavelet coupled ANN models in different phases for Arthuna station is presented in Figure 8.
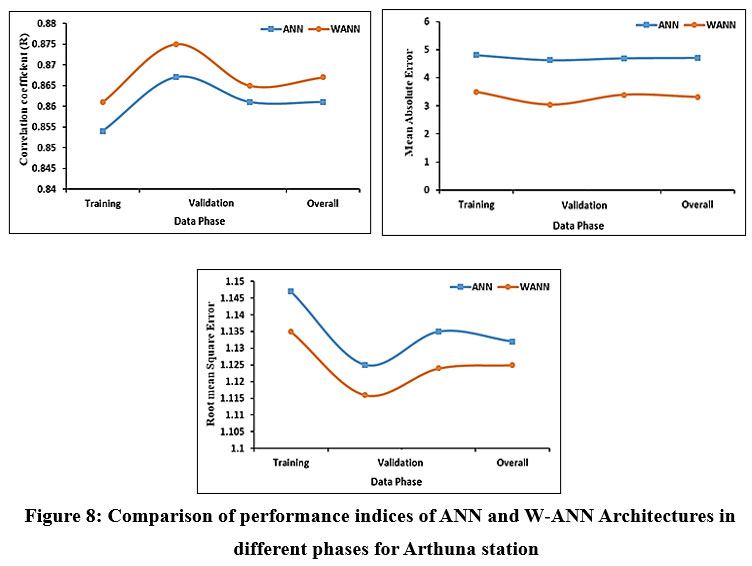 | Figure 8: Comparison of performance indices of ANN and W-ANN Architectures in different phases for Arthuna station
|
Discussion
It was found that, an increasing number of input variables increased the correlation coefficient (R) values subsequently in the training and validation phase. The highest values of R were observed in Model C with ten inputs. The values of R were higher in the validation phase as compared to the training period, which indicated that ANN performed better in the validation phase of Model C. In the case of Model A and Model B, the values of R during the training phase were highest followed by the validation phase respectively for most of the stations. The use of a simulated network (only input values) in the validation phase may cause a lower value of R. Therefore, a higher number of inputs substantially enhanced the model’s performance across the majority of stations.47, 48, 49 reported improvements in ANN model performance with increased number of inputs.
The increase in the quantity of neurons in the latent stratum up to 10 did not have a significant impact on the model’s performance. However, between 10 to 20 neurons their performances improved in the form of R, MAE and RMSE for most of the selected stations. 14, 50, 51 reported improvement in ANN model performance between 10 to 20 neurons in the latent stratum. Thus, all three categories of models performed better with more number of neurons in the latent stratum.
Hybrid W-ANN models found superior than simple ANN models for rainfall forecasting of southern Rajasthan. 18, 41, 39, 20 also reported that wavelet based hybrid ANN models provide better accuracy as compared to ANN models due to the useful decomposition of original time series for extraction of information with reduced noise. The comparative performance of ANN and wavelet coupled ANN models in all phases for the Arthuna station is graphically depicted in Figure 3.5. Overall, W-ANN model found superior in all phases as compared to the simple ANN model due to the useful decomposition of inputs to model.
Conclusion
In this research, various ANN and wavelet based ANN architectures were employed for rainfall forecasting of southern Rajasthan. Model category C with ten neurons in the input layer was best fitted for 74% of the selected stations followed by Model B (21% of stations) and Model A (5% of stations), respectively. Model A with six inputs was the lowest in terms of performance parameters. Therefore, the increased number of inputs significantly improved the performance of models in most of the stations. The models showed consistent performance across an increase in the number of neurons in the latent stratum up to 10. However, a remarkable enhancement in the performance was observed as the number of neurons increased from 10 to 20. All three categories of models performed better with more neurons in the latent stratum. Hence, the most effective category of the ANN model for predicting weekly rainfall in southern Rajasthan involved using the rainfall data from the same week over the past five years, along with the rainfall data from the preceding five weeks in those respective years as input variables. Out of 58 stations, for 47 stations (81% of stations) the performance of W-ANN models was improved in terms of statistical indices due to useful decomposition and extraction of information at the appropriate resolution level. For 7 stations (12% of stations) the performance of wavelet coupled ANN models was at par with that of ANN models, while for the remaining 4 stations (7% of stations) the performance of wavelet coupled ANN models was observed poor than ANN architectures. Therefore, hybrid W-ANN models found superior than simple ANN models for rainfall forecasting of southern Rajasthan. The comparison of actual and forecasted values of rainfall revealed that both ANN and W-ANN models forecast weekly rainfall satisfactorily. The hybrid W-ANN model provides greater accuracy than the ANN model for rainfall forecasting based on higher values of the R, and lower values of the MAE, and RMSE.
Acknowledgement
I express my sincere regards, to MPUAT Udaipur, for providing necessary facilities for completion of this study and heartfelt gratitude to Dr. H. K. Mittal, Professor, Department of Soil and Water Engineering, MPUAT, Udaipur for his valuable suggestions and insightful decision provided for entire work.
Conflict of Interest
The author(s) declares no conflict of interest.
Funding Sources
The author(s) received no financial support for the research, authorship, and/or publication of this article.
References
- Bhattacharyya, A., Reddy, S. J., Ghosh, M., Naika, R. H. Water resources in India: its demand, degradation and management. International Journal of Scientific and Research Publications. 2015; 5: 346-356.
- Kumar, V., Jain, S. K., Singh, Y. Analysis of long-term rainfall trends in India. Hydrological Sciences Journal. 2013; 55: 484-496.
- Sojitra, M., Purohit, R. C., Pandya, P., Kyada, P. Short duration rainfall forecasting modelling through ANNs. Scientific Journal of Agril. Engg. 2016; 4: 11-20.
- Manoj, K., Kumar, P. P. Climate change, water resources and food production: some highlights from India’s standpoint. International Research Journal of Environment Sciences. 2013; 2: 79-87.
- Venkateswarlu, B. Rainfed agriculture: strategies for livelihood enhancement. ICAR sponsored training course on Sustainable agriculture production through Innovative approaches for enhanced livelihoods, 2-15th Sept. 2011.
- Roy, P. K., Mazumdar, A. Water resources in India under changed climate scenario. International Journal of Engineering Research and Applications. 2013; 3: 954-961.
- Verma, S., Phansalkar, S. India’s water future 2050. International Journal of Rural Management. 2007; 3: 149-79.
- Cronin, A. A., Prakash, A., Priya, S., Coates, S. Water in India: situation and prospects. Water Policy. 2014; 16: 425-441.
- Rathore, M. S. State level analysis of drought policies and impacts in Rajasthan, India. Working paper 93, Drought series paper no. 6, International Water Management Institute, Colombo, Sri Lanka. 2004.
- Rathore, N. S., Verma, N. Impact of climate change in the southern Rajasthan, India. International Journal of Water Resources and Arid Environments. 2013; 2: 45-50.
- Gupta, A. K., Tyagi, P., Sehgal, V. K. Drought disaster challenges and mitigation in India: strategic appraisal. Current Science. 2011; 100: 1795-1806.
- Mundetia, N., Sharma, D. Analysis of rainfall and drought in Rajasthan state, India. Global NEST Journal. 2014; 16: 1-10.
- Belayneh, A., Adamowski, J. Standard precipitation index drought forecasting using wavelet neural networks and support vector regression. Applied Computational Intelligence and Soft Computing. 2012; 6: 1-13.
- Mishra, A. K., Desai, V. R. Drought forecasting using feed forward recursive neural network. Ecological Modelling. 2006; 198: 127-138.
- French, M. N., Krajewski, W. F., Cuykendall, R. R. Rainfall forecasting in space and time using a neural network. Journal of Hydrology. 1992; 137: 1-31.
- Cutore, P., Mauro, G. D., Cancelliere, A. Forecasting palmer index using neural networks and climatic indexes. Journal of Hydrologic Engineering. 2009; 14: 588-595.
- Wei, S., Yang, H., Song, J., Abbaspour, K., Xu, Z. A wavelet-neural network hybrid modelling approach for estimating and predicting river monthly flows. Hydrological Sciences Journal. 2013; 58: 374-389.
- Shoaib, M., Shamseldin, A. Y., Melville, B. W. Comparative study of wavelet based neural network models for rainfall modelling. Journal of Hydrology.2014; 515: 47-58.
- Cannas, B., Fanni, A., Sias, G., Tronci, S., Zedda, M. K. River flow forecasting using neural networks and wavelet analysis. Geophysical Research Abstracts. 2005; 7: 1607.
- Nourani, V., Komasi, M., Mano, A. A multivariate ANN-Wavelet approach for rainfall-runoff modelling. Water Resources Management. 2009; 23: 2877-2894.
- Aussem, A., Campbell, J., Murtagh, F. Wavelet based feature extraction and decomposition strategies for financial forecasting. Journal of Computational Intelligence in Finance. 1998; 6: 5-12.
- Wang, W., Ding, J. Wavelet network model and its application to the prediction of hydrology. Nature and Science. 2003; 1: 67-71.
- Nourani, V., Baghanam, A. H., Adamowski, J., Kisi, O. Applications of hybrid wavelet-artificial intelligence models in hydrology: A review. Journal of Hydrology. 2014; 514: 358-377.
- Gupta, N. K., Jethoo, A. S., Gupta S. K. Rainfall and surface water resources of Rajasthan state, India. Water Policy. 2016; 18: 276-287.
- Hussain, M. Agro-climatic zones and economic development of Rajasthan. International Journal of Humanities and Social Science Invention. 2015; 4: 50-57.
- Brath, A., Montanari, A., Toth, E. Neural networks and non-parametric methods for improving real time flood forecasting through conceptual hydrological models. Hydrology and Earth System Sciences. 2002; 6: 627-640.
- Shamseldin, A. Y. Artificial neural network model for river flow forecasting in a developing country. Journal of Hydroinformatics. 2010; 12: 22-35.
- Swingler, K. Applying Neural Networks: A Practical Guide, London: Academic Press. 1996.
- Berry, M. J., Linoff, G. Data Mining Techniques, NewYork: John Wiley & Sons. 1997.
- Ouhmad, S., Halimi, A. The impact of number of neurons in the hidden layer on the performance of MLP neural network: Application to the fast identification of toxic gases. International Journal of Computer and Information Engineering. 2014; 8: 2060-2064.
- Fletcher, D. S., Goss, E. Forecasting with neural network: An application using bankruptcy data. Information Management. 1993; 24: 159-167.
- Sarle, W. S. Neural Network FAQ, part 1of 7: Introduction, periodic posting to the Usenet newsgroup nets, URL:ftp://ftp.sas.com/pub/neuraI/FAQ.html. 1997.
- Comert, Z., Kocamaz, A. F. A study of artificial neural network training algorithms for classification of cardiotocography signals. Bitlis Fren University Journal of science and Technology. 2017; 7: 93-103.
- Jaddi, N. S., Abdullah, S. Optimization of neural network using kidney-inspired algorithm with control of filtration rate and chaotic map for real-world rainfall forecasting. Engineering Applications of Artificial Intelligence. 2018; 67: 246-259.
- Adeoti, O. A., Osanaiye, P. A. Effect of training algorithms on the performance of ANN for pattern recognition of bivariate process. International Journal of Computer Applications. 2013; 69: 8-12.
- Sharma, B., Venugopalan, K. Comparison of neural network training functions for hematoma classification in brain CT images. IOSR Journal of Computer Engineering. 2014; 16: 31-35.
- Kisi, O. Neural networks and wavelet conjunction model for intermittent stream flow forecasting. Journal of Hydrologic Engineering. 2009; 14: 773-782.
- Huang, M. C. Wave parameters and functions in wavelet analysis. Ocean Engineering. 2004; 31: 111-125.
- Ramana, R. V., Krishna, B., Kumar, S. R., Pandey, N. G. Monthly rainfall prediction using wavelet neural network analysis. Water Res. Management. 2013; 27: 3697-3711.
- Mirbagheri, S. A., Nourani, V., Rajaee, T., Alikhani, A. Neuro-fuzzy models employing wavelet analysis for suspended sediment concentration prediction in rivers. Hydrological Sciences Journal. 2010; 55: 1175-1189.
- Solgi, A., Nourani, V., Pourhaghi, A. Forecasting daily precipitation using hybrid model of wavelet-artificial neural network and comparison with adaptive neuro fuzzy inference system. Advances in Civil Engineering. 2014; 14: 1-12.
- Wang, H. Clustering of hydrological time series based on discrete wavelet transform. Physics Procedia. 2012; 25: 1966-1972.
- Tan, R., Perkowski, M. Wavelet coupled machine learning methods for drought forecast utilizing hybrid meteorological and remotely sensed data. Proceedings of the International Conference on Data Mining. 2015.
- Maheswaran, R., Khosa, R. Wavelet-volterra coupled model for monthly stream flow forecasting. Journal of Hydrology. 2012; 450: 320-335.
- Kim, T., Valdes, J. B. Nonlinear model for drought forecasting based on a conjunction of wavelet and neural networks. Journal of Hydrologic Engineering. 2003; 8: 319-328.
- Nourani, V., Kisi, O., Komasi, M. Two hybrid artificial intelligence approaches for modelling rainfall-runoff process. Journal of Hydrology. 2011; 402: 41-59.
- Charaniya, N. A., Dudul, S. V. Committee of artificial neural networks for monthly rainfall prediction using wavelet transform. International Conference on Business, Engineering and Industrial Applications. 2011; 7: 126-129.
- Luk, K. C., Ball, J. E., Sharma, A. An application of artificial neural networks for rainfall forecasting. Mathematical and Computer Modelling. 2001; 33: 683-693.
- Tokar, A. S., Johnson, P. A. Rainfall-runoff modelling using artificial neural networks. Journal of Hydrologic Engineering. 1999; 4: 232-239.
- Dubey, A. D. Artificial neural network models for rainfall prediction in Pondicherry. International Journal of Computer Applications. 2015; 120: 30-35.
- Kothari, M., Gharde, K. D. Application of ANN algorithms for streamflow modelling of Savitri catchment. Journal of Earth System Science. 2015; 124: 933-943.


