Urban/Suburban Park Use: Links to Personal Identity?
Rebecca Jordan1 , Amanda Sorensen2 and Daniel Clark2
1
Human Ecology,
Rutgers University,
New Brunswick,
NJ
USA
2
Ecology and Evolution,
Rutgers University,
New Brunswick,
NJ
USA
http://dx.doi.org/10.12944/CWE.10.2.01
Public greenspaces provide an opportunity for community members to engage with the outdoors. In many locations, however, parks are under used. In an effort to gauge the potential for outdoor interaction and ecosystem education, we conducted a survey of residents from a central New Jersey, USA, county. Our correlation analysis indicated that park use could be related to socioeconomics and in particular education, environmental literacy, pet ownership, outdoor enjoyment and preferred environment. Variables relating to mood and other personal characteristics were more strongly associated with individual identity characteristics. Through multivariate analyses, we offer an organizing framework that can help tailor outdoor greenspace improvement/restoration and programming to identity categories. These categories are a combination of where an individual lives, enjoyment of the outdoors, education and socio-economics, sense of community, institutional trust, and pet ownership.
Copy the following to cite this article:
R. Jordan, A. Sorensen, D. Clark, R. Jordan, A. Sorensen and D. Clark. Urban/Suburban Park Use: Links to Personal Identity? Curr World Environ 2015;10(2) DOI:http://dx.doi.org/10.12944/CWE.10.2.01
Copy the following to cite this URL:
R. Jordan, A. Sorensen, D. Clark, R. Jordan, A. Sorensen and D. Clark. Urban/Suburban Park Use: Links to Personal Identity? Curr World Environ 2015;10(2) Available from: http://www.cwejournal.org?p=777/
Download article (pdf)
Citation Manager
Publish History
Introduction
Green spaces provide human social and health benefits.1 They can also address broader ecological needs for local and regional benefit.2 With only one-fifth of the US population engaging in sports and recreation activity,3 green spaces are, on average, under used. In this note, we provide evidence showing that activity designers seeking to engage the public in green space could benefit from understanding park use and environmental literacy at the local levels.
There has been much study into the benefits of maintaining public park lands (hereafter green space). While green space use and human health and mood, in particular, has garnered much research attention (see review in [1]), connections between these spaces and increases in community capital have also been drawn (e.g., [4]). Such investigations have brought to light the disparities between access to desired and undesired green spaces.5 These authors provide evidence that parks can serve to further isolate socio-ecologically disadvantaged communities, underscoring the need to not only provide green life in these spaces but also sufficient amenities (e.g., safe location, motivating scenery, positive use, and ample facilities.6
Given this link between access, advantage, and benefit of green space, urban environments are attracting researcher attention regarding public use (e.g., [7]). Such studies support the notion that urban green space use varies by location, age, gender, and race.8,9 This variation aside, it is clear that these spaces are underused3 compared to capacity and in some cases are seen as detrimental.5
There is, however, the potential to increase park use with targeted intervention and promotion of community activity (e.g., movements such as Ciclovia10; or direct park amenification11). Indeed, use of parks has been shown to increase when members of the surrounding community were engaged, versus not being involved, in decision-making about park features and amenities.12 At the very least, simple consultation with residents about resource management was sufficient to increase positive perception of the benefits of a protected greenspace.13 Beyond consultation and awareness, there is evidence to suggest that targeted activities/events in greenspaces, not only increases park use, but also contributes to a more positive view of that park.14 These authors caution, however, that direct park amenification is not sufficient to increase park use. Rather park use is correlated to a number of park user-related factors. These studies suggest that questions regarding the lifestyle practices and use of local and regional green spaces need to be addressed, especially across urban and exurban landscapes where a myriad of park perceptions and associated differences in park quality exist
In response to this need, we designed a questionnaire to learn more about local and regional green space use. We report here the results from this preliminary survey. Based on these data, we make recommendations for the types of outdoor educational intervention that will foster environmental literacy.
Methods
We selected residents from a stratified random sample of NJ postal addresses in Middlesex County. This survey encompassed 6 townships and residents were all within 0.5miles of a green space/park. This area of New Jersey was chosen because of the increasing levels of urbanization across a broad range of socio-economic backgrounds.
We designed and validated a questionnaire with multiple sections: local and regional park use, environmental literacy and self-report about environmental literacy, scientific practices, trust in information sources, characteristics about oneself and demographic information. We asked about preferred park features but report those results elsewhere. The full questionnaire can be found in the Appendix. All work was conducted with Rutgers University Institutional Review Board approval.
The process of design began with a list of constructs (Table 1). Given our interest in offering outdoor educational interventions, we choose to focus on environmental and science literacy, personality, trust, and demographics as these have been shown to be important drivers environmental behavior change.15 Items were originally selected form Jordan’s previous work; with the exception of the environmental literacy questions that were taken from a standardized Environmental Literacy assessment.16 A few additional questions were added to fill in gaps.
Table1: Description of questionnaire variables and constructs. #Qs refers to the number of questions related to that construct.
|
Variable Categories |
Specific constructs about which questions were developed |
#Qs |
|
Parks |
Local and Regional Park Use, Quality, and Enjoyment |
7 |
|
Environmental Literacy |
Attitude toward nature Views about environment and environmentalism Environmental Knowledge questions Assignment of responsibility toward care of the environment |
1 4 5 3 |
|
Ideas about Science |
Science process Science defined |
3 1 |
|
Trust in information Sources |
Corporate Institutions Local organizations and groups Print Media Television/Radio Federal Government |
1 5 3 3 1 |
|
Individual Characteristics |
Anxiety/Depression Scale Interest in Learning Self-Report humor, optimism, health, activity level, and intelligence |
4 4 6 |
|
Demographic information |
Age Gender Income Number of Children Number of Pets Preferred environment (aesthetically speaking) |
1 1 1 1 1 1 |
|
Township |
Sense of community within township Awareness of issues |
1 1 |
To validate the items, we invited 10 people who were representative of the age 20-70 living in central New Jersey target area to complete the questionnaire. These individuals were recruited through opportunity sampling and no compensation was provided. The lead author interviewed individuals following questionnaire completion. Through these discussions, we sought to understand where there was a gap between participant and interviewer ideas regarding the questionnaire responses. Modifications to questions were made with the participant present.
Following this, a subset of questionnaires were sent to our target audience generated from a random search of white pages.com addresses in the target area. One hundred questionnaires were sent at random with 21 returns. Based on these, further question modifications were made in an effort to reduce ambiguity as noted by both lead authors. We then asked the same 10 volunteers to read for understanding the questionnaire. After this edit, the questionnaire was mailed. Three hundred and eighty questionnaires were mailed (and not returned as undeliverable) with 74 completed returns; making a 19.5% response rate.
Survey responses were first inspected in a Multiple Correlation Analysis to determine associations and possible trends. The authors designed this method in an effort to holistically view correlations that exists between questionnaire approaches. To help make meaning of our associations, we next analyzed our data using Multiple Correspondence Analysis, which is an ordination technique that is able to reduce data redundancy in large sets of categorical data. Individuals are plotted along several composite dimensions made up of the variables (or in our case, the questions) in our study. From these dimensions, we ran a Cluster Analysis to determine which variables likely provide the greatest explanation for differences between individuals in our study population. To help avoid spurious clustering, we chose to retain the clusterings that provided 7 or fewer clusters. From there we used Discriminant Function Analysis (DFA) to provide a sense of the robustness of our clusters were. DFA requires us to provide the clusters and associated variables, while the analysis indicates how well group membership could be predicted. We found that two clusterings resulted in a high percentage of accurate placements (More detail available by request). The results of the correlations and two clusterings are described below.
Results
We found that variable categories, such as the trust constructs, tended to be highly correlated with another. We also found a number of the education and environmental literacy variables to correlate with self-report personality characteristics and experiences. In summary:
Demographics
Females tended to score higher in environmental knowledge and older individuals were less likely to report better health and to travel to regional parks.
By Town
People who felt a part of a community within a township were more likely to report themselves as smart but were less likely to report optimism. These individuals also reported greater issue awareness within that town. Community feeling within a township varied by town as did park quality and rating of oneself as smart tended to vary with town.
Personality
Individuals who placed external responsibility for environmental care tended to report a lower mood in terms of anxiety and depression.
Trust
If an individual trusted an entity, they were more likely to trust another. With more education comes less trust in schools. Higher trust in schools is associated with rating of lower park quality (as is trust of groups). Finally, individuals who reported greater trust in federal government tended to report a lower attitude toward nature and were less likely to rate themselves as smart or humorous.
Education, Environmental Literacy, and Environmentalists
People who report more education were more likely to report more affluence, issue awareness within a town, pro-environmental views, better health, greater optimism and mood, and a better schooling experience. They were also more likely to say that the community should pay for environmental care
People who rated themselves as having pro-environmental views tended to have greater environmental knowledge, a higher regard for learning, some understanding of science, and a greater awareness of parks in their area. Individuals with pro-environmental views also tended to rate themselves as being less anxious or depressed, preferring less built environments, having a better sense of how science is done, enjoying the outdoors, enjoying learning, and were less likely to report that environmental problems can always be fixed later. These individuals also tended to report that they would pay for environmental care. These individuals reported less trust in local businesses, corporations, or social groups. It is important to note, however, that a high number of correlation analyses conducted in the same analysis could result in some spurious significant correlations given the likely increase in type I error.
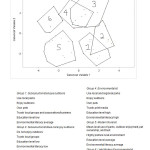
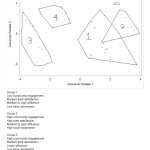
Because we are interested in understanding park use and targeting environmental literacy type interventions, we felt that the clustering procedure would allow us to determine similarities and differences among individuals. As previously mentioned, we retained two clusterings: Figure 1 (with 6 groups) and Figure 2 (with 4 groups). The former yielded clusters that were most characterized by differences in environmental literacy, education, enjoyment of outdoors, preferred environment types, pets, and trust. The latter figure yielded 4 major clusters that were most characterized by town, issue awareness, and community feel.
 |
|
 |
|
Discussion
In summary, our correlation analysis indicated that park use could be related to socioeconomics and in particular, education, environmental literacy, pet ownership, outdoor enjoyment and preferred environment. These variables can be related to perception of self with respect to the environment. Variables such as mood and other personal characteristics, which did not correlate as strongly with park use, are more strongly associated with individual characteristics (Figure 1). Most individuals felt, however, that responsibility tended to rest more with the government in terms of environmental care as opposed to self.
As other studies have shown, socioeconomics plays an important role in park use and more importantly in park perception (e.g., [5]). Living conditions and sense of community, as well as practices such as pet ownership and child-rearing also seem to play an important role in predicting an individual’s park use. Most importantly we see that certain elements of environmental ethic do not play a role in local park use, yet to be environmentally literate does relate to sense of community within a town and education.
Based on our findings we suggest that programs encouraging greenspace use, especially as they pertain to environmental literacy, should be framed with identity. Identity frames are defined as a cognitive framework or scheme belonging to individuals and their characteristics, or groups of individuals as identified from social experiences.17,18 Identity frames can affect decision and interpretations of information. For example, personal identity can affect political actions and beliefs (e.g., with respect to policy19). As evident in our data, greenspace use is more complicated than labeling individuals as preferring the outdoors or in or as being “environmental” or not.
Local parks were viewed as being along a gradient of poor to sufficient quality. Certainly, efforts targeted toward community may aid in developing a local environmental appreciation and a greater desire to participate in park upkeep. Post-hoc analysis indicated that the less affluent townships were associated with lower park quality than the more affluent townships. Targeting pet owners and may be a good angle for community involvement in local park upkeep, while targeting parents as a resource group might work for more regional level parks.
Although covering a small geographic area, our study has implications for how park use and intervention could be framed to motivate different groups. In more urban and sub-suburban areas, local government could be engaged in activity to promote environmental quality/literacy because trust of government and local community organizations tends to be high in individuals who prefer this type of environment. When targeting urban spaces, encouraging “late modern” type of environmental and space use ideals might also be important. In more suburban places, efforts to work with local groups and media may encourage greenspace use. However, with more rural-preferring individuals, trust in general might be lower, and therefore working with social networks may prove more fruitful. While the above may be somewhat speculative at this point and does rely in part on individuals living in their preferred environments, it would not be difficult to test some of these ideas with a larger sample. Efforts to link environmental quality to health and personal well-being as well as to educational and economic structures would likely resonate well with residents from all townships. It is clear that creativity and community leveraging is necessary to provide access to beneficial green space.
Acknowledgments
We wish to acknowledge Hatch Act USDA formula funds multistate project #1462. In addition, we thank David Howe for his editorial assistance, Danica Ramos and Katherine VanValen for their assistance, and the individuals who took the time to complete our questionnaire.
Appendix: Questionnaire
|
Past Experiences with Outdoor Parks |
Instructions
Please fill-in, circle, or check the most appropriate response.
Note
Here we consider parks to be green spaces that range in type and use, and are outdoor spaces that typically facilitate activities (e.g., sports, boating, hiking, etc.), rest, or picnics.
1. About how many parks would you estimate can be found within 2 miles of your home? _______2. How would you rate the quality of parks in your area?
_____Excellent _____Good ____Sufficient ____Fair ____Poor
Please explain your answer.__________________________________________
3. In general, do you think that park areas have decreased in quality over the last 5 years?
___ Definitely __Maybe ___ Not At All __ Not Applicable
Please explain your answer.___________________________________________
4. Provide a few suggestions for improvements to your nearest park, which might encourage you to use it more. ________________________________________________________________
5. Do you enjoy the outdoors? ___Yes ___No Why or Why not? ______________
6. How often do you use one of your area parks?
_____ Daily _____ A few times a week ____ Weekly _____ Monthly ____ Yearly ____ Rarely
7. Do you visit parks/green spaces that are not local?
_____ Yes _____ No
If yes, please explain why you visit non-local parks over your area parks:
______________________________________________________________________
______________________________________________________________________
______________________________________________________________________
| Attitude toward nature |
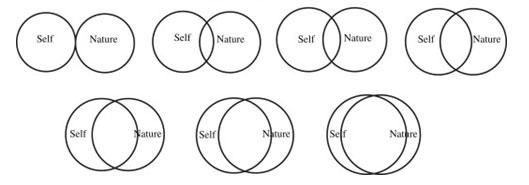
8. Please circle the picture below that best describes your relationship with nature. (Self=you)
| Ideas about Science and the Environment |
9. Circle the response that most closely aligns with your definition of science as a way of knowing. Please circle only one.
|
Physics, biology, chemistry |
Trial and error and experiments |
Refuting ideas and experiments |
Trial and error and testing models |
Testing ideas using models as explanation |
10. Views on the nature of science.
|
|
Never |
Occasionally |
Half the time |
Often |
Very often |
|
a) How often do scientific theories need to be based on data that are visible to the human eye (either the naked eye or with the aid of microscopes, telescopes, etc.)?
|
1 |
2 |
3 |
4 |
5 |
|
b) How often do scientists need to use experiments to determine if something is true?
|
1 |
2 |
3 |
4 |
5 |
|
c) Good scientific experiments need a laboratory environment. |
1 |
2 |
3 |
4 |
5 |
11. Please rank from 1 (being the most) to 10 (being the least) the amenities or characteristics you would like to see in your area park.
|
Ranking |
Characteristic |
|
Lighting (Along paths, parking lots, etc) |
|
|
Vehicle Charging Station |
|
|
Restrooms |
|
|
Art/Cultural Pieces |
|
|
Hiking Trails |
|
|
Children’s Play Areas/Jungle Gyms |
|
|
Coordinated Activities |
|
|
Dog Waste Station |
|
|
Water Fountain/ Water Bottle Filling Station |
|
|
Seating Areas (Benches, Gazebos, etc) |
12. Rank in order from 1 to 10 the issues you believe Americans should be making effort to fix. 1 being the issue that should have the most effort, down to 10 with the issue needing the least effort.
_______ Curing cancer. _______ Reducing heath care costs.
_______ Improving the quality of our environment. _______ Decreasing poverty.
_______ Improving environmental security. _______ Growing the US economy.
_______ Improving the quality of US education. _______ Reducing the budget deficit.
_______ Decreasing crime and drug use. _______ Improving ecosystem services.
13. Using a scale of 1 (being most trustworthy) through 5 (being least trustworthy), rate your level of trust in each of the following potential news outlets.
|
Most trustworthy |
Somewhat trustworthy |
Neutral |
Somewhat not trustworthy |
Least trustworthy |
|
|
a) Your state and local government
|
1 |
2 |
3 |
4 |
5 |
|
b) The federal government
|
1 |
2 |
3 |
4 |
5 |
|
c) TV News
|
1 |
2 |
3 |
4 |
5 |
|
d) TV shows (such as 60 Minutes or 20/20)
|
1 |
2 |
3 |
4 |
5 |
|
e) Radio
|
1 |
2 |
3 |
4 |
5 |
|
f) Newspaper
|
1 |
2 |
3 |
4 |
5 |
|
g) Magazines
|
1 |
2 |
3 |
4 |
5 |
|
h) Local schools
|
1 |
2 |
3 |
4 |
5 |
|
i) Local civic groups
|
1 |
2 |
3 |
4 |
5 |
|
j) Mailers by local corporations
|
1 |
2 |
3 |
4 |
5 |
|
k) Businesses in your community
|
1 |
2 |
3 |
4 |
5 |
|
l) Friends and other people |
1 |
2 |
3 |
4 |
5 |
14. Circle the person/organization with whom you believe the primary responsibility for solving environmental problems lies.
Government Industry Municipalities Myself
- Using a scale of 1 (strongly agree) to 4 (strongly disagree), please rate the extent to which you agree or disagree with the following.
|
Strongly Agree |
Somewhat Agree |
Somewhat Disagree |
Strongly Disagree |
|
|
a) I do not have the knowledge to understand most environmental problems.
|
1 |
2 |
3 |
4 |
|
b) I am confused about what is good and what is bad for the environment.
|
1 |
2 |
3 |
4 |
|
c) I consider myself an environmentalist.
|
1 |
2 |
3 |
4 |
|
d) Most environmental problems can be fixed later.
|
1 |
2 |
3 |
4 |
16. What is the most common cause of pollution of streams, rivers, and oceans? It is…
- Dumping of garbage by cities
- Surface water running off yards, city streets, paved lots, and farm fields
- Trash washed into the ocean from beaches
- Waste dumped by factories
- Don’t know
17. How is most of the electricity in the U.S. generated? It is…
- Burning oil, coal, and wood
- Nuclear Power
- Solar Energy
- Hydro Electric Power
- Don’t know
18. What is the most common reason that an animal species becomes extinct? It is because…
- Pesticides are killing them
- Their habitats are being destroyed by humans
- There is too much hunting
- There are climate changes that affect them
- Don’t know
19. Scientists have not determined the best solution for disposing of nuclear waste. In the U.S., what do we do with it now? Do we…
- Use is as nuclear fuel
- Sell it to other countries
- Dump it in landfills
- Store and monitor the waste
- Don’t know
20. Which of the following is a renewable resource? It is…
a. Oil b. Iron Ore c. Trees d. Coal e. Don’t know
|
Personality and the Environment |
21. Using a scale of 1 (strongly agree) to 4 (strongly disagree), please rate the extent to which you agree or disagree with the following.
|
Strongly Agree |
Somewhat Agree |
Somewhat Disagree |
Strongly Disagree |
|
|
a) People consider me to generally be in a good mood.
|
1 |
2 |
3 |
4 |
|
b) I am not the type of person who loses their temper.
|
1 |
2 |
3 |
4 |
|
c) I enjoy learning about new things.
|
1 |
2 |
3 |
4 |
|
d) People can often find me outside. |
1 |
2 |
3 |
4
|
|
e) I am the type of person that is always on the move.
|
1 |
2 |
3 |
4
|
|
f) I enjoy learning about science.
|
1 |
2 |
3 |
4 |
|
g) I prefer going out than hanging around home.
|
1 |
2 |
3 |
4
|
|
h) People consider me moody.
|
1 |
2 |
3 |
4 |
|
i) I enjoy the arts.
|
1 |
2 |
3 |
4 |
|
j) I generally sleep well.
k) I consider myself to be healthy. |
1
1
|
2
2 |
3
3 |
4
4 |
|
l) I definitely stress out about things.
|
1 |
2 |
3 |
4 |
|
m) I enjoyed learning in school.
|
1 |
2 |
3 |
4 |
|
n) People always say that I am funny.
|
1 |
2 |
3 |
4 |
|
o) I consider myself to be smart person.
|
1 |
2 |
3
|
4 |
|
p) I am a very optimistic person. |
1 |
2 |
3 |
4 |
Appendix: Questionnaire Past Experiences with Outdoor Parks Instructions: Please fill-in, circle, or check the most appropriate response. Note: Here we consider parks to be green spaces that range in type and use, and are outdoor spaces that typically facilitate activities (e.g., sports, boating, hiking, etc.), rest, or picnics.
1. About how many parks would you estimate can be found within 2 miles of your home? _______
2. How would you rate the quality of parks in your area? _____Excellent _____Good ____Sufficient ____Fair ____Poor Please explain your answer._______________________________________________________
3. In general, do you think that park areas have decreased in quality over the last 5 years? ___ Definitely ___Maybe ___ Not At All ___ Not Applicable Please explain your answer. __________________________________________________
4. Provide a few suggestions for improvements to your nearest park, which might encourage you to use it more. ___________________________________________________________________________
5. Do you enjoy the outdoors? ___Yes ___No Why or Why not? ________________________
6. How often do you use one of your area parks? _____ Daily _____ A few times a week ____ Weekly _____ Monthly ____ Yearly ____ Rarely
7. Do you visit parks/green spaces that are not local? _____ Yes _____ No If yes, please explain why you visit non-local parks over your area parks: __________________________________________________________________________
__________________________________________________________________________
8. Please circle the picture below that best describes your relationship with nature. (Self=you) Ideas about Science and the Environment
9. Circle the response that most closely aligns with your definition of science as a way of knowing. Please circle only one. Physics, Trial and Refuting Trial and Testing ideas biology, error and ideas and error and using models chemistry experiments experiments testing models as explanation
10. Views on the nature of science. Never Occasionally Half Often Very the time often a) How often do scientific theories need 1 2 3 4 5 to be based on data that are visible to the human eye (either the naked eye or with the aid of microscopes, telescopes, etc.)? b) How often do scientists need to use 1 2 3 4 5 experiments to determine if something is true? c) Good scientific experiments 1 2 3 4 5 need a laboratory environment.
11. Please rank from 1 (being the most) to 10 (being the least) the amenities or characteristics you would like to see in your area park. Ranking Characteristic Lighting (Along paths, parking lots, etc) Vehicle Charging Station Restrooms Art/Cultural Pieces Hiking Trails Children’s Play Areas/Jungle Gyms Coordinated Activities Dog Waste Station Water Fountain/ Water Bottle Filling Station Seating Areas (Benches, Gazebos, etc)
12. Rank in order from 1 to 10 the issues you believe Americans should be making effort to fix. 1 being the issue that should have the most effort, down to 10 with the issue needing the least effort.
_______ Curing cancer.
_______ Reducing heath care costs.
_______ Improving the quality of our environment.
_______ Decreasing poverty.
_______ Improving environmental security.
_______ Growing the US economy.
_______ Improving the quality of US education.
_______ Reducing the budget deficit.
_______ Decreasing crime and drug use.
_______ Improving ecosystem services.
13. Using a scale of 1 (being most trustworthy) through 5 (being least trustworthy), rate your level of trust in each of the following potential news outlets Most Somewhat Neutral Somewhat Least trustworthy trustworthy not trustworthy trustworthy a) Your state and local government 1 2 3 4 5 b) The federal government 1 2 3 4 5 c) TV News 1 2 3 4 5 d) TV shows (such as 60 Minutes or 20/20) 1 2 3 4 5 e) Radio 1 2 3 4 5 f) Newspaper 1 2 3 4 5 g) Magazines 1 2 3 4 5 h) Local schools 1 2 3 4 5 i) Local civic groups 1 2 3 4 5 j) Mailers by local corporations 1 2 3 4 5 k) Businesses in your community 1 2 3 4 5 l) Friends and other people 1 2 3 4 5 14. Circle the person/organization with whom you believe the primary responsibility for solving environmental problems lies. Government Industry Municipalities Myself
15. Using a scale of 1 (strongly agree) to 4 (strongly disagree), please rate the extent to which you agree or disagree with the following. Strongly Somewhat Somewhat Strongly Agree Agree Disagree Disagree a) I do not have the knowledge to 1 2 3 4 understand most environmental problems. b) I am confused about what is good 1 2 3 4 and what is bad for the environment. c) I consider myself an 1 2 3 4 environmentalist. d) Most environmental problems can 1 2 3 4 be fixed later.
16. What is the most common cause of pollution of streams, rivers, and oceans? It is… a. Dumping of garbage by cities b. Surface water running off yards, city streets, paved lots, and farm fields c. Trash washed into the ocean from beaches d. Waste dumped by factories e. Don’t know
17. How is most of the electricity in the U.S. generated? It is… a. Burning oil, coal, and wood b. Nuclear Power c. Solar Energy d. Hydro Electric Power e. Don’t know
18. What is the most common reason that an animal species becomes extinct? It is because… a. Pesticides are killing them b. Their habitats are being destroyed by humans c. There is too much hunting d. There are climate changes that affect them e. Don’t know
19. Scientists have not determined the best solution for disposing of nuclear waste. In the U.S., what do we do with it now? Do we… a. Use is as nuclear fuel b. Sell it to other countries c. Dump it in landfills d. Store and monitor the waste e. Don’t know
20. Which of the following is a renewable resource? It is… a. Oil b. Iron Ore c. Trees d. Coal e. Don’t know Personality and the Environment
21. Using a scale of 1 (strongly agree) to 4 (strongly disagree), please rate the extent to which you agree or disagree with the following. Strongly Somewhat Somewhat Strongly Agree Agree Disagree Disagree a) People consider me to generally be in a good mood. 1 2 3 4 b) I am not the type of person who loses their temper. 1 2 3 4 c) I enjoy learning about new things. 1 2 3 4 d) People can often find me outside. 1 2 3 4 e) I am the type of person that is always on the move. 1 2 3 4 f) I enjoy learning about science. 1 2 3 4 g) I prefer going out than hanging around home. 1 2 3 4 h) People consider me moody. 1 2 3 4 i) I enjoy the arts. 1 2 3 4 j) I generally sleep well. 1 2 3 4 k) I consider myself to be healthy. 1 2 3 4 l) I definitely stress out about things. 1 2 3 4 m) I enjoyed learning in school. 1 2 3 4 n) People always say that I am funny. 1 2 3 4 o) I consider myself to be smart person. 1 2 3 4 p) I am a very optimistic person. 1 2 3 4 Responsibility for the Environment
22. Do you agree that members of the community, either through direct payment or through taxes, are responsible for maintaining our parks? ______ Yes ______ No
23. Would you willing be to contribute to a park upkeep fund? _____ Yes _____No Your Background
24. What year were you born? 19 ______
25. Are you male or female? ____ Male ____ Female
26. How would you describe yourself as financially? ___Struggling ___ Stable ___ Comfortable ___Affluent
27. Do you have children living in your home? ____Yes ____No
28. Pets? ____Yes ____No
29. Which environment do you prefer, aesthetically-speaking: ___ Urban ___ Suburban ___ Rural ___ Naturalistic
30. What is the highest level of education you have completed? ____High School ____ Associates ____ Bachelors ____ Masters ____Phd, MD, Doctorate
References
- Bedimo-Rung A.L. MowenA.J .and Cohen D.A. Am J Prev Med 28:159-168. 2005.
- Ward Thompson C. Land Urb Plan 60:59-72. (2002).
- U.S. Bureau of Labor Statistics 2013. http://www.bls.gov/tus/charts/leisure.htm accessed on 11 November (2014).
- Coley R.L. Cuo F.E and Sullivan W.C. Env Behav 29:468-494. 1997.
- Solecki W.D. and Welch J.M. Land Urb Plan 32: 93-106. (1995).
- Brownson R.C.. Baker E.A. Housemann R.A. Brennan L.K. and Bacak S.J. Am J Pub Health 91: 1995-2003. (2001).
- Chiesura A. Land Urb Plan 68: 129-138. (2004).
- Cordell H.K. McDonald B.L. Teasley R.J. Bergstrom J.C. Martin J. Bason J. and Leeworthy V.R. In Cordell HK (ed) Outdoor recreation in American life: A national assessment of demand and supply trends. Sagemore Press, Champaign, IL pp219-322. (1999).
- Payne L.L. Mowen A.J.and Orsega-Smith E. Leisure Sci 24:181-198. (2002).
- Eyler A.A Hipp J.A. and Lokuta J. Am J Health Prom (ePub). (2014).
- Tester J. and Baker R. Prev Med 48: 316-320. (2009).
- Cohen D.A. Hahn B. Derose K.P. Williamson S. Marsh T. McKenzie T.L. Am J Prev Med. 45:590-597. (2013).
- Allandorf T.D. Aung M. Songer M. J Environ Manag. 30:36-43. (2012).
- Cohen D. Golinelli D. Williamson S. Sehgal. A Marsh T. McKenzie T.L. Am J Prev Med 36:475. (2009).
- Hines J.M. Hungerford H. and Tomera A. J Env Ed 18:1-8. (1986).
- Coyle K “Environmental literacy in America: What ten years of NEETF/Roper research and related studies say about environmental literacy in the U.S. The National Environmental Education &Training Foundation.” http://files.eric.ed.gov/fulltext/ED522820.pdf accessed 28 January 2015. (2005).
- Guichard J.E.N. Euro Pers 2001: 275-302. (2001).
- Abrams D. and Hogg M.A. J Lang Soc Pysch 6:201-213. 1987.
- Egeberg M. J Euro Pub Pol 6: 456-474. (1999).


