Using Fuzzy Logic Analysis in GIS and FAHP Method for Parks Site Selection in Urban Environment (Case Study: Region 7, Tehran Municipality)
Amin Ahmadi Givi , Saeed Karimi , Negar Foroughi , Yasser Moarab and Vahid Nikzad
1
Faculty of Environment,
University of Tehran,
Iran
http://dx.doi.org/10.12944/CWE.10.2.07
The overall goal of this research is to determine the importance of affecting factors for site selection in parks and urban green spaces and also a suitable site selection for parks in the study area. Methodology of this research is an analytic descriptive research. At first by using library and literature review and Delphi approach effective parameters in site selection of parks were extracted and then, pair wise comparison performed in FAHP method with relevant experts to determine significance and weighted of criteria. Then, data layers standardized in IDRISI software and were prepared in the form of Fuzzy. And finally prepared Fuzzy maps overlaid in GIS software by considering their weights to identify suitable locations for the construction of parks in region 7 of Tehran municipality.
Copy the following to cite this article:
Givi A. A, Karimi S, Foroughi N, Moarab Y, Nikzad V. Using Fuzzy Logic Analysis in GIS and FAHP Method for Parks Site Selection in Urban Environment (Case Study: Region 7, Tehran Municipality). Curr World Environ 2015;10(2) DOI:http://dx.doi.org/10.12944/CWE.10.2.07
Copy the following to cite this URL:
Givi A. A, Karimi S, Foroughi N, Moarab Y, Nikzad V. Using Fuzzy Logic Analysis in GIS and FAHP Method for Parks Site Selection in Urban Environment (Case Study: Region 7, Tehran Municipality). Curr World Environ 2015;10(2). Available from: http://www.cwejournal.org?p=769/
Download article (pdf)
Citation Manager
Publish History
Introduction
Approximately half of people in the world live in urban areas. One important element for their well-being and quality of life is the availability of urban green space. There are different ways in which urban green space can positively influence well-being and health. However, in most urban areas, and particularly in inner-city areas, green spaces are in insufficient supply (Kabisch and Haase 2011). Individual countries and/or cities have begun to take an increasing responsibility in developing urban green space and improving the services provided by different forms of urban green spaces. Following the Convention on Biological Diversity ,these countries and cities have formulated national, regional, or local action plans to integrate urban biodiversity and ecosystem services (ES) provided by urban green space, among others, into management. (Bertram and Rehdanz 2014).
Urban green space is defined as any piece of land covered by vegetation and often referred to as parks, golf courses, sports field and other open spaces within urban built-up area whether publicly accessible or not (Rasidia, Jamirsahb, and Saidc 2012). Urban green spaces are essential component in new townships due to the opportunities they provide for people to come in contact with each other. In terms of social well-being, urban green space has the potential in reducing negative social behavior such as aggression and violence, thus contributing to a sense of place and harmony, and hence plays an important role in fostering social cohesion and social identity (Dempsey, Brown, and Bramley 2012).
Trees, parks, urban and per-urban woods (green spaces Categories included within Urban Forest) can mitigate temperature, decrease pollution, water run-off and soil erosion, increase aesthetics and quality of places, provide a place for recreation, education and learning. Trees can also contribute by direct and indirect ways to reduce CO2 in the atmosphere and contrast urban heat island (Paulelt and Duhme 2000). The development explosion of recent decades resulting in the loss of forest, farm, forest fringe, and other open space lands that somehow contributes to urban residents’ quality of life. The growing scarcity of green space is at concern of local authorities nowadays since there are not much of quality green areas left. It is partly because the current condition of common urban green space was poorly design and eventually does not promote social interaction among urban residents (Rasidia et al. 2012).
In fact, considering locating and a suitable site selection for construction of urban green space is important and providing an initial suitable condition is almost an important issue. Accordingly, a site selection of green spaces in urban areas has always been a subject of interest to researchers, Policy makers and urban planners which Due to it, using geographical information system and multiple criteria decision systems has been considered for a suitable site selection of green spaces in recent years (Ziari et al. 2013; Aranf 1997). Geographic Information Systems (GIS) helps cities manage and site selection of green space projects efficiently and reduce management costs. GIS brings together different types of data for intelligent planning and also integrating different map layers into an urban green space site selection project improves insight for decision making (Tasoulasa et al. 2013).
Geographic information systems (GIS) is a powerful tool designed for spatial analysis which provides functionality to capture, store, query, analyze, display and output geographic information. As such they have big influence in spatial decision making process. Recent development in field of decision making leads to dramatic improvements in the capabilities of GIS in location analysis. These development are reviewed through analysis of attribute data especially procedures for Multi-Criteria and Multi-Objective location analysis in GIS. Special emphasis is given to the problems of incorporating subjective influence in the context of decision making; the expression of uncertainty in establishing the relationship between evidence and the decision to be made; procedures for the aggregation of evidence in the presence of varying degrees of trade-off between criteria; and procedures for conflict resolution and conflict avoidance in cases of multiple objective decision problems (Eastman, Jiang, and Toledano 1998). Geographic information systems are used in conjunction with other systems and methods such as systems for decision making (DSS) and the method for multi-criteria decision making (MCDM). Synergistic effect, generated by combining these tools contributes to the efficiency and quality of spatial analysis for industrial site selection (Eldrandaly 2013; Malczewski 2006).
In a site selection process, the analyst strives to determine the optimum location that would satisfy the selection criteria. The selection process attempts to optimize a number of objectives desired for a specific facility. Such optimization often involves numerous decision factors, which are frequently contradicting and the process often involves a number of possible sites each has advantages and limitations decision making is based on numerous data concerning the problem of selection appropriate site (Rikalovic,Cosic, and Lazarevic 2014; Eldin 2003; Jankowski 1995; Carver 1991). The ultimate goal of this research is to identify suitable locations for the construction of parks based on the FAHP model to help planners and decision-makers in the region 7 of Tehran municipality.
Materials and Methods
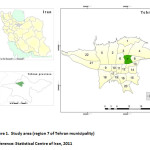
The Case Study Area
Region 7 is the central zone of Tehran which is located in an area of 1540 hectares and it is one of the narrow areas of Tehran Municipality. It is limited to region 3 and 4 of Tehran Municipality from the north and region 12 and 13 from the south and region 8 from the east and has a population of 329,920 thousand people. (Statistical Centre of Iran 2011).
Materials
Fuzzy Logic
Fuzzy logic has come of age. Its foundations have become firmer, its applications have grown in number and variety, and its influence within the basic sciences-especially in mathematical and physical sciences has become more visible and more substantive (Zadeh 1996).
Fuzzy set theory was designed to supplement the interpretation of linguistic or measured uncertainties for real-world uncertain phenomena. These uncertainties could originate with non-statistical characteristics in nature that refer to the absence of sharp boundaries in information. However, the main source of uncertainties involving in a large-scale complex decision making process may be properly described via fuzzy membership functions (Chang, Parvathinathan, and Breeden 2008).
The fuzzy logic analysis included both “fuzzy membership functions”, which assigned ratings for attribute values in a given thematic layer between 0 and 1, and “fuzzy overlay tool,” which merged multiple fuzzy membership results into the composite index map (Raines, Sawatzky, and Bonham-Carter 2010). Ratings of the thematic layer were represented as a likelihood (or possibility) of being a member of a fuzzy set, through the different types of fuzzy membership functions (i.e. fuzzification algorithms). Fuzzification refers to the procedure of transforming the attribute values of the thematic layer into the degree of membership (e.g.,
Table1: Fuzzy range and the corresponding verbal expression
|
Verbal expression |
Fuzzy numbers |
|
Equal Preference |
(1,1,1) |
|
low to moderate Preference |
(1,1.5,1.5) |
|
moderate Preference |
(1,2,2) |
|
moderate to high preference |
(3,3.5,4) |
|
High perefrence |
(3,4,4.5) |
|
high to very high perefrence |
(3,4.5,5) |
|
very high perefrence |
(5,5.5,6) |
|
very high to quite high perefrence |
(5,6,7) |
|
Quite high perefrence |
(5,7,9) |
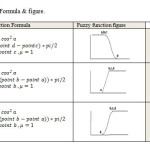
Table 2: Map standardization
|
Criteria |
Sub criteria |
Fuzzy Function |
Control points (m) |
|||
|
d |
c |
b |
a |
|||
|
Accessibility(Meter) |
Main road |
Decreasing Sigmoidal |
500 |
100 |
||
|
Subsidiary road |
300 |
0 |
||||
|
metro |
1000 |
100 |
||||
|
Density (one person in square meters) |
Increasing linear
|
0.054518
|
0.002153 |
|||
|
(proximity to the favorable centers (meter)
|
Cultural educational Therapeutic security centers
|
Decreasing Sigmoidal |
1000 |
100 |
||
|
Distance from unfavorable centers (meter) |
park petrol stations |
Increasing Sigmoidal |
1000 |
100 |
||
Analytical Hierarchy Process (AHP)
The analytic hierarchy process (AHP), firstly proposed by Saaty (1980), is a popular method for solving multi-criteria analysis problems involving qualitative (Deng 1999). Actually it is a flexible, quantitative method for selecting among alternatives based on their relative performance with respect to one or more criteria of interest (Boroushaki and Malczewski 2008; Linkov et al. 2007). AHP resolves complex decisions by structuring the alternatives into a hierarchical framework. The hierarchy is constructed through pair wise comparisons of individual judgments, rather than attempting to prioritize the entire list of decisions and criteria simultaneously (Saaty 1980).
 |
|
 |
|
Therefore, AHP is a systematized and hierarchical analysis method which is qualitative and quantificational. That is, we can get rid of deviation caused by subjective qualitative evaluation before, and incorporate objective into reality (Lai et al. 2011; Vafai ,Hadipour, and Hadipour 2013).
 |
|
The AHP procedure generally involves six steps (Lee, Chen, and Chang, 2008; Hosseinali and Alesheikh 2008):
- Define the unstructured problem, stating clearly its objectives and outcomes.
- Decompose the complex problem into decision elements (detailed criteria and alternatives).
- Employ pair wise comparisons among decision elements to form comparison matrices.
- Use the eigenvalue method (or some other method) to estimate the relative weights of the decision elements.
- Calculate the consistency properties of the matrices to ensure that the judgments of decision-makers are consistent.
- Aggregate the weighted decision elements to obtain an overall rating for the alternatives.
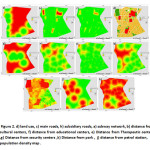 |
Figure 2: d) land use, c) main roads, h) subsidiary roads, a) subway network, b) distance from cultural centers, f) distance from educational centers, e) Distance from Therapeutic centers ,g) Distance from security centers ,k) Distance from park , j) distance from petrol station, v) population density map. Click here to View figure |
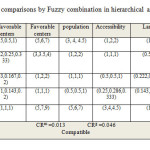 |
Table 5: Criteria pairwise comparisons by Fuzzy combination in hierarchical analysis model Click here to View table |
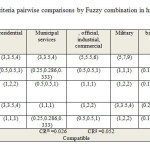 |
Table 6: Land use sub criteria pairwise comparisons by Fuzzy combination in hierarchical analysis model Click here to View table |
Since its introduction, The AHP has become one of the most widely used multiple criteria decision making (MCDM) methods (Lee et al. 2008). The pair wise comparison is the basic measurement procedure employed in the AHP method. This comparison is used in the decision making process to form a reciprocal decision matrix, thus transforming qualitative data to crisp ratios and making the process simple and easy to handle. By making pair wise comparisons at each level of the hierarchy, participants can also develop relative weights to differentiate the importance of the criteria (Boroushaki and Malczewski 2008). Saaty (1980) recommended a suitable measurement scale ranging from 1 to 9 for pair wise comparisons in which 1 means no difference in the importance of one criterion in relation to another, and 9 means one criterion is much more important than another. Reciprocals of these numbers are used to express the inverse relationship (Vahidnia, Alesheikh, and Alimohammadi 2009).
Finally we can say that AHP is widely used for tackling multi-criteria decision making problems in real situations. In spite of its popularity, the AHP is often criticized due to its inability to adequately handle the inherent uncertainty and imprecision in the pair wise comparison process (Deng 1999). To overcome this shortcoming, the fuzzy analytical hierarchical process (FAHP) method was developed (Bellman and Zadeh 1970). FAHP uses a range of values to express the decision maker’s uncertainty (Lee et al. 2008). The decision maker is free to select a range of values that reflects his confidence. Alternatively, he can specify his attitude as optimistic, pessimistic or moderate, representing high, low, and middle ranges of values respectively (Jeganathan 2003).
Table 7: Accessibility sub criteria pairwise comparisons by Fuzzy combination in hierarchical analysis model
|
Accessibility |
Main road |
Subsidiary road |
metro |
Geometric average |
|
Main road |
(1,1,1) |
(3,3.5,4) |
(0.5,0.5,1) |
(1.145,1.205,1.587) |
|
Subsidiary road |
(0.25,0.286,0.333) |
(1,1,1) |
(0.143,0.167,0.2) |
(0.329,0.362,0.405) |
|
metro |
(1,2,2) |
(5,6,7) |
(1,1,1) |
(1.71,2.289,2.41) |
|
CRm =0.003 CRg =0.011 Compatible |
||||
Table 8: Favorable centers sub criteria pairwise comparisons by Fuzzy combination in hierarchical analysis model
|
Favorable centers |
cultural |
educational |
Therapeutic |
security |
Geometric average |
|
cultural |
(1,1,1) |
(0.5,0.5,1) |
(1,2,2) |
(0.222,0.25,0.333) |
(0.577,0.707,0.904) |
|
educational |
(1,2,2) |
(1,1,1) |
(3,3.5,4) |
(0.5,0.5,1) |
(1.107,1.368,1.682) |
|
Therapeutic |
(0.5,0.5,1) |
(0.25,0.286,0.333) |
(1,1,1) |
(0.167,0.182,0.2) |
(0.38,0.401,0.508) |
|
security |
(3,4,4.5) |
(1,2,2) |
(5,5.5,6) |
(1,1,1) |
(1.968,2.576,2.711) |
|
CRm =0.006 CRg =0.055 Compatible |
|||||
Table 9: Unfavorable centers sub criteria pairwise comparisons by Fuzzy combination in hierarchical analysis model
|
Unfavorable centers |
park |
Petrol station |
Geometric average |
|
park |
(1,1,1) |
(3,4.5,5) |
(1.732,2.121,2.236) |
|
Petrol station |
(0.02, 0.222, 0.333) |
(1,1,1) |
(0.447,0.471,0.577) |
Effective Parameters in Site Selection
Some parameters are considered Based on available information, for selecting a proper location of parks and urban green spaces, as are follows:
(2) Accessibility: Include Main and Subsidiary roads and metro.
(3) Density: population density considered with zone partition.
(4) Distance from favorable centers: Cultural centers, mosques and sport centers and educational centers; schools and universities, Therapeutic centers; health center and hospitals, security centers; police stations and traffic police and fire stations have been considered.
(5) Distance from unfavorable centers: Parks and petrol stations are considered.
Table 10: Final criteria weights matrix
|
Criteria |
Final fuzzy weight |
Final definite criteria Weight |
|
Land use |
(0.184,0.273,0.424) |
0.289 |
|
Accessibility |
(0.098,0.141,0.226) |
0.151 |
|
population |
(0.054,0.077,0.124) |
0.083 |
|
Favorable centers |
(0.035,0.046,0.078) |
0.052 |
|
Unfavorable centers |
(0.291,0.463,0.659) |
0.469 |
Table 11: Final sub criteria weights matrix
|
Criteria sub
|
Final fuzzy weight
|
Final definite criteria Weight |
|
barren and arable |
(0.074,0.148,0.313) |
0.17 |
|
Military |
(0.008,0.015,0.042) |
0.02 |
|
official, industrial, commercial |
(0.014,0.032,0.069) |
0.037 |
|
Municipal services |
(0.027,0.057,0.116) |
0.067 |
|
residential |
(0.01,0.021,0.048) |
0.025 |
|
Main road |
(0.026,0.044,0.112) |
0.057 |
|
Subsidiary road |
(0.007,0.013,0.029) |
0.016 |
|
metro |
(0.038,0.084,0.171) |
0.094 |
|
cultural |
(0.004,0.006,0.018) |
0.009 |
|
educational |
(0.007,0.013,0.033) |
0.016 |
|
Therapeutic |
(0.002,0.004,0.01) |
0.005 |
|
security |
(0.012,0.024,0.053) |
0.028 |
|
park |
(0.179,0.379,0.676) |
0.403 |
|
Petrol station |
(0.046,0.084,0.175) |
0.097 |
Methods
In terms of performance this is an analytic descriptive research. Theoretical background of this research was performed by using library and literature review methods about effective parameters in site selection of parks and urban green spaces, and for these purpose, relevant parameters determined. Then spatial data were collected. In this regard, with using FAHP technique the significance and weighted criteria and sub-criteria obtained.The process of weighting criteria with using Fuzzy AHP approach is As follows:
First Stage
According to Fuzzy approach method in this research, the verbal expressions and Fuzzy numbers which listed in (table 1) were used for pair wise comparison. After that, in order to consensus of expert’s opinion, geometric average of respondent’s pairwise comparison obtained.
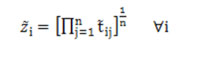
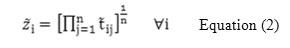
Second stage; the Calculation of Rows Geometric Average
In this stage, geometric average of each table’s pairwise comparison rows is obtained according to the following equation.
Third stage; Geometric Average Normalization
In this stage, values of second stage are normalized. For each matrix ∼Zi values are normalized with a total ∼Zi as equation (2):
Fourth Stage; Weights Combination
Final weights are calculated by the combination of alternative weights (toward Criteria) with criteria weights, according to equation (3):
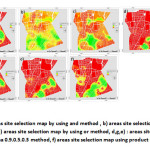 |
Figure 3: a)areas site selection map by using and method , b) areas site selection map by using sum method, c) areas |
Fifth stage; DE fuzzy
In this stage, fuzzy weight being de fuzzy according to equation (4):
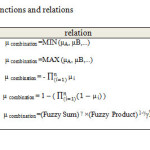
Then, with the help of IDRISI software, some layers in (table 2 and 3) standardized and in GIS software, layers overlaid and priority areas presented for development of parks by subtracting these layer parks as constraint layer. In this research for finding suitable locations for construction of parks and green spaces, map production have been performed by applying 5 operators of fuzzy Gamma، Fuzzy Product، Fuzzy AND ، Fuzzy OR and Fuzzy SUM, that each one has its own characteristics.
In (table 4), function and relation of these Fuzzy membership operators are presented. At the end, maps which provided by these operators are discussed and compared.
Findings
In this research, due to the Fuzzy approach, verbal expressions and fuzzy numbers which listed in (table 1) where used for pair wise comparisons in order to obtain criteria and sub criteria weights.
Criteria and Sub criteria Pair Wise Comparisons by Using FAHP
In order to achieve the object, pair wise comparison questionnaires designed and pair wise comparisons which are shown in (table 5 to 9) conducted with the help of experts.
FAHP Model Weight
Based on various sources and expert opinions and FAHP techniques, Weights of each criteria and sub criteria obtained, which are shown in (table 10 and 11).
Results
Affecting Parameters Analysis in the Site Selection of Study Area
Weights listed in (table 10 and 11) are Actually FAHP model out puts which were used as data layer weights. Also it should be mentioned that, region 7 has not been considered as a closed region and a 1000 meter buffer has been connected for more ensure and to obtain more detailed maps. At the end, map of each effective parameter in park and green space site selection of region 7 of Tehran municipality was prepared by using GIS and layer standardization in IDRISI software (Figure 2).
It should be noted that each data layer map from affecting parameters in green space site selection of region 7 of Tehran Municipality were combined together in GIS. Result of this combining and the final model output will be observed as a final optimal urban green space map.
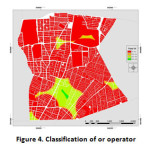 |
Figure 4: Classification of or operator Click here to View figure |
 |
|
In this research different operator compared with each other and their final map is obtained. We should say about operators that, fuzzy subscription operator (FUZZY AND) is similar to the subscription in classic sets. Effect of this operator is an output map handled with the smallest amount of fuzzy membership which occurs in any situation (Karimi 2014).
Also, fuzzy gamma operator (FUZZY GAMMA) that combines the methodology of Fuzzy Algebraic product and Fuzzy Algebraic Sum applied when increasing and decreasing effects exist in the interaction of parameters (Salari, Moazed, and Radmanesh 2012).
Fuzzy sum operator (FUZZY OR) is similar to the sum in the classic sets. Effect of this operator is an output map handled with the largest amount of fuzzy membership which occurs in any situation (Karimi 2014) and it applies when criterion maps have an increasing effect on each other (Atkinson et al. 2005). (FUZZY SUM) is the supplement of the fuzzy algebraic product .unlike fuzzy algebraic, fuzzy algebraic sum is always greater than or equal to the biggest fuzzy membership. (Atkinson et al. 2005). Finally in the fuzzy product operator (FUZZY PRODUCT), all input membership maps affect output map unlike AND, OR. This operator applies when criterion maps have a decreasing effect on each other (Salari et al. 2012).
Finally, these operators output is shown in (figure 3) as a final optimal location map for the construction of park and urban green spaces in region 7of Tehran municipality.
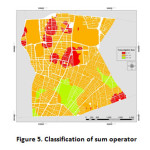
Finally, tow operator of fuzzy sum operator and Fuzzy or operator identified as proper operators in park and green space site selection of region 7 of Tehran municipality.5 classes were considered for these maps that these classifications are shown in (figure 4 and 5). It should be noted that none of these maps have 5th or ideal class. These maps data summary is shown in (table 12).
Table12: Classification of maps data
|
Fuzzy Sum |
Fuzzy Or |
|||
|
Values classification |
Area ( Square meters) |
Percentage |
Area ( Square meters) |
Percentage |
|
0-0.2 |
1237182.333599 |
10.619816 |
10172809.152 |
87.320692 |
|
0.2-0.4 |
9133851.210584 |
78.403818 |
411847.911766 |
3.535193 |
|
0.4-0.6 |
1278719.552995 |
10.976366 |
1025866.40727 |
8.805765 |
|
0.6-0.8 |
----- |
----- |
39417.606248 |
0.33835 |
|
0.8-1 |
----- |
----- |
----- |
----- |
Conclusion
Real world is full of uncertainties and constraints and we cannot talk about facts accurately. Due to these, range of values should be used to express uncertainty and constraints. Therefore, in this research authors tried to explain uncertainties with using Fuzzy methods. In this research, with the combination of Fuzzy methods, multiple criteria decision making (MCDM), geographic information systems and IDRISI software and considering constrains, suitable locations for construction of parks and green spaces determined with range of values expression. So 5 operators applied in overlaying layers in region 7 of Tehran municipality site selection. It should be said that in Fuzzy product operator (FUZZY PRODUCT) all input membership maps affecting output map and all of the criteria considering at the same time. Thus, this operator just determines the best locations without considering any unfavorable conditions in construction of park and green spaces. Next operator is Fuzzy gamma operator (FUZZY GAMMA) that combines the methodology of Fuzzy Algebraic product and Fuzzy Algebraic Sum. If gamma number be closer to 1 it will shows FUZZY GAMMA importance but if it became closer to 0 it will shows FUZZY PRODUCT importance. In Fuzzy gamma maps which have been produced by 0.3,0.5,0.9 numbers, if the number oriented to 1 it will be considered more suitable area for construction of parks and green spaces. We should say that fuzzy subscription operator (FUZZY AND) is considering unfavorable factors and Because of this, it determines less extent area than (OR FUZZY) and in comparison with (FUZZY PRODUCT) and (FUZZY GAMMA) operators with the expectation of 0.9 gamma number, it determines more extent areas. In general, this operator considerate more caution than OR FUZZY operator in the comparison with Fuzzy product and Fuzzy gamma operators consider less caution. Fuzzy or operator (OR FUZZY) is controlled with suitable factors and Because of this it determines more extent area with varying desirability levels for site selection and considers less caution.
Finally, in Fuzzy sum operator because of the mutual increasing criteria effects, maximum area is considered for the construction of parks and green spaces and also less caution is considering and it has the most abnegation from unfavorable factors. We should say about operators that fuzzy product operator, fuzzy gamma operator, fuzzy subscription operator are considered the most suitable areas for site selection but they are unacceptable because of many restrictions in urban area. And we should say that or and especially sum operators had the most logical method for parks site selection in urban environments.
References
- Aranf, A, Geographic information systems. Translated by Geological Survey of Iran. Tehran: National Cartographic Center of Iran press (1997).
- Atkinsona, D.M., Deadmanb, P., Dudychab, D., and Traynorc, S, Multi-criteria evaluation and least cost path analysis for an arctic all-weather road. Geography, 25: 287–307 (2005).
- Bellman R.E., and Zadeh L.A , Decision making in a fuzzy environment. Management Science, 17: 141–164 (1970).
- Bertram, C., and Rehdanz, K, The role of urban green space for human well-being. Kiel Institute for the World Economy, Working Paper, No. 1911 (2014) .
- Boroushaki, S.,and Malczewski, J, Implementing an extension of the analytical hierarchy process using ordered weighted averaging operators with fuzzy quantifiers in ArcGIS. Computers & Geosciences, 34 (4), 399–410(2008).
- Carver, S.J , Integrating Multi-Criteria Evaluation with Geo-graphical Information Systems. International journal of Geographic al Information on Systems, 5(3): 321–339 (1991).
- Chang, N.B., Parvathinathan, G.,and Breeden, J, Combining GIS with fuzzy multicriteria decision-making for landfill siting in a fast-growing urban region. Journal of Environmental Management 87: 139– 153(2008).
- Dempsey, N., Brown, C., and Bramley, G , The key to sustainable urban development in UK cities? The influence of density on social sustainability. Progress in Planning, 77 (3), 89–141(2012).
- Deng, H, Multicriteria analysis with fuzzy pair wise comparisons. Approximate Reasoning, 21(3): 215–231(1999).
- Eastman, J.R., Jiang, H., and Toledano, J, Multi-criteria and multi-objective decision making for land allocation using GIS. Multicriteria Analysis for Land-Use Management Environment & Management, 9: 227–251(1998).
- Eldin, N., and Sui, D, A COM-based Spatial Decision Support System for Industrial Site Selection. Journal of Geographic Information and Decision Analysis, 7(2): 72–92(2003).
- Eldrandaly, Kh Developing a GIS-Based MCE Site Selection Tool in ArcGIS Using COM Technology. The International Arab Journal of Information Technology, 10(3): (2013).
- Hosseinali, F., Alesheikh, A.A, Weighting spatial information in GIS for copper mining exploration. American Journal of Applied Sciences 5: 1187–1198(2008).
- Jankowski, P, Integrating geographical information systems and multiple criteria decision making methods. International Journal of Geographical Information Systems, 9(3), 251–273(1995).
- Jeganathan, C, Development of Fuzzy Logic Architecture to Access the Sustainability of the Forest Management. Netherland: International Institute for Geo-information Science and Earth Observation Enschede, 126–132(2003).
- Kabisch, N., Haase, D, Gerecht verteilt? – Grunflachen in Berlin. Zeitschrift fur amtliche Statistik, 6: 58–63(2011).
- Karimi, S , Syllabus of GIS usage in environmental planning. Tehran: University of Tehran (2014).
- Ki, S.J., Ray, Ch, Using fuzzy logic analysis for siting decisions of infiltration trenches for highway runoff control. Science of the Total Environment, 493: 44–53(2014).
- Lai, W.E.I., Han-lun, L.I., Qi, L.I.U., Jingyi, CH.E.N., and Yi-jiao, C.U.I., Study and implementation of fire sites planning based on GIS and AHP. Procedia Engineering, 11: 486–495(2011).
- Lee, A.H.I., Chen, W.C., and Chang, C.J, A fuzzy AHP and BSC approach for evaluating performance of IT department 444 Givi et al., Curr. World Environ., Vol. 10(2), 432-444 (2015) in the manufacturing industry in Taiwan. Expert Systems with Applications, 34: 96–107(2008).
- Linkov, I., Satterstrom, F.K., Steevens, J., Ferguson, E., and Pleus, R.C, Multi-criteria decision analysis and environmental risk assessment for nanomaterials. Journal of Nanoparticle Research 9: 543–554(2007).
- Malczewski, J, GIS and Multicriteria Decision Analysis. New York: John Wiley & Sons, 340(1999).
- Malczewski, J, Integrating multicriteria analysis and geographic information systems: the ordered weighted averaging (OWA) approach. Int.J. Environmental Technology and Management, 6(1/2) (2006).
- Paulelt, S.t., and Duhme, F.r , GIS Assessment of Munich’s urban forest structure for urban planning. Journal of Arboriculture, 26(3): 133–141(2000).
- Raines, G.L., Sawatzky, D.L., and BonhamCarter, G.F, Incorporating expert knowledge: new fuzzylogic tools in ArcGIS 10. ArcUser Spring 2010. Redlands, CA, USA: ESRI. Available from:http://www.esri.com/news/ arcuser/0410/files/fuzzylogic.pdf (2010).
- Rasidia, M.H., Jamirsahb, N., and Saidc, I, Urban green space design affects urban residents’ social interaction. Procedia - Social and Behavioral Sciences, 68, 464– 480(2012).
- Rikalovic, A., Cosic, I.,and Lazarevic, D, GIS Based Multi-Criteria Analysis for Industrial Site Selection. Procedia Engineering, 69: 1054–1063(2014).
- Saaty, T.L, The Analytic Hierarchy Process: Planning, Priority Setting, Resource Allocation. New York: McGraw-Hill(1980).
- Salari, M., Moazed, H., Radmanesh, F, Using AHP-FUZZY model in GIS for landfill siting in urban region, case study: Shiraz city, Iran. Journal of Yazd University of Medical Sciences, 1: 96–109(2012).
- Statistical Centre of IranAvailable from: www. amar.org.ir (2011).
- Tasoulasa, E., Varrasa, G., Tsirogiannisa, I., and Myriounisa, Ch., Development of a GIS Application for Urban Forestry Management Planning. Procedia Technology, 8: 70– 80(2013).
- Vafai, F., Hadipour, V., and Hadipour, A, Determination of shoreline sensitivity to oil spills by use of GIS and fuzzy model, Case study: the coastal areas of Caspian Sea in north of Iran. Ocean & Coastal Management, 71, 123–130(2013).
- Vahidnia, M.H., Alesheikh, A.A., and Alimohammadi, A, Hospital site selection using fuzzy AHP and its derivatives. Journal of Environmental Management, 90: 3048– 3056(2009).
- Zadeh, L.A, Life Fellow. Ieee Transactions on fuzzy systems, 4(2), 103–111(1996).
- Ziari, K., Shadman, M., Hasanpoor, S., and Mostafayi, A, Using combining AHP and FUZZY in GIS for a green space site selection, case study: Tehran municipality region 14. Journal of Geographic Space, 13(43), 19–39(2013).


