Assessing the Effectiveness of Microelement Removal in the South Tertiary Wastewater Plant, Riyadh KSA
Leda G. Bousiakou1,2 * , Rabia Qinde2 , A.S. Almuzaini3 , Hosham A. Alghamdi4 , Walid Tawfik2,5 , WA Farooq2 , H. Kalkani6 and E. Manzou7
1
Department of Automation Engineering,
Piraeus University of Applied Science,
Petrou Ralli and Thevon 250,
12241
Athens Greece
2
Department of Physics and Astronomy,
King Saud University,
Riyadh,
11459
Saudi Arabia
3
Civil and Environmental Engineering,
IT Services Department,
Sevastoupoleos 50,
Athens Greece
4
National Water Company,
Riyadh,
Saudi Arabia
5
National Institute of Laser Enhanced Sciences,
Cairo University,
Cairo,
Egypt
6
Department of Medical Laboratories,
Technological Institute of Athens,
Agiou Spiridonos 28,
12243
Athens Greece
7
Intermedical Diagnosis Laboratories,
E. Venizelou and Perikleous 1,
12241
Athens Greece
http://dx.doi.org/10.12944/CWE.10.3.07
This work focuses on the monitoring of trace element removal from the Riyadh South Tertiary Wastewater Treatment plant using inductively coupled plasma mass spectrometry (ICP-MS). Considering that the final effluent originating from the plant is directed for irrigation purposes towards the farms of Al- Dirayia, Dirab and Wadi Hanifa it is important to consider the possible presence of elevated microelement concentrations that could pose potential threats to the human health. All samples were collected from the initial entrance to the plant representing the raw influent as well as the final exit after chlorination, i.e. the final effluent used for irrigation purposes. Results showed that the concentration of aluminium (Al), phosphorus (P), copper (Cu), manganese (Mn) and lead (Pb) were initially elevated at their entrance to the plant compared to the recommended values by the Environmental Protection Agency (EPA) and the World Health Organisation (WHO), while zinc (Zn), chromium (Cr), molybdenum (Mo), selenium (Se), cobalt (Co), uranium ( U), mercury (Hg), arsenic (As), and cadmium (Cd) were within permissible levels. All microelements showed significant reduction of concentration with values well below the maximum recommendations. The observed results are important for assessing the functions and effectiveness of the treatment methods of the plant as well as ensuring that the final effluent is appropriate for agricultural use.
Copy the following to cite this article:
Bousiakou L. G, Qindeel R, Almuzaini A. S, Alghamdi H. A, Tawfik W, Farooq W. A, Kalkani H., Manzou E. Assessing the Effectiveness of Microelement Removal in the South Tertiary Wastewater Plant, Riyadh KSA. Curr World Environ 2018;10(3). DOI:http://dx.doi.org/10.12944/CWE.10.3.07
Copy the following to cite this URL:
Bousiakou L. G, Qindeel R, Almuzaini A. S, Alghamdi H. A, Tawfik W, Farooq W. A, Kalkani H., Manzou E. Assessing the Effectiveness of Microelement Removal in the South Tertiary Wastewater Plant, Riyadh KSA. Curr World Environ 2018;10(3). Available from: http://www.cwejournal.org?p=838/
Download article (pdf)
Citation Manager
Publish History
Introduction
Environmental engineering and novel energy technologies are at the forefront of research1-4 as part of a key strategy towards sustainability and a cleaner environment. One of the main concerns within the field of renewable energies and environmental engineering is wastewater treatment. In arid regions such as the Saudi Arabian peninsula, where 20% of wastewater is used for irrigation purposes it is especially important to monitor wastewater plant operations as well as introducing novel ways in water treatment and disinfection.
This study focuses on one of the major municipal treatment plants at the outskirts of Riyadh, namely the South tertiary wastewater treatment plant with the aim to assess its efficiency in the removal of microelements presenting a comparison of the average concentration values between the raw influent and final effluent as well as providing a quality assessment of the suitability of the final effluent for irrigation purposes compared to the recommended values by the Environmental Protection Agency (EPA)5 and the World Health Organisation (WHO).6 In particular the microelements considered are: aluminium (Al), phosphorus (P), zinc (Zn), chromium (Cr), copper (Cu), cobalt (Co), manganese (Mn), molybdenum (Mo), lead (Pb), selenium (Se), uranium ( U), mercury (Hg), arsenic (As), and cadmium (Cd).
In general microelements occur at different concentrations within the hydrosphere and many are essential for many the metabolic and physiological processes of organisms.7 They are part of enzymes, hormones, and cells in the body and insufficient intake of such microelements can cause symptoms of nutritional deficiency. Nevertheless high concentrations, especially as a result of contamination8-11 can pose serious concerns for humans and the ecosystem.
In arid regions such as Saudi Arabia12,13 with a populating of 28 million the need for reliable, clean water resources is of great importance. Current agriculture uses up to 55% of groundwater originating from acquifers, desalinated water as well as 20% treated municipal wastewater for all irrigation purposes.14-16
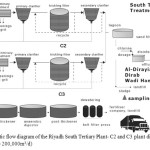
Our study evaluates the final effluent and removal efficiency of trace elements from the South tertiary wastewater treatment plant in Riyadh Saudi Arabia, where composite samples were collected at the following points: raw influent (1) and final effluent (2) (after chlorination) as seen in Figure 1 below. The main operations processes of the South tertiary plant can also be reviewed:
 |
|
The South Wastewater treatment plant was constructed in two stages and as a result is divided into two plants namely, C2 and C3. Albeit the treatment stages for both plants are similar their design capacity differs with C2 treating 80,000 m3/day of municipal waste , while C3 treating 120,000 m3/day.17 In particular the biological treatment of the plant is based on trickling filters packed by random plastic media. The effluent from the secondary clarifiers is transferred to aerated lagoons and then through sand filters it enters the disinfection treatment, which is achieved with the use of chlorine. The size of the chlorination tank is 8000m3 (total volume intake per day: 200,000 m3) and the average concentration of chlorine within the chlorination tank: from 0.1 ppm to 0.2 ppm. It is after this stage that water is directed to either the Ministry of Agriculture and water for re-use. The resulting sludge on the other hand is thickened, digested and dewatered and then utilised by either fertilizer companies or transported to landfills.18
In general when assessing the presence of microelements we note that certain minerals are essential for human health,19,20 such as Zn, Se, Cu, Mo, Cr, and Mn. Nevertheless there needs to be a balance between the intake of required levels and excess concentrations that could damange human health. In the case of Zn21 even though low levels can cause skin alterations, delayed growth and immunological disturbances, its excessive consumption lead to toxic exposure. Such toxicity can be even more pronounced in the case of cadmium, chromium and molybdenum where even at low concentrations they can be detrimental to human health.22
Thus continuous plant assessment and close monitoring of the final effluent especially when its used for irrigation purposes23 is of prime importance for human health as well as the immediate suggestion of remedial measures. For this purpose our study employs ICP-MS as it is a fast, multielemental technique with highly accurate detection capabilities.
Materials and Methods
Within this frame forty (40) wastewater 24 hour composite samples were collected from the South Wastewater Treatment Plant between the months of May 2015 to June 2015 using 500 ml amber glass bottles. Each sample was then carried using cooler boxes (to avoid degradation) to the analytical lab and stored at 4°C according to the Standard Methods proposed by the American Public Health Association (APHA)24 until analysis which was conducted. At a first instance the following parameters were determined for all samples: PH, suspended solids (SS), total solids (TS), biochemical oxygen demand (BOD5) and chemical oxygen demand (COD) while the average electric conductivity (EC) and turbidity for the final effluent only.
The ICP-MS Instrumentation
The analytical determination of the following microelements: Al, P, Zn, Cu, Mn, Cr, Pb, Mo, Se, Co, U, Hg, Cd, As was carried out by a NexION 300 D (Perkin Elmer, USA) ICP-MS. The system included an ultrasonic nebuliser (Cetec U 5000 AT), allowing a 50 fold enhancement in detection limits and improved reproducibility in determinining the levels of the trace elements. The analysis was done in triplicate and average values were taken each time. Perkin Elmer Pe-Pure spectroscopy grade standards were used for ICP calibrations. High precision was achieved by replicate analysis of blank, standards and all samples. Experiment repetition was conducted leading to an accuracy of 95%-105% and precision of +/-5%.
Analysis and results
The average values for the PH, suspended solids (SS), total solids (TS) , biochemical oxygen demand (BOD5) and chemical oxygen demand (COD) for all samples between the raw influent and final effluent are displayed in Table 1 below, while the average electric conductivity (EC) and turbidity of the final effluent were 1372 μS/cm and 9.3 NTU respectively.
Table 1: The average values for the PH, suspended solids (SS), total solids (TS) , biochemical oxygen demand
(BOD5) and chemical oxygen demand (COD) for all samples between the raw influent and final effluent
|
|
PH |
SS (mg/L) |
TS (mg/L) |
COD (mg/L) |
BOD5 (mg/L) |
|
RAW INFLUENT |
7.3 |
240.0 |
1204.2 |
450.3 |
253.7 |
|
FINAL INFLUENT |
7.8 |
19.0 |
1096.4 |
58 |
31.2 |
Further analysis of the ICP-MS results from the raw influent showed elevated average concentrations for the following trace elements: aluminium (Al), phosphorus (P), lead (Pb), copper (Cu) and manganese (Mn) (Table 2), while zinc (Zn), chromium (Cr), molybdenum (Mo), selenium (Se), cobalt (Co), uranium ( U), mercury (Hg), arsenic (As), and cadmium (Cd) displayed levels within the maximum recommended values by (WHO) and (EPA) as displayed in Table 3 below:
Table 2: Average microelement concentration detected in the raw influent.
|
ELEMENT |
RAW Influent (PPB) |
ELEMENT |
RAW Influent (PPB) |
|
Al |
1575.865 |
Mo |
4.171 |
|
P |
1414.652 |
Se |
2.854 |
|
Zn |
161.016 |
Co |
2.486 |
|
Cu |
68.734 |
U |
1.665 |
|
Mn |
78.990 |
Hg |
0.839 |
|
Cr |
24.368 |
Cd |
0.232 |
|
Pb |
21.295 |
As |
0.831 |
Table 3: The maximum recommended values for each element: Al, P, Zn, Cu, Mn, Cr, Pb, Mo, Se, Co, U, Hg, Cd, As according to ( EPA) and (WHO)
|
ELEMENT |
ALLOWED MAX (PPB) |
ELEMENT |
ALLOWED MAX (PPB) |
|
Al |
100 |
Mo |
30 |
|
P |
230 |
Se |
20 |
|
Zn |
5000 |
Co |
50 |
|
Cu |
30 |
U |
15 |
|
Mn |
50 |
Hg |
2 |
|
Cr |
100 |
Cd |
5 |
|
Pb |
15 |
As |
7 |
Figure 2 below shows a comparison of the concentration levels found in the raw effluent and the maximum recommended values by (EPA) and (WHO) in PPB. We note that despite the excess of concentration for Al, P, Pb, Cuand Mn all other elements remained below the (EPA) and (WHO) recommendations considering that the influent source was municipal waste.
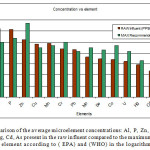 |
Figure 2: A comparison of the average microelement concentrations: Al, P, Zn, Cu, Mn, Cr, Pb, Mo, Se, Co, U, Hg, Cd, As present in the raw influent compared to the maximum allowed values for each element according to ( EPA) and (WHO) in the logarithmic scale. Click here to View figure |
After treatment there was a significant reduction for all element concentrations as detected in the final effluent. Their average concentrations are displayed in Table 4. below:
Table 4: The average concentration values of the trace elements detected in both sampling sites: raw influent and final effluent. e values of the following trave
|
ELEMENT |
RAW Influent (PPB) |
FINAL Effluent (PPB) |
ELEMENT |
RAW Influent (PPB) |
FINAL Effluent (PPB) |
|
Al |
1575.865 |
1.709 |
Mo |
4.171 |
0.513 |
|
P |
1414.652 |
189.361 |
Se |
2.854 |
1.136 |
|
Zn |
161.016 |
1.077 |
Co |
2.486 |
0.163 |
|
Cu |
68.734 |
0.722 |
U |
1.665 |
0.003 |
|
Mn |
78.990 |
5.113 |
Hg |
0.839 |
0.047 |
|
Cr |
24.368 |
0.402 |
Cd |
0.232 |
0.007 |
|
Pb |
21.295 |
0.035 |
As |
0.831 |
0.538 |
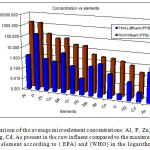 |
Figure 3: A comparison of the average microelement concentrations: Al, P, Zn, Cu, Mn, Cr, Pb, Mo, Se,Co, U, Hg, Cd, As present in the raw influent compared to the maximum allowed values for each element according to ( EPA) and (WHO) in the logarithmic scale. Click here to View figure |
We note that elements such as Al, U, Zn and Cr were removed from the final effluent with an efficiency of over 98%, while other elements such as Se and As showed the most persistence with a less than 60% removal efficiency as seen in Table 5. below:
Table: 5 The removal efficiency of the trace elements: Al, P, Zn, Cu, Mn, Cr, Pb, Mo, Se, Co, U, Hg, Cd, As. e values of the following trave
|
ELEMENT |
% Removal Efficiency
|
ELEMENT |
% Removal Efficiency
|
|
Al |
99.90 |
Mo |
87.70 |
|
P |
86.60 |
Se |
60.20 |
|
Zn |
99.33 |
Co |
93.44 |
|
Cu |
98.90 |
U |
99.82 |
|
Mn |
93.52 |
Hg |
94.40 |
|
Cr |
98,35 |
Cd |
97.00 |
|
Pb |
99,83 |
As |
35.26 |
The elevated levels of aluminium (Al) present in the initial raw influent are considered common due to the fact that it is the most plentiful material in the earth’s crust present frequently in combination with elements such as silicon, oxygen and fluorine.25 Its elimination in the final effluent reached a percentage of 99.9% elimination with a final average concentration well below the maximum recommended by (EPA) and (WHO). Aluminium poses no direct health threat to humans nevertheless aluminium (Al) levels accumulated over a period of time through food, water and soil exposure can affect the nervous system, diminish kidney function and cause muscle weakness.
Manganese (Mn) which was also detected at elevated concentrations, is an elements that along with iron (Fe) is elevated in the rock formation of the region as it is apparent in previous analysis done on groundwater sources in the area.26 It usually imparts a strong metallic taste to water, causes black staining and increased growth of bacteria in aquatic environments.27,28 Although it is not highly toxic it can reduce the ability of the body to absorb iron as well as causing tremors and stiff muscles after long term exposure.
Phosphorus (P) which was also detected at elevated concentrations can also be a highly toxic microelement.29,30 In particular after long term exposure through water or soil it causes initially gastrointestinal problems and can lead to kidney function, liver, the central nervous system collapses as well as being detrimental to cardiovascular functions. In our study we note that the raw influent is substantially elevated either due to the use of phosphorus in the production of phosphoric acid and phosphates which are used in the fertilizers industry or due to its use in rodenticides, electroluminescent coatings, semiconductors and chemicals. In the final effluent the elimination is up to 86.6% leading to levels below the maximum recommended values for irrigation purposes according to EPA and WHO.
Other microelements such as Cu, Co, Cd, Pb, and Hg also showed a substantial reduction in the final effluent with a removal rate of more than 90% leading to safe levels in the final effluent. In particular copper (Cu), lead (Pb), Cr (chromium) and Cd (Cadmium) belong to the class of heavy metals. The detection of Cu and Pb 31 at elevated values in the raw influent is mainly due to fertilisers, lead-acid batteries, paints and treated words. In the final effluent they were effectively removed and their concentration dropped well below the recommended values by EPA and WHO. It should be noted that levels of lead (Pb) in the aquatic environments of industrialised countries has risen two to three fold compared to pre-industrial levels which is very concerning considering that its bioaccumulation can lead to lead poisoning.
Finally arsenic (As) and selenium (Se)32 were detected in the raw effluent at values below the (EPA) and (WHO) recommendations. There removal efficiency was the least, showing the most persistence with a 60% and 35% elimination respectively.
In Figure 4 below a comparison between the final effluent and the maximum recommended values as introduced by EPA and WHO are displayed. Considering that over values of the final effluent are well below the maximum allowed concentrations this represents a healthy microelement water profile that is directed towards the agricultural lands of Al-Dirayia, Wadi Hanifah and Dirab.
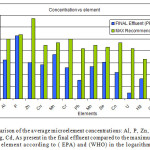 |
Figure 4: A comparison of the average microelement concentrations: Al, P, Zn, Cu, Mn, Cr, Pb, Mo, Se, Co, U, Hg, Cd, As present in the final effluent compared to the maximum allowed values for each element according to ( EPA) and (WHO) in the logarithmic scale. |
Conclusions
Our microelement analysis using ICP-MS showed that the concentrations of Al, P, Zn, Cu, Mn, Cr, Pb, Mo, Se, Co, U, Hg, Cd, As in the final effluent were all within the permissible limits for irrigation purposes. In particular Al, Zn, Cu, Cr, Pb, Mo, Co, U, Hg, and Cd were significantly eliminated in the effluent at concentrations of less than 2% of the recommended values by EPA and WHO while Mn, Se and As were present at concentrations less than 10%. Finally selenium (Se) and Arsenic (As) showed the most persistence in removal and were lowered to a 60% and 35% of the recommended values respectively. These findings represent important considerations in wastewater effluent quality evaluation especially as in this case it is used systematically for irrigation purposes. Monitoring such sources is very important for health purposes as well as for selecting appropriate treatment methods for microelement removal.
Acknowledgement
This research has been co-funded by the European Union (European Social Fund) and Greek national resources under the framework of the “Archimedes III: Funding of Research Groups in TEI of Athens” project of the “Education and Lifelong Learning” Operational Program
References
- Gogate P.R., Pandit A. B. A review of imperative technologies for wastewater treatment I: oxidation technologies at ambient conditions .Advances in Environmental Research 8 (3–4): 501–551 (2004)
- Gogate P.R., Pandit A.B. A review of imperative technologies for wastewater treatment II: hybrid methods. Advances in Environmental Research 8 (3–4):553–597 (2004)
- Dhote J., Ingole S., Chavhan A. Review on Wastewater Treatment Technologies, IJERT 1(5), (2012)
- Bousiakou L.G., Mohsin K., Lianos P., Fatani A., Kalkani E., Karikas G.A. Wastewater treatment technologies in the degradation of horomones and pharmaceuticals with focus on TiO2 technologies, Pharmakeutiki 25(1): 37-48 (2013)
- WHO (World Health Organization), Guidelines for drinking water quality.4th ed.; WHO Press: World Health Organization, 20 Avenue Appia, 1211 Geneva 27, Switzerland, (2011)
- Environmental Protection Agency, USA http://www.epa.gov/watersense/ (2015)
- Ward N.T. “Trace elements,” in Environmental Analytical Chemistry, F. W. Fifield and P. J. Haines, Eds., Blackie Academic and Professional, Chapman and Hall, London, UK (1995)
- Paquin R., Farley K., and Santore R.C.. Metals in Aquatic Systems: A Review of Exposure, Bioaccumulation, and Toxicity Models, Society of Environmental Toxicology and Chemistry, Pensacola, Fla, USA (2003)
- Goldstein G. W. “Lead poisoning and brain cell function,” Environmental Health Perspectives, 89: 91–94 (1990)
- Mansour S.A. and Sidky M.M. “Ecotoxicological studies 3. Heavy metals contaminating water and fish from Fayoum Governorate, Egypt,” Food Chemistry, 78(1):15–22 (2002)
- Uluozlu O.D., Tuzen M., Mendil D., and Soylak M. “Trace metal content in nine species of fish from the Black and Aegean Seas, Turkey,” Food Chemistry, 104 (2):835–840(2007)
- Al-Omran AM. Irrigation water conservation in Saudi Arabia. Journal of the Saudi Society ofAgricultural Sciences, 1(1):1-50 (2002)
- Al-Jasser A.O. 2011. Saudi wastewater reuse standards for agricultural irrigation: Riyadh treatment plants effluent compliance, Journal of King Saud University - Engineering Sciences 23(1): 1–8 (2011)
- AI-Abdula'aly, A.I . Fluoride content in drinking water supplies of Riyadh, Saudi Arabia. Environmental Monitoring and Assessment, 48:261-272 (1997)
- Abdel Magid, H.M. 'Assessment of drinking water quality in AI-Qassim Region of Saudi Arabia'. Environ Intema. 23(2): 247-251 (1997)
- Alabdula'aly A.I . Occurrence of radon in groundwater of Saudi Arabia, Journal of Environmental Radioactivity 138: 186-191 (2014)
- Projects Department, Ministry of Water and Electricity, KSA (2006)
- Kazi M., Bousiakou L. G., Klapa M., Fatani A., Karikas G. Determining residual anti-ulcer and anti-platelet pharmaceutical agents after wastewater treatment at the South tertiary municipal treatment plant in Riyadh, Saudi Arabia, Research Journal of Chemistry and Environment 2, (2013)
- Fraga C.G. Relevance, essentiality and toxicity of trace elements in human health Molecular Aspects of Medicine 26: 235–244 (2005)
- Dissolved mineral sources and significance National Ground Water Association. Available at: http://www.ngwa.org/Fundamentals/studying/Pages/Dissolved-mineral-sources-and-significance.aspx USA (2010)
- Zinc, US health department of Health and Human Services. Available at http://ods.od.nih.gov/factsheets/Zinc-HealthProfessional/ (2015)
- Pavlogeorgatos G.D. ,Thomaidis N.S , Nikolaou A.D . Determination of methyl mercury in a pilot-scale activated sludge wastewater treatment plant, Global NEST Journal, 8(1):61-67 (2006)
- Taany R.A., Ammari T.G., Jiries A. Revegetation in Arid Zones: Environmental Impact of Treated Wastewater Irrigation in Al-Karak Province, Jordan, Pol. J. Environ. Stud 22(2):569-575 (2013)
- APHA Standard methods for the examination of water and wastewater, 19th edn. American Public Health Association, Washington DC, USA (1995)
- Aluminium Toxicity, Mount Sinai Hospital. Available at: (2015)
- Qindeel R., Bousiakou Leda G., Tawfik W., Farooq W.A., Alonizan N. , Alsaleh S. and Siachos D. Trace element analysis using ICP-MS in the shallow aquifers of the Haier region, Saudi Arabia MEJSR 23(8):1941-1948 (2015)
- Blaurock-Busch E., The Clinical Effects of Manganese (Mn), Trace Minerals International of Boulder, Colorado, USA. Available at: (2002)
- Swistock B. Iron and Manganese in Private Water Systems: Penn State University Extension, Department of Agricultural Sciences. Available at: (2015)
- Phosphorus: Hazard Summary, Environmental Protection Agency (EPA),USA. Available at: (2000)
- Strom P.F. Technologies to Remove Phosphorus from Wastewater Peter F. Strom, Rutgers University , USA Available at: (2006)
- Hillenband T., Toussaint D., Bohm E., Fuchs S., Scherer U., Rudolphi A., Hoffmann M., Kreissig J, and Kotz C. Discharges of copper, zinc and lead to water and soil:analysis of the emission pathways and possible emission reduction methods. Environmental Research of the Federal Ministy of the environment: nature conservation and nuclear safety: Research Report 202 242 20/02 UBA-FB 000824 (2005).
- Smith K., Lau O., Vance F.W.: Evaluation of Treatment Techniques for Selenium Removal IWC 09-05. Available at: (2015)


