Investigation of Petrophysical Parameters of Upper Sarvak Formation in One of the Iran South Oilfields
Ata Movahed 1 * , Mohsen Masihi 2 and Abdonabi Hashem 3
http://dx.doi.org/10.12944/CWE.10.Special-Issue1.89
In this study, the upper Sarvak’s petrophysical parameters have been investigated in two A and B wells in one of the oil field in southern Iran. Based on this assessment and the use of conventional cross plots (neutron-density, sonic- neutron, MID_PLOT and M-N PLOT), lithology of upper Sarvak has been identified as a combination of limestone, dolomite and in small amounts, shale. With respect to calculated petrophysical properties and to more precise evaluation, the upper Sarvak in the studied area has been divided into 5 Zones. With respect to the specific petrophysical properties, zone S2 has been divided into 8 subdivisions. Finally, zone S2 with dominant lithology of limestone and with the lowest amount of shale in subdivision 2 and 3, have been recognized as the best reservoir parts.
Copy the following to cite this article:
Movahed A, Masihi M, Hashemi A. Investigation of Petrophysical Parameters of Upper Sarvak Formation in One of the Iran South Oilfields DOI:http://dx.doi.org/10.12944/CWE.10.Special-Issue1.89
Copy the following to cite this URL:
Jonoubi P, Salmanian A. H, Ravaei A. Histochemical Analysis of Expression Pattern of Camv 35S Promoter in Transgenic Rapeseed (Brassica Napus L.). Special Issue of Curr World Environ 2015;10(Special Issue May 2015). Available from: http://cwejournal.org?p=681/
Download article (pdf)
Citation Manager
Publish History
Introduction
Petrophysical evaluation is the knowledge of interpretation of data gained from well logs in order of quality evaluation of different parts of the formation and also reservoir zoning to determine the most appropriate zones in order to optimize the exploitation of reservoir and development of oil fields (Tiab, 2010). Studied oilfield is one of the largest oil fields in the Zagros basin in upper Sarvak formation. Lithology determination shale volume (Vsh), total porosity (PHIT), effective porosity (PHIE) and water saturation (SW) are the most important parameters in the petrophysical evaluation in order to determine the quality of the reservoir formation (Hearst et al., 2000).
In In this study, the raw data from two well logs of upper Sarvak formation in one of the oil field of southern Iran and GEOLOG 6.7 software have been used to determine petrophysical parameters affecting on the reservation quality of upper Sarvak formation.
Comment and debate
Regional Geology
Zagros sedimentary basin
Zagros- the Persian Gulf region, is a part of the Great Basin of Iran, Saudi Arabia, Iraq or the Persian Gulf syncline, which is the world's most prolific oil basins (Aghanabati et al., 2008).
Thickness of sedimentary rocks, mostly marine and non- metamorphic, from Precambrian to Pliocene, lack of volcanic activity, and many available mothers rock that are rich in organic matters, porous and permeable reservoir rocks with appropriate mantle rocks provide unique conditions for production and accumulation of hydrocarbons in the area. Zagrs- Persian Gulf basin in comparison with other sedimentary basins has the highest concentration of hydrocarbon reserves in the world. This basin is expanded to Oman, Saudi Arabia, United Arab Emirates, Kuwait, Iraq, and Syria, Turkey and South East, in addition to Iran and the Persian Gulf (Motiee, 2005).
Late Cambrian sedimentary rocks (upper) and the lower part of the Zagros Basin in the first era like Mila and Lalun are very similar to contemporary rocks in other sedimentary basins of Iran. Therefore, it could be said that in the lower Paleozoic, Zagros basin was is a part of a very large sedimentary basin which its zone was expanded beyond Iran’s borders. With the opening of the ancient Tethys Ocean, the basin is separated from other parts of the country. Thus, the stratigraphy of the Zagros basin can be divided into two periods. A period before its opening which was similar to other parts of the country and the next period that was lead to creation of Zagros- Persian Gulf basin as an independent one(Drew Darvish Zadeh, 2005).(Fig 1).
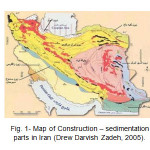 |
Figure 1: Map of Construction – sedimentation parts in Iran (Drew Darvish Zadeh, 2005). Click here to View figure |
Bangestan
The name of the Bangestan group was taken from mountain Bangestan which is located in the northwestern of Behbahan city. Lime stones in Bangestan was called the mid-Cretaceous lime, Rodite, Hyporite and Lashtkan lime. This group from old to new, includes Scorpios, Sarvak, Surgah and Elam formations(Ghalavand , 2006).
Sarvak
Sarvak formation is a part of Middle Cretaceous limestone which is located in cutting pattern of Sarvak gorge and in the southwest mountain Bangestan with 254.5 meters of thickness. Cutting pattern of this formation is located in the central of the southern slope of mount Bangestan. Lower part of Sarvak formation is composed of 250 meters fine dark gray argillaceous limestone with nodular layers in association with a layer of dark gray calcareous marl containing ammonites. The middle part of this formation contains 108 meters carbonated sediments in the form of bulk limestone containing siliceous nodules with a brownish red color.
In this section, 408 meters bulk brown limestone containing Roditi debris and there are 42 meters ferruginous limestone at the end of it. In Sarvak, Dezful and Lorestan embayment, numerous oil reserves have been discovered and exploited (Quli et al., 2011), but in Fars, Sarvak formation is lower in oil content. The most porous area is in the southwestern region of Dezful embayment (Abadan plain) and this is the area that Albian sandstone (Omr Creek formation) were locally developed. This formation deposited during the Albian, in a pacific and large basin in Dezful embayment and the northern Persian Gulf, in an oxidizing environment (its row contains more than 300 meters of shale) (Erin, 2010).
oil field of study
The under study oil field is considered as one of the largest oil fields in the Zagros basin. It is expanded in a field with a square area of 20 to 75 km, in the 100 km from west of Iran(Arian, 2010). Two wells, A and B, located in the southern part of the Zagros Basin, in the upper Sarvak have been studied and evaluated.
Determination of Lithology
In this study, the lithology determination has been done using conventional cross-plot in four ways.
Methods in Determination of Lithology
One important application of logs is to determine the lithology. In well logging, it is common for the solid part to consider two components: the first component is a matrix containing main grains and cement and the second component is shale. Some features in lithology, such as mineralogy texture, structure, shale volume and fluid’s content may effect on the response of the logs. Texture means parameters corresponding to the matrix, and also to the construction means bedding and fracture characteristics. In addition to the data obtained from retailers and core drilling, data extracted from well logs may help to more accurately estimate the lithology (Qasim al-Askari et al., 2010). To determine the lithology of formation, the area where have the least amount of shale and porosity and saturated with water is the favorite site. Cross plots that are frequently used to determine the lithology are:
- Neutron - density Cross-plot
- Neutron – sonic cross plots
- M_N PLOT method
- MID_PLOT method
Neutron- Density Cross Plot
The lithology and porosity can be calculated by this cross plots. To graphically find porosity using this chart, density values should be plotted against neutrons. This cross plot, has the maximum resolution and is the best detector of porosity among the different lithologies (Fertle et al., 1987). The cross plot well distinguishes lithology lime, dolomite and sandstone. it should be noted that, before drawing given data should be corrected for the presence of shale and hydrocarbon. In wells with uneven walls or heavy drilling mud, information density may not show correlation, so there are limitations to the use of cross-platform(Sajadian et al., 2011).
BSased on Neutron- density cross-plot, upper Sarvak lithology in the studied area is a combination of limestone, dolomite and in small quantities, shale, respectively (Figs 2 and 3).
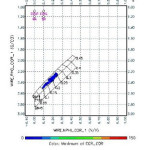 |
Figure 2: Neutron-density cross-plot of well A Click here to View figure |
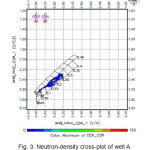 |
Figure 3: Neutron-density cross-plot of well A Click here to View figure |
Neutron- Sonic Cross-Plot
In this cross plot, the resolution between the different lithologies is close to the neutron- density cross plot. For graphical solution, it is sufficient to plot sonic against neutron. The plot area is the point at which the distance from dot to matrix lines indicate the percentage of the lithology. In the presence of evaporable minerals, this Fig shows low resolution. Sonic logs is less sensitive to irregularities in the wellbore than density log, but the use of these cross plots is unusual due to consideration of density. If the neutron porosity of shale and of dry shale are different from their counterparts in matrix, calculated porosity would not be correct, so it is important to correct the shale in advance (Rezaie et al., 2010)
Neutron- sonic cross-plot for wells A and B are shown below (Figs 4 and 5).
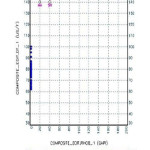 |
Figure 4: Sonic- neutron cross-plot for wells A Click here to View figure |
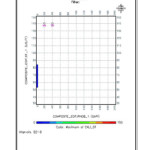 |
Figure 5: Sonic- neutron cross-plot for wells B Click here to View figure |
M-N Cross-Plot
This cross plot is used to determine the lithology with the aid of 3 porosity diagrams. In fact, this cross-plot eliminate the effect of porosity and is used for investigation of ternary mineral composition. To define M which is the slope of the curve and density and sonic measurements have been integrated. Cross-plot of neutron - density have a similar slope called N. In the cross plot, M and N are plotted versus each other. M and N are obtained according to the following equations.:
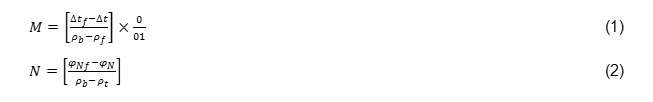
In these relationships, 2 diagram have been used for calculation of each between the results of the N and M, so the effect of porosity and lithology would largely eliminate. So N and M are only functions of lithology. One of the best uses of these cross plots is diagnosis of secondary porosity. Because Secondary porosity changes M but not N. Therefore, it translate points to the north of cross-plot(Serra, 2009).
Due to lack of PEF (photoelectric factor), in well B, we don’t have M-N Cross plots and cross plot have been graphed just for well A (Fig 6).
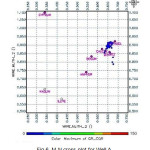 |
Figure 6: M-N cross-plot for Well A Click here to View figure |
Cross-plot
For exact determination of lithology, the MID cross-plot is being used in which the first attempt is to determine the matrix(Δtma,φNma,Pma). In this graph (Δtma - Pmaa) are obtained through interpolation matrix of the different lithologies (dolomite, sandstone and limestone) (Elins et al., 1978).
With determination of these two parameters (Δtma, Pmaa), we could use them in MID plots. In this diagram, the main points show less distribution and axes of relevant values have real physical parameters.
MID plots uses meaningful parameters such as density and matrix, while in the M -N plot, M and N are just slopes. However, in MID plot similar to MN plot only three minerals are distinguishable. It is necessary to pass three stages to use these cross plots. In the first step, using different cross plots such as Neutron-density and neutron- Sonic, apparent porosity is calculated. Secondly, using these values Pmaa, and Δtma are calculated. In the third stage, values are plotted against each other. If combination of three minerals is identified, one can determine percentage of each minerals by using chart CP-15 (Rezaie et al., 2010)
We can use these 2 parameters in the MID plots. In these graphs, the main points shows low distribution and axes of relevant values have real physical parameters(Clavier et al., 1971).
Due to lack of PEF (photoelectric factor), in well B, we don’t have M-N Cross plots and cross plot have been graphed just for well A (Fig 7).
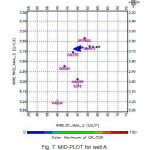 |
Figure 7: MID-PLOT for well A Click here to View figure |
Volume of Shale Calculation
Volume of shale is one of the most important parameters about petrophysical and reservoir quality studies. Shale can cause great changes in reservoirs. Shale is normally calculated by the CGR log (Qasim al-Askari et al., 2010). In this study, with adjustment of two logs CGR and SGR, the of effect element uranium abundance on log SGR has been revealed. Therefore, measuring the size of shale from the log CGR was performed according to equation 3. In this way, both maximum and minimum readings CGR have been performed in the regions with no cast wellbore in Sarvak formation.
In this relation, CGRmax is related to the Chile sector, CGRmin is relating to the clean sector and CGR is gamma chart reading at the desired depth.
According to Table 1, the calculated average volume of shale in upper Sarvak is too low and is around 1.39 per cent. Accordingly, Sarvak formation is considered as a clean ones.
Calculation of Porosity
Porosity is one of the essential parameters of reservoir rock, because it represents the amount of hydrocarbon deposits. Porous controlled by two factors sedimentary and diagenetic processes (Moradzadeh et al., 2009)
There are different methods to calculate the porosity which depend on the type of logs. To calculate the porosity, mainly logs neutron, density, sonic and resistivity plots are used. One or a combination of several plots can be used to calculate porosity (Hearst et al., 2000).
probabolistic methods (multimin) in GEOLOG software is based on simultaneous equations(Fertle et al., 1987). To calculated porosity, this study used density, neutrons and sonic diagrams that are described in the following.
Calculating Porosity Using a Log
Calculating Porosity Using a Log Neutron Log
Neutron logs are used for calculation of porosity. This tool shows the abundance of hydrogen or hydrogen index. The neutron tool answers to the volume of water which filled pores and measures porosity as relation 4.

In this case, φ: actual porosity, a and b are empirical constants, and N is value on the instrument.
Neutron log is calibrated for limestone, so in calcareous lithologies neutron log value will be the value of porosity, but dolomitic sandstone lithologies should be corrected for matrix.
The lithology correction for neutron log is a function of lithology, porosity and neutron log type (Fig 8).
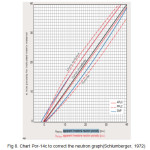 |
Figure 8: Chart Por-14c to correct the neutron graph(Schlumberger, 1972) Click here to View figure |
Calculated Porosity Using Density Tool
In the clean formation of porosity due to density log is calculated using equation 5.
Equation (5)
Given the matrix and fluid density, porosity can be calculated (Fig 9).
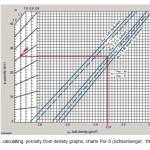 |
Figure 9: Calculating porosity from density graphs, charts Por-5 (Schlumberger, 1972). Click here to View figure |
Calculating Using Sonic Tool
This method is less important in comparison with neutrons. This method is usually used when the porosity of the rock is not integrated. The method is also desirable for calculating the initial porosity.
Secondary porosity is obtained from subtraction of sonic porosity with neutron and or density porosity. The amount of fluids in porous formations are affected on the transit time of sound and reduces the speed of it. Lesser the density of the filler fluid, the sound velocity will be lower (Fig 10).
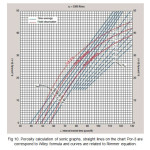 |
Figure 10: Porosity calculation of sonic graphs, straight lines on the chart Por-3 are correspond to Wiley formula and curves are related to Rimmer equation. Click here to View figure |
Dashed lines are drawn to the lack of compactness of the formula(Schlumberger, 1972).
Porosity Calculation Using Resistivity Logs
In this way, the Archie equation is used to obtain porosity.
This method is used when the sample is completely saturated with water.
In this way, the porosity can be determined using Equation 6 (Hearst et al., 2000).
Equation (6)
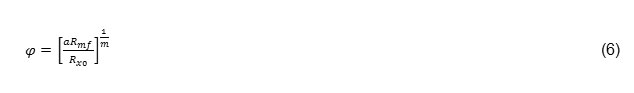
In this case, m and a are experimental constants, Rmf is filter mud resistivity and Rxo is resistivity area which is washed.
Porosity Calculation Using the Double Log
This method requires no background information and using neutron- density, neutron- sonic and density- sonic cross-plots porosity and lithology type can be determined and calculated.
Calculation Using Neutron- Density Cross Plot
In this method porosity is determined based on the values of neutron log which are plotted against the density log (Fig 11). The gas reservoir leads to reduction in the neutron log value. There are also a decrease in the density of the rock due to presence of gas and thus reduction in density tool value (Fig 11).
When double log of neutron and density are put together, the presence of gas may separate this two log from each which is referred to the effect of rotor. Fertel (Fertle et al., 1987) presented Equation 7 to determine the neutron- density porosity.

![Fig 11. Neutron- density Cross-plot to determine the porosity and lithology [19].](http://www.cwejournal.org/wp-content/uploads/2015/05/Vol10_Spe_Invest_Ata_Fig11-150x150.jpg) |
Figure 11: Neutron- density Cross-plot to determine the porosity and lithology [19]. Click here to View figure |
Porosity Calculation Using Neutron- Sonic Cross Plot
In this method, porosity is determined based on neutron log values against sonic log. In addition to porosity calculation, this cross plot is used to determine the lithology (Fig 12) (Fertle et al., 1987)
![Fig 12. Neutron- sonic cross-plot to determine porosity and lithology [19].](http://www.cwejournal.org/wp-content/uploads/2015/05/Vol10_Spe_Invest_Ata_Fig12-150x150.jpg) |
Figure 12: Neutron- sonic cross-plot to determine porosity and lithology [19]. Click here to View figure |
Porosity Calculation Using Density- Sonic Curve
In this method porosity is calculated based on plotting density log values versus sonic log (Fig 13).
![Fig 13. Sonic- density cross-plot to determine porosity and lithology [19].](http://www.cwejournal.org/wp-content/uploads/2015/05/Vol10_Spe_Invest_Ata_Fig13-150x150.jpg) |
Figure 13: Sonic- density cross-plot to determine porosity and lithology [19]. Click here to View figure |
If the neutron and density logs are not available, the porosity cannot be determined directly, without the knowledge of the lithology of the curve. When just sonic logs present for porosity and lithology is uncertain, the sonic- resistor curve is used.
The Amountof Water Saturation Determination
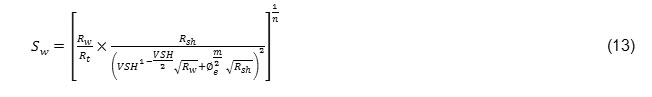
By definition, saturation is defined as the ratio of the volume occupied by the fluid to the total volume of the pores and it refers by 1. Water saturation is the percentage of voids which are occupied by water and it refers by Sw. The remaining fraction is consist of oil and gas which is equivalent to (1-Sw) and are known as saturated hydrocarbons and characterized by Shr sign (Qasim al-Askari et al., 2010). Water saturation is calculated from electrical resistivity curve of formation (Rezaie et al., 2010)
To calculate water saturation, two methods have been used and finally to select the best method, two methods have been compared with each:
Archie Relationship
In clean and Shale free formation water saturation is achieved by Archie method. Archie formula is based on the fact that the only conductive material in the formation is salt water; but in a sandy shale formations, ions that are released along with shale are also responsible for conducting electrical current. Presence of shale may reduce distortion in SP chart and increase actual conductivity (Ct). It should be noted that the ion exchange capacity, which indicates the potential of shale in the electrical conductivity, may shows a significant effect on the assessment of hydrocarbon formations.
For non-shale formations, Archie introduced the principle of formation’s resistivity factor
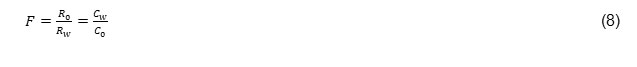
In this equation, R0 is the resistance of the formation which is 100% saturated by an electrolyte with resistance Rw such as water. C0 and Cw also considered as a conductor. C0 plot vs. Cw is a straight line through the origin with the slope in 1/F.
Archie concluded that resistance showed by clean formation is not only depend on the resistance of saturating salt water but also on the amount of electrolyte in the empty spaces in rocks. The results of Archie resistance equation confirmed this model for reservoir sandy formations.

Sw is the saturation of water as a fraction of empty spaces. n is saturation capacity and Ct is the conductivity of reservoir stone in the saturation time Sw.
The following formula can be considered as Archie formula:

a: Archie constant, mainly equal to 1
n: saturation capacity
m: Cementation Coefficient
∅: porosity
Rw: water resistivity of formation
Rt: real resistance
Sw: water saturation
According to the above definitions, in the clay mineral formations, water trapped between thin layers of shale leads to additional conductivity. This means that the Archie equation over estimates the water saturation than the real amount.
Indonesia Method
In this method, water saturation is calculated by the following equation. These have been performed by the GEOLOG software.
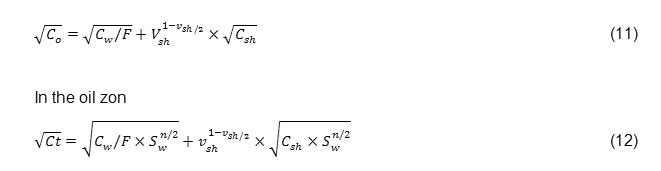
Co: electric conductivity of Hydrocarbon
Cw: electrical conductivity of water
F: Formation factor
Vsh: shale volume
Csh: electrical conductivity of shale
Ct: real conductivity of formation
Sw: water saturation
And also it could be written as:
After comparing two methods, one can say that:
Indonesia model estimates a considerable amounts for water saturation. But Archie model lacks this feature. Indonesian model calculates the water saturation with better accuracy. This is because of the fact that Indonesian model considers resistance factor and shale volume for calculations of water saturation.
Thus, Indonesia model was used to determine water saturation equation and the results are given in Table 1.
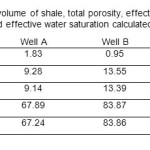 |
Table 1: The average volume of shale, total porosity, effective porosity, total water saturation, and effective water saturation calculated in wells A, B Click here to View table |
Reservoir Zoning and the Final Results of the Assessment
Usually zoning (modularity) is done by considering the answer of graphs in the reservoir. In this study, after data preparation, environmental improvement, analysis of data about petrophysical properties of well, upper Sarvak Formation in studied region was divided into 5 sections S1 to S5. Due to the specific characteristics, S2 is divided to 8 subdivision from S2-a to S2-h. well A in sub layer 2 with the effective average porosity of 19.3, effective water saturation of 12.6 and shale volume of 3.4% and also sub layer 3 with the effective average porosity of 9.5, effective water saturation of 27 and shale volume of 0.5% exhibit the best reservoir properties. Well B in sub layer 2 with the effective average porosity of 18.8, effective water saturation of 13.7 and without shale volume and in sub layer 3 with the effective average porosity of 12.4, effective water saturation of 51.5 and without shale volume exhibit the best reservoir properties. Third sector in well A with effective average porosity of 3.2, effective water saturation of 89.6 and shale volume of 17.2% and in well B with the effective average porosity of 5.3, effective water saturation of 100% (filled with water) and shale volume of 17.9% have the least reservoir properties. Finally, the S2 has been recognized as the best part of the reservoir with the dominant lime lithology and lowest shale value in sub layer 2 and 3. The zone S3 was identified as the weakest sector of the reservoir. (Fig 14).
 |
Figure 14: A and B wells and segmentation (zoning) studied in the field of upper Sarvak Click here to View figure |
Conclusion
Petrophysical evaluation in upper Sarvak in the studied field led to the following results:
- According to the petrophysical evaluation, lithology of the formation was determined as limestone, a few percentages of dolomite, and in small intervals, shale.
- According to final analysis of wells and determination of reservoir characteristics and also on the basis of resistivity, Neutron, density and Gamma logs and results obtain from analysis of wells A and B, upper Sarvak formation from top to bottom was divided to 5 parts and due to variation in porosity, part 2 was divided to 8 sublayer. Finally, zone S2 is identified as the best reservoir with the dominant lithology of limestone and with the lowest amount of shale in sublayers 2 and 3.
- Due to the low volume of shale (the average of 1.93 per cent), upper Sarvak formation can be considered as a clean formation.
References
- Tiab, D., "Advances in Petrophysics", Flow Units. Lecture Notes Manual, University of Oklahoma, Vol.8. (2010)
- Hearst J. R., Nelson P.H., and Paillet L., Well logging for physical properties, John Wiley & Sons Ltd,. Chilchester., 411-439. (2000)
- Aghanabati, S,. "Geological Survey of Iran", published by the Geological and Mineral Exploration, third edition, 586 p. Page.(2008)
- Motiee, H. Petroleum Geology of Carbonate Rocks, the Aryan Press, Vol. I, page 402 (2005)
- Drew Darvish Zadeh, A., Geology of Iran, Amir Kabir University Press, page 434 (2005).
- Ghalavand, H. "Profile stratigraphy and geological formations of the Mountain anticline Bangestan", 12 pp. Page.(2006)
- Quli, n., Habibinia, B. And Mohammedan, R., "Evaluation of visual diagrams Sarvak oil field in Iran", Journal of Applied Geology, Vol 7 (3): 254-245.(2011)
- Erin, M., "wrinkling" of extraterrestrial Press, 306 p. Page.(2010)
- Arian, M. "The history of petroleum geology of" extraterrestrial Press, 267 p. Page.(2010)
- Qasim al-Askari, M.k., "Principles of Petrophysics", praising Press, 499 p. Page.(2010)
- Fertle H.,. Open Hole cross-Plots Concepts-A Power-ful Technique in Well log Analysis, J.Pet.Tech,March, 535-549. (1987).
- Sajadian, V.a., Khalifa M. Mohammad Mohammadi, A.r. "A Comprehensive Guide Petroleum Engineering", Sonic Book Publishing, 419 pages (2011)
- Rezaie, M.r. And Chehraz AS,. "Graphical interpretation of well logs", Tehran University Press, second edition, 700 p. Page.(2010)
- Serra, O., "Fundamentals of Well-log interpretation", University of Paris, 487 pp. (2009)
- 15-Elins, L.F., “Evaluation In Determination of Residual Oil Saturation” , Interstate Oil Compact Commission, Oklahoma City, pp..177-254 (1978).
- 16-Clavier, C., Hoyle, W.& Meunier, D. Quantitative interpretation of thermal neutron decay time logs. Part I-Fundamentals and Techniques. Part II-Interpretation example, interpretation accuracy and time-Lapse technique._J.Petrol. Technol.,23,6. (1971).
- Moradzadeh, AS., Ghavami R., R., "Well logging for Engineers", Shahrood University Press, 394 p. Page(2009).
- Schlumberger, Inc. Log interpretation-Principles. Schlumberger Educational Services, Houston, TX, 213pp (1972).


