Optimization of Galena Flotation Process of Irankouh Complex Ore Using A Statistical Design of Experiments
Soroush Rahmati Shahreza1 * , Seyed Ziaodin Shafaei1 , Mohammad Noaparast1 and Mehdi Nasiri Sarvi2 *
http://dx.doi.org/10.12944/CWE.10.Special-Issue1.76
In this research the Taguchi and Response Surface method (RSM) were used to optimize the galena flotation process. The combination of Taguchi and RSM minimized the number of required experiments and gives the optimum condition. The effect of chemical parameters, namely type and dosage of collectors, dosage of starch, sodium cyanide, pH and neutralizing agent were investigated. The other parameters were selected in accordance with the condition being applied in the rougher stage flotation plant of Irankouh (Bama Co.), where the samples were chosen from. The total number of experiments designed with Taguchi and RSM for modeling the process was 42; instead of 240 experiments needed if only RSM is applied. In order to achieve the required experiments initially, the most important parameters were identified using Taguchi method and were optimized using response surface methodology (RSM). The results of experiment based on the industrial condition with no optimization showed lead recovery of 79%, zinc recovery of 23.2% and the grade of lead was 13.2%. After optimization no reduction in the grade of concentrates happened while the lead recovery was increased to 87% and zinc recovery was decreased to 17.3%, which shows a 10.1% and 25.3% improvement in lead and zinc recovery, respectively.
Copy the following to cite this article:
Shahreza S. R, Shafaei S. Z, Noaparast M, Sarvi M. N. Optimization of Galena Flotation Process of Irankouh Complex Ore Using A Statistical Design of Experiments. Special Issue of Curr World Environ 2015;10 (Special Issue May 2015). DOI:http://dx.doi.org/10.12944/CWE.10.Special-Issue1.76
Copy the following to cite this URL:
Shahreza S. R, Shafaei S. Z, Noaparast M, Sarvi M. N. Optimization of Galena Flotation Process of Irankouh Complex Ore Using A Statistical Design of Experiments. Special Issue of Curr World Environ 2015;10(Special Issue May 2015). Available from: http://www.cwejournal.org?p=758/
Download article (pdf)
Citation Manager
Publish History
Introduction
Due to the increasing consumption of metals in industries, exploration and extraction of new ores are inevitable. According to the completion of high grade reserves and reduction of the grade of ores extracted from mines in recent years, advances in mineral processing for concentration of complex ores was a subject of researches for these industries. However, flotation is a prevalent method for enrichment of most minerals, the high operating costs forced scientists and engineers to select the type and amount of chemical materials more carefully in order to achieve the highest economic efficiency (Van Nieuwenhuijzen and Van der Graaf, 2011).
Galena is known as silver host in addition to lead production role, so about 85% of the world’s silver is produced from the galena mineral (Bulatovic, 2007). Although flotation is known as the main method for enrichment of this ore, operation costs and complexity of this method should be considered for better selection and optimization of chemical reagent types and dosage to get higher recovery and higher grade concentrates (Li and Zhang, 2012). To make the flotation process commercially efficient, physicochemical properties of the ore must be determined and the amount of chemical consumption must be tuned to reduce the costs for production higher grade of concentrates at maximum recovery (Mehrabani et al., 2010). In addition in galena flotation it is important to completely remove the zinc in lead concentrates to reduce the waste of this resource and prevent penalty to concentrates (Wills, 2011).For galena, zinc and copper metals usually have been identified as recoverable valuable minerals(Li and Zhang, 2012). Although the amount of these minerals cannot be completely removed, they should be minimized. In this case study the only valuable minerals are galena and sphalerite, so the grade and recovery of zinc in the lead concentrates must be reduced as possible.
Design of experiments (DOE)(Jacquez, 1998; Park, 2007) is a methodology using mathematical principles to design and analysis experiments of a process in different conditions. Taguchi method (Roy, 2001; Roy, 2010) is used usually for optimization of the number of experiments. This method gives a lot of information about parameters affecting the results of experiments by minimum number of tests; therefore this method reduces the costs and the time of the experiments(Taguchi, 1986; Wang and Huang, 2007). The Taguchi crossed array layout consists of an inner array and an outer array (Sadrzadeh and Mohammadi, 2008). The inner array is made up of the orthogonal array (OA) selected from all possible combinations of the controllable factors. Using the orthogonal array specially designed for the Taguchi method, the optimum experimental conditions can be easily determined (Taguchi, 1986).
The main obstacle of Taguchi method is giving absolutely no data about interactions between parameters of the process. Factorial design of experiment is the only approach that can recognize interactions of parameters in the process. This method gives appropriate model for responses which considers the interactions of different parameters (Mendenhall and Sincich, 2003; Vazifeh et al., 2010). Although this method gives many data about the interactions of parameters, the number of experiments becomes immoderate when the number of parameters, or levels of them, becomes relatively large and also the interpretation of these interactions is very hard (Montgomery, 2008).
The response surface methodology (RMS) (Anderson and Whitcomb, 2005; Azizi et al., 2012; Myers et al., 2009; Rajashekhar and Ellingwood, 1993; Veetil et al., 2014) is a mathematical and statistical technique which is useful for modeling and optimizing the responses and analyzing the interactions of parameters (Mehrabani et al., 2010; Montgomery, 2008). RMS uses statistical and mathematical methods to model the process and parameters effect on the responses. The main application of this method is to optimize the process by determining the response surface of results. RSM obtains the best model of results and determines the fitted response surface and specifies the best point of the surface, minimum or maximum of the surface depends on the goal of research, of process model and determine the conditions which give these results(Aslan, 2007a; Aslan, 2007b; Gunaraj and Murugan, 1999; Kwak, 2005).
Here Taguchi and response surface method were used to reduce the number of experiments of optimization study. The most important parameters were obtained by analyzing Taguchi's experiments and RSM's experiments were carried out for modeling and optimizing the responses, these models based on only important parameters. This approach reduced the number of required experiments. The number of the experiment need to be done for optimizing the galena flotation process, for three categorical and four numerical parameters was 240, but using this approach reduced impressive the number of experiments.
Materials and Experiments
The chemical were used can be categorized as collector, depressant, modifier and frother, all were industrial grade. The collector was chosen from three different collectors as Potassium Ethyl Xanthate (KEX), Aerophine3418A and Danafloat067. KEX is the current used collector in Bama flotation plant and most other lead flotation plants. The KEX was supplied from Minab Co. in Iran for industrial application. Aerophine3418A is a product of Cytec Company that is designed and developed for lead ores with high amount of silver. Danafloat067 is a product of Cheminova Company.
Sodium cyanide (NaCN), Zinc sulphate and starch as depressants were supplied from Minab Company and Dr. Mojalali Company. PEB 70, which was made by Isfahan Copolymer Co., was used as frother.
The required samples were taken from number 2 flotation plant’s ball mill product in Irankouh Complex. Sampling was taken 6 times in every 8 hour shift during a month of work (a total of 540 times). After sampling, the samples were mixed, homogenized and riffled to have small samples, 750 g, for flotation experiments and analytical uses.
The X-ray diffraction (XRD) and X-ray fluorescence (XRF) analysis were applied for characterization of constitutive minerals of the sample. XRD data were collected using a Bruker D8-Advance with a copper tube (40 kV, 30 mA) and XRF data were collected by Philips PW2400 with 3000 W. The data of XRD (fig. 1) and XRF (table 1) show that sphalerite and galena were the main valuable minerals and siderite, dolomite, quartz, pyrite, barite and hematite characterized as main gangue minerals. The amount of lead, zinc, magnesium, iron and copper, which were measured by atomic absorption device (Varian AA-1275), were 1.44%, 2.41%, 2.75%, 4.48% and 0.04%, respectively. The percentage of lead and zinc in oxide phase were 0.9% and 0.76%, respectively. The comprehensive qualitative study was carried out using 10 polished sections and microscopic study. The degree of liberation of galena was determined to be 75 microns. To calculate actual density of ore, pycnometer was used and also work index of ore were determined by bond ball mill to find the mechanical behavior and energy consumption in grinding circuit. Actual density and bulk density of ore were 3.0 g/cm3 and 1.62 g/cm3, respectively. The amount work index of ore, calculated with bond ball mill, was obtained as 13.06 kWh/short ton.
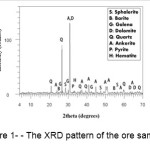 |
Figure 1: The XRD pattern of the ore sample Click here to View figure |
Table 1: Chemical composition of the sample using XRF.
|
Component |
Weight (%) |
Component |
Weight (%) |
|
ZnO |
2.92 |
SiO2 |
24.1 |
|
PbO |
0.8 |
SO3 |
1.48 |
|
BaO |
0.74 |
CaO |
20.9 |
|
MgO |
11.6 |
MnO |
1.1 |
|
Al2O3 |
2.06 |
Fe2O3 |
5.6 |
Flotation Experiments
For flotation experiments a 30% w/w solid to liquid pulp were prepared for all experiments. This pulp poured in 2 L Denver flotation cell and well mixed. After that depressants were added to the pulp and let them mixing for 7 minutes and after this time collector and frother were added. Conditioning time of interaction collector with galena was 8 minutes. The froths, lead concentrates, were collected in 1 minute.
Most effective parameters in galena flotation (i.e., galena recovery, grade of lead in galena concentrates and zinc recovery) and their efficient ranges were obtained using the Taguchi methodology and then optimization study was done using RSM.
Initial Experiment
Initially, one experiment was done based on the Bama plant condition, but in laboratory scale. The amount of chemicals consumed in this experiment is summarized in Table 2.
Table 2: The type and the amount of chemicals used in primary experiment.
|
Parameter |
Unit |
Type/Amount |
|
Type of collector |
- |
KEX |
|
Dosage of collector |
g/t |
40 |
|
Dosage of Sodium cyanide |
g/t |
60 |
|
Dosage of zinc sulfate |
g/t |
600 |
|
Dosage of starch |
g/t |
0 |
|
pH |
- |
8 |
|
pH regulator |
- |
CaO |
Taguchi's Experiments
Effective parameters in the flotation of lead were divided into two types, controllable and fixed which are given in Tables 3 and 4, respectively.
Table 3: The fixed parameters for galena flotation.
|
Parameter name |
Amount |
|
Solids (%) |
30 |
|
Cell volume (lit) |
2 |
|
Rotor speed (rpm) |
700 |
|
Type and amount of frother |
PEB70, 80 g/t |
|
Frothing time (min) |
1 |
The amount and the type of each controllable factor were determined in 2 or 3 levels according to Table 3. According to the factors and their levels the Taguchi L18 was selected which 6 factors in 3 levels and 2 factors in 2 levels were experimented.
Table 4: Types and levels of Controllable parameters were investigated in this study.
|
Parameter Symbol |
Parameter name |
Unit |
Number of Levels |
1st level (-1) |
2nd level (0) |
3rd level (+1) |
|
A |
Type of collector |
- |
3 |
KEX |
Aerophine3418A |
Danafloat067 |
|
B |
Dosage of collector |
g/t |
3 |
Low |
Medium |
High |
|
C |
Dosage of Sodium cyanide |
g/t |
3 |
20 |
60 |
100 |
|
D |
Dosage of zinc sulfate |
g/t |
3 |
600 |
1000 |
4000 |
|
E |
Dosage of starch |
g/t |
3 |
0 |
500 |
1000 |
|
F |
pH |
- |
3 |
7 |
8 |
9 |
|
G |
pH regulator |
- |
2 |
CaO |
- |
Na2CO3 |
According to the relation between amount and types of consumed collector, dosage of collector was divided into low, medium and high, instead of a constant amount for all collectors. Dosages of KEX collector were 20, 45 and 70 g/ton while for Aerophine3418A and Danafloat067 were 7, 15 and 23 g/ton. This helped us to choose the collector dosage to be comparable.
RSM's Experiments
It was found that the parameters of collector type, dosage of zinc sulfate and dosage of starch were more important than the other parameters on the flotation of galena. Type of collector was categorical and dosage of starch and zinc sulfate were numerical factors studied.
The collector type parameter was chosen in two levels, instead of three levels, according to the relatively better answer of Aerophine3418A this collector was chosen as one level and the second collector was KEX because it was cheaper and more available than Danafloat067. According to the applied experiments the Danafloat067 did not show a remarkable advantage than KEX.
The central composite design, CCD, was used to design and analyses of experiments. Table 5 shows the levels of parameters of RSM experiments.
Table 5: The factors and levels of CCD design.
|
Parameters symbol |
Parameter |
Unit |
High level (+1) |
Low level (-1) |
|
A |
Collector type |
- |
Aerophine3418A |
KEX |
|
D |
Dosage of zinc sulfate |
g/t |
4000 |
`700 |
|
E |
Dosage of starch |
g/t |
1500 |
500 |
Results and Discussion
Bama Plant Condition
First, one experiment with the Bama plant condition (Table 2) was carried out. The lead grade of lead in concentrates, lead recovery and zinc recovery as the results of this experiment were 13.2%, 79% and 23.2%, respectively. These results were used for comparing the optimized condition and plant condition.
Taguchi Experiments
The conditions of Taguchi's experiments, were designed using a demo version of DX7 software (Design Expert software), and results of each one are given in Table 6.
The condition of these experiments and results of each one were used for obtaining parameters affecting of galena flotation most. Statistical values of Taguchi experiments models is shown in Table 7. This data were obtained using ANOVA analyze of conditions and results of experiments. As shown in Table 7 the difference of the amount of predicted R2 and adjusted R2 for all models is less than 0.4 and the adequate precision is more than 4 which indicate the appropriate fit of the data in the model. They indicate the appropriate fit of the data in the model.
Table 6: The conditions and results of Taguchi experiments.
|
Run |
Symbol of Controllable parameter |
Results |
||||||||
|
A |
B |
C |
D |
E |
F |
G |
Pb grade in concentrate (%) |
Pb Recovery (%) |
Zn Recovery (%) |
|
|
1 |
0 |
-1 |
0 |
1 |
-1 |
0 |
-1 |
20.8 |
80.75 |
10.71 |
|
2 |
-1 |
-1 |
0 |
0 |
0 |
1 |
-1 |
12.0 |
83.10 |
21.50 |
|
3 |
0 |
1 |
0 |
-1 |
0 |
-1 |
-1 |
17.8 |
83.14 |
20.15 |
|
4 |
-1 |
0 |
1 |
1 |
-1 |
1 |
-1 |
14.8 |
85.26 |
18.40 |
|
5 |
1 |
0 |
0 |
0 |
-1 |
-1 |
1 |
13.2 |
77.74 |
13.08 |
|
6 |
-1 |
0 |
0 |
-1 |
1 |
0 |
-1 |
6.3 |
88.54 |
58.37 |
|
7 |
1 |
1 |
0 |
1 |
1 |
1 |
1 |
12 |
82.92 |
15.02 |
|
8 |
1 |
0 |
-1 |
-1 |
0 |
1 |
-1 |
11.6 |
76.57 |
13.13 |
|
9 |
1 |
1 |
1 |
-1 |
-1 |
0 |
-1 |
10.4 |
77.26 |
15.96 |
|
10 |
-1 |
1 |
1 |
0 |
1 |
-1 |
-1 |
8.0 |
83.88 |
44.56 |
|
11 |
-1 |
1 |
-1 |
1 |
0 |
0 |
1 |
11.6 |
83.70 |
19.78 |
|
12 |
0 |
-1 |
1 |
-1 |
1 |
1 |
1 |
14.4 |
83.42 |
28.90 |
|
13 |
1 |
-1 |
-1 |
0 |
1 |
0 |
-1 |
15.4 |
84.34 |
11.83 |
|
14 |
0 |
0 |
-1 |
1 |
1 |
-1 |
-1 |
13.8 |
88.25 |
17.35 |
|
15 |
1 |
-1 |
1 |
1 |
0 |
-1 |
-1 |
16.4 |
81.03 |
11.11 |
|
16 |
0 |
0 |
1 |
0 |
0 |
0 |
1 |
13.2 |
81.53 |
17.44 |
|
17 |
-1 |
-1 |
-1 |
-1 |
-1 |
-1 |
1 |
9.6 |
87.87 |
44.04 |
|
18 |
0 |
1 |
-1 |
0 |
-1 |
1 |
-1 |
10.4 |
81.22 |
19.68 |
Table 7: Statistical values of Taguchi experiments models.
|
Result |
Main parameters |
Mean |
R-squared |
Adj R-squared |
Pred R-squared |
Adeq precision |
p-value |
|
lead grade in lead concentrates |
A and D |
25.99 |
0.50 |
0.35 |
0.04 |
5.31 |
0.0467 |
|
Lead recovery |
A and E |
35.29 |
0.69 |
0.59 |
0.40 |
7.77 |
0.0029 |
|
Zinc recovery |
A,D and E |
427.03 |
0.85 |
0.76 |
0.59 |
11.84 |
0.0006 |
The effect of the type of collector on the grade of concentrates (Figure 2-a) showed the maximum grade of lead in the lead concentrates achieved using Aerophine3418A. The effect of dosage of zinc sulfate is shown in the Figure 2-b. As it is indicated in the Figure 2-b, when zinc sulfate used in the range of 600 to 1000 g/t, the effect of variance of this parameter on the lead grade in the lead concentrates was not significant but the grade of lead increased by increasing the dosage of zinc sulfate.
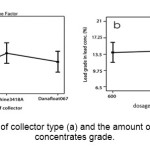 |
Figure 2: the effect of collector type (a) and the amount of zinc sulfate (b) on concentrates grade. Click here to View figure |
The effect of the type of collector on lead recovery diagram is shown in Figure 3-a. As can be seen, maximum lead recovery achieved by using KEX. The other effective parameter was dosage of starch, the effect of starch dosage on recovery of lead is shown in the Figure 3-b. As it is shown using the starch in the range of 0 to 500 g/t, the variance of this parameter has no significant effect on lead recovery, but by increasing of starch amount the recovery of lead increased drastically.
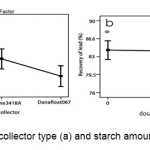 |
Figure 3: the effect of collector type (a) and starch amount (b) on lead recovery. Click here to View figure |
The effect of collector type on the zinc recovery diagram is provided in the Figure 4-a. As it is clear, the maximum recovery of zinc was achieved by using KEX and minimum recovery related to using of Dabafloat067. The dosage of starch in the range of 0 to 500 g/t has no significant effect on the recovery of zinc. However, at higher dosage (above 500 g/t) this parameter increases the zinc recovery significantly (Figure 4-b). The other effective parameter was zinc sulfate dosage (Figure 4-c). In the ranges that the zinc sulfate was used increasing its dosage reduced the recovery of zinc.
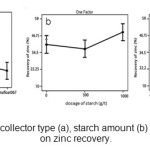 |
Figure 4: The effect of collector type (a), starch amount (b) zinc sulfate amount (c) on zinc recovery. Click here to View figure |
Based on the statistical results (Table 7), type of collector and dosage of zinc sulfate for lead grade in concentrates, type of collector and dosage of starch for lead recovery and type of collector, dosage of starch and zinc sulfate for zinc recovery were more important than other parameters.
Response Surface Method Experiments
Table 8 shows the matrix of parameters and results of RSM experiments. The data of Table 8 were analyzed by ANOVA method to model the results. The statistical data are shown in Table 9. The calculated amount of correlation coefficient of model parameters to the designed amount and desirability of predicted values by model is comparable (difference predicted R2 and adjusted R2 is less than 0.4) with well adequate precision (greater than 4).
Table 8: Designed matrix and results of RSM's experiments.
|
Run |
Symbol of Controllable parameter |
Results |
||||
|
A |
D |
E |
Pb grade in concentrate (%) |
Pb Recovery (%) |
Zn Recovery (%) |
|
|
1 |
-1 |
1.41 |
0 |
16.4 |
87.65 |
14.22 |
|
2 |
1 |
0 |
0 |
12.4 |
97.47 |
17.8 |
|
3 |
1 |
-1 |
1 |
7.0 |
83.45 |
19.16 |
|
4 |
-1 |
1 |
-1 |
14.2 |
86.46 |
19.08 |
|
5 |
-1 |
1 |
1 |
13.4 |
83.44 |
18.19 |
|
6 |
-1 |
-1.41 |
0 |
10.2 |
88.52 |
72.51 |
|
7 |
1 |
-1.41 |
0 |
10.4 |
88.27 |
57.17 |
|
8 |
-1 |
0 |
1.41 |
13.6 |
78.77 |
15.89 |
|
9 |
1 |
1 |
-1 |
15.4 |
77.26 |
14.17 |
|
10 |
-1 |
-1 |
1 |
10.4 |
88.4 |
29.36 |
|
11 |
1 |
-1 |
-1 |
13.2 |
83.11 |
18.96 |
|
12 |
1 |
0 |
0 |
12.2 |
97.23 |
16.67 |
|
13 |
-1 |
0 |
0 |
11.7 |
94.04 |
19.88 |
|
14 |
1 |
0 |
1.41 |
14.8 |
97.51 |
17.96 |
|
15 |
-1 |
-1 |
-1 |
12.0 |
97.63 |
28.38 |
|
16 |
1 |
0 |
0 |
12.5 |
96.02 |
17.80 |
|
17 |
1 |
1.41 |
0 |
10.4 |
88.07 |
20.22 |
|
18 |
1 |
1 |
1 |
16.0 |
97.63 |
16.18 |
|
19 |
-1 |
0 |
0 |
11.9 |
94.66 |
19.56 |
|
20 |
-1 |
0 |
-1.41 |
13.6 |
89.55 |
18.09 |
|
21 |
-1 |
0 |
0 |
11.80 |
94.85 |
19.11 |
|
22 |
1 |
0 |
-1.41 |
13.4 |
97.44 |
17.28 |
Table 9: Statistical values of RSM experiments models.
|
Result |
Main parameters |
Mean |
R-squared |
Adj R-squared |
Pred R-squared |
Adeq precision |
p-value |
|
lead grade in concentrates |
D, DE and E2 |
18.88 |
0.57 |
0.5 |
0.29 |
8.62 |
0.0013 |
|
Lead recovery |
DE, E2 and D2 |
112.98 |
0.38 |
0.28 |
0.07 |
4.55 |
0.0065 |
|
Zinc recovery |
D and D2 |
0.002 |
0.72 |
0.69 |
0.58 |
12.49 |
0.0001 |
The fitted mathematical model to calculate lead grade in lead concentrates is given in equation 1. The three dimensional graphical and contour forms of the model are presented in Figure 5.
Lead grade in concentrate = +11.94 + 1.57 D + 0.95 DE + 0.89 E2 (1)
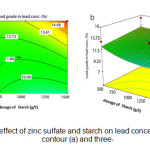 |
Figure 5: The effect of zinc sulfate and starch on lead concentrates grade in contour (a) and three- Click here to View figure |
As can be seen in Figure 5, increasing the zinc sulfate dosage led to increase the grade of lead concentrates and this was due to the depression of sphalerite. The results show a complex interaction of starch and zinc sulfate, which couldn't be recognized by Taguchi's experiments. It can be observed from the Figure 5 that the effect of dosage of zinc sulfate in increasing the grade of lead in the concentrate is greater when higher amount of starch is used as well. It seems that this phenomenon occurred because of the different role of starch as dispersants, modifier and depression in different dosage of zinc sulfate.
The mathematical model for lead recovery is shown in equation 2. The three dimensional graphical and contour forms of the model are presented in Figure 6.
Recovery of lead = +95.71 + 3.28 DE– 3.02 E2 – 4.37 D2 (2)
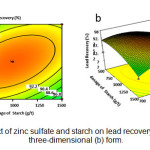 |
Figure 6: The effect of zinc sulfate and starch on lead recovery in contour (a) and three-dimensional (b) form. Click here to View figure |
As it is clear from the Figures 6, dosage of zinc sulfate and starch had a complex interaction, similar to lead grade in concentrates response. At low levels of zinc sulfate dosage, increasing starch dosage led to decrease lead recovery, but in high levels of zinc sulfate dosage it was on the contrary. Increasing dosage of zinc sulfate initially improves the lead recovery; but increasing above a specific amount, the recovery declined. The optimum dosage of the recovery of lead happened at different amount of zinc sulfate depending on the amount of starch dosage.
The best transformation proposed by software for modeling of zinc recovery was the reversed format. The dosage of zinc sulfate was the only parameter affecting the zinc recovery response. The mathematical of formulation of the model is shown in equation 3. The diagram of zinc recovery model is presented in Figure 7. As it is clear from Figure 7, increasing dosage of zinc sulfate led to decrease the recovery of zinc response. The phenomenon happened because of the sphalerite depression role of zinc sulfate.
1/ (Recovery of Zn) = +0.024 + 2.13× 10⁻⁵ B – 2.99 × 10⁻⁹ B2 (3)
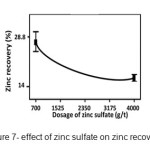 |
Figure 7: effect of zinc sulfate on zinc recovery. Click here to View figure |
Optimum Condition Prediction
In order to determine the optimal condition, the importance of parameters and answers must be scored and the optimal status of each factor (maximum or minimum) must be determined. For optimization of lead flotation the lead grade in the concentrates and recovery of lead should be maximized and recovery of zinc should be minimized. Also, decreasing of chemical agents led to better economic condition. The score of each factor of increasing lead grade in concentrates, increasing lead recovery, decreasing zinc recovery, decreasing dosage of zinc sulfate and decreasing dosage of starch were considered as 4, 5, 3, 1 and 1, respectively. The optimal condition was obtained based on these scores which amount of factors is presented in Table 10. Also the predicted lead grade in concentrates, lead recovery and zinc recovery were calculated as 12.8%, 96% and 18%, respectively.
Table 10: Prediction of parameter's levels for the optimized conditions.
|
Parameter |
Unit |
Amount |
|
Type of collector |
- |
KEX |
|
Dosage of collector |
g/t |
20 |
|
Dosage of Sodium cyanide |
g/t |
20 |
|
Dosage of zinc sulfate |
g/t |
2066 |
|
Dosage of starch |
g/t |
500 |
|
pH |
- |
8 |
|
pH regulator |
- |
CaO |
Validation of Predicted Optimal Condition
In order to validate predicted levels of parameters, two experiments were carried out in optimal condition and the actual values were compared with predicted values. The results of two experiments in the optimal condition (actual values) and the predicted values are presented in the Table 11.
Table 11: The comparison of predicted answers and the actual values in two times repeat.
|
Experiments answer |
|||
|
Grade of lead concentrates (%) |
Lead recovery (%) |
Zinc recovery (%) |
|
|
Predicted results |
12.8 |
96 |
18 |
|
1st Optimized experiment |
13.5 |
86 |
17.4 |
|
2nd Optimized experiment |
13.6 |
88 |
17.2 |
|
Relative Error (%) |
+3 |
-9 |
-4 |
Comparison of the results obtained in optimized condition with the Bama plant condition shows 2.6%, 10.1% and 25 % improvement in grade of lead in lead concentrates, lead recovery and zinc recovery in galena flotation, respectively. Due to the low grade of feed, improvement in lead grade in lead concentrates was not significant. Changing of the lead and zinc recovery showed drastic improvement. Since the Bama is one of the biggest lead concentrate producer in Iran, this optimization study can improve the effectiveness of the process in industrial scale.
Conclusion
In this study, seven parameters which affect the galena flotation were investigated using the results of experiments designed by Taguchi method followed by optimization of designed by RSM. Combination employment of Taguchi and RSM the number of experiments was carried out for this study determined to be 40 experiments which are much lower than number of experiments if only RSM is used (240 experiments). In this study at first the Taguchi method was used for choosing the important parameters and then optimization study was chased up using CCD design in response surface methodology.
The important parameters of galena flotation were found to be collector type, dosage of zinc sulfate and dosage of starch that the appropriate parameters were determined using optimization experiments. The lead recovery was increased from 79% to 87% with no significant changes in the lead grade of products based on optimization study. Also zinc recovery was reduced from 23.2% to 17.3%, which shows a 25.3 % improvement.
References
- Anderson, M.J. and Whitcomb, P.J. RSM simplified: optimizing processes using response surface methods for design of experiments( Productivity press, 2005).
- Aslan, N. Application of response surface methodology and central composite rotatable design for modeling the influence of some operating variables of a Multi-Gravity Separator for coal cleaning, Fuel, 86(5), 769-776 (2007).
- Aslan, N. Modeling and optimization of Multi-Gravity Separator to produce celestite concentrate, Powder Technology, 174(3), 127-133 (2007).
- Azizi, D.; Shafaei, S.Z.; Noaparast, M. and Abdollahi, H. Modeling and optimization of low-grade Mn bearing ore leaching using response surface methodology and central composite rotatable design, Transactions of Nonferrous Metals Society of China, 22(9), 2295-2305 (2012).
- Bulatovic, S.M. Handbook of flotation reagents: chemistry, theory and practice: Volume 1: flotation of sulfide ores (Elsevier, 2007).
- Gunaraj, V. and Murugan, N. Application of response surface methodology for predicting weld bead quality in submerged arc welding of pipes, Journal of Materials Processing Technology, 88(1), 266-275(1999).
- Jacquez, J.A. Design of experiments, Journal of the Franklin Institute, 335(2), 259-279(1998).
- Kwak, J.S. Application of Taguchi and response surface methodologies for geometric error in surface grinding process, International Journal of Machine Tools and Manufacture, 45(3), 327-334 (2005).
- Li, M.M. and Zhang, Q.D. Experimental Study on Flotation Process Conditions of Lead-Zinc Ore, Advanced Materials Research, Trans Tech Publ, 183-188 (2012).
- Mehrabani, J.; Noaparast, M.; Mousavi, S.; Dehghan, R. and Ghorbani, A. Process optimization and modelling of sphalerite flotation from a low-grade Zn-Pb ore using response surface methodology, Separation and Purification Technology, 72(3), 242-249 (2010).
- Mendenhall, W. and Sincich, T. A second course Sakomura, NK, 2004. Modeling energy utilization in in Statistics: Regression Analysis, (Pearson broiler breeders, 2003).
- Montgomery, D.C. Design and analysis of experiments, ( John Wiley & Sons, 2008)
- Myers, R.H.; Montgomery, D.C. and Anderson-Cook, C.M. Response surface methodology: process and product optimization using designed experiments, ( John Wiley & Sons, 2009).
- Park, G.-J. Design of experiments, ( Analytic Methods for Design Practice, 2007).
- Rajashekhar, M.R. and Ellingwood, B.R. A new look at the response surface approach for reliability analysis, Structural safety, 12(3), 205-220 (1993).
- Roy, R.K. Design of experiments using the Taguchi approach: 16 steps to product and process improvement (John Wiley & Sons, 2001).
- Roy, R.K. A primer on the Taguchi method ( Society of Manufacturing Engineers, 2010).
- Sadrzadeh, M. and Mohammadi, T. Sea water desalination using electrodialysis, Desalination, 221(1), 440-447 (2008).
- Taguchi, G. Introduction to quality engineering: designing quality into products and processes (1986).
- Van Nieuwenhuijzen, A. and Van der Graaf, J. Handbook on particle separation processes ( Iwa Publishing, 2011).
- Vazifeh, Y.; Jorjani, E. and Bagherian, A. Optimization of reagent dosages for copper flotation using statistical technique, Transactions of Nonferrous Metals Society of China, 20(12), 2371-2378 (2010).
- Veetil, D.P.; Mercier, G.; Blais, J.-F. and Chartier, M. Optimization of operating parameters for the selective flotation of heavy metals from contaminated fine sediment using response surface model, Soil and Sediment Contamination: An International Journal, 23(2), 107-125 (2014).
- Wang, T.-Y. and Huang, C.-Y. Improving forecasting performance by employing the Taguchi method, European journal of operational research, 176(2), 1052-1065 (2007).
- Wills, B.A. Wills' mineral processing technology: an introduction to the practical aspects of ore treatment and mineral recovery ( Butterworth-Heinemann, 2011).


