The Comparison of Seismic Effects of Near-Field and Far-Field Earthquakes on Relative Displacement of Seven-Storey Concrete Building With Shear Wall
Mahdi Heydari1 * and Mahdi Mousavi2
http://dx.doi.org/10.12944/CWE.10.Special-Issue1.07
In the past few years, numerous studies on the effects of near-field earthquakes on the response of structures and their differences with far-field earthquakes imply the attention of researchers to this issue. In this regard, the objectives of present study are to study the effects of near-field earthquakes on the behavior of structures and to compare these types of earthquakes with far-field ones. To do this, the characterization of near-field earthquakes and their descriptions are used to define the differences between near-field and far-field earthquakes in regard to radically distinctive responses of structures. In the present study, the incremental dynamic analysis of a seven-storey building with concrete structure for few near-field and far-field earthquakes is done and the associated diagrams of relative structural displacement are compared. In the end, the comparison of these plots is used to denote the differences in the structural behaviors of these two types of earthquakes.
Copy the following to cite this article:
Heydari M, Mousavi M. The Comparison of Seismic Effects of Near-Field and Far-Field Earthquakes on Relative Displacement of Seven-Storey Concrete Building With Shear Wall. Special Issue of Curr World Environ 2015;10(Special Issue May 2015). DOI:http://dx.doi.org/10.12944/CWE.10.Special-Issue1.07
Copy the following to cite this URL:
Heydari M, Mousavi M. The Comparison of Seismic Effects of Near-Field and Far-Field Earthquakes on Relative Displacement of Seven-Storey Concrete Building With Shear Wall. Special Issue of Curr World Environ 2015;10(Special Issue May 2015). Available from: http://www.cwejournal.org?p=723/
Download article (pdf)
Citation Manager
Publish History
Introduction
In the past few years, there have been numerous studies on earthquake engineering all of which endeavor to identify this natural phenomenon and to provide solutions for reduction of consequent damages and costs. These studies have led to significant and positive results but they do not show the end of discussions and scientific demands of human beings in regard to complicated phenomenon of earthquake. Due to presence of water reservoirs near the faults, residential regions and cities are constructed near to the faults as the primary sources of seismic waves. The close analysis of earthquakes in these regions which are called “near-field earthquakes” are inevitable.
Despite of numerous studies on near-field earthquakes, the examination of responses of structures against these earthquakes of near-field and far-field types and their differences is needed. In the present study, the authors endeavor to delve into these subjects more deeply. One of the objectives of present study is to provide precise solutions of the performance of structures during near-field earthquakes. In addition, the differences in behaviors of structures for multiple records of near-field and far-field earthquakes are analyzed through Seismostruct Software.
Definition of Near-Field Earthquake
The earthquakes which occur in fields close to the fault are called near-field earthquakes. In regard to determination of a definite range as the near field of the fault, there are disputes among the researchers. As a result, the researchers suggest different distances of 10-60 kilometers around the fault as the near-field range. For example, UBC-97 Code considers a distance of less than 15 kilometers from the earthquake epicenter as the near-field range.
Characteristics of Near-Field Earthquakes
Near-field earthquakes have distinctive characteristics different from far-field ones. Near-field earthquakes have higher acceleration and more limited frequencies compared with higher frequencies of far-field earthquakes. The seismographs of such earthquakes, especially when they undergo progressive direction effects, contain long-pulse periods of high ranges observed at the onset of earthquake records.3 The propagation of fault towards a site with a velocity close to the one of shear wave (0.8 ) leads to transfer of a major portion of fault’s energy to the site with a large pulse which occurs at the beginning of seismogram. In other words, if one supposes that each part of fault’s length ruptures in a definite period of time, some waves are transferred to the site in a fault-to-fault manner and if the site is in the same direction with the fault, these waves get close to each other in the site location and generate a large pulse which lessens the length of time during which the fault waves get to the structure (i.e. progressive direction). If the site is in reverse orientation with progress of the fault, the reverse might occur which leads to incrementally higher distances among the fault waves and higher duration which the waves get to the structure. Neutral orientation is the case in which the remoteness or closeness of fault propagation from the site is indistinguishable. In such a case, orientation has no distinctive effect upon the range and duration of earthquake.2 In Fourier spectrum of near-field earthquakes, there is no spectrum in a large periodical range with maximum value but a spectrum which becomes maximal in a smaller range and definite period. The existence of such characteristics in near-field earthquakes leads to a case in which the behavior of structure exits from modular scenario. In modular scenario, one or more structural modes determine the behavior of a structure and attain a wave-like form. In such a situation, the behavior of the structure results from the accumulative effects of waves passing through the structure. These wave-like effects are the reason for the influence of near-field movements on the behavior of tall structures. Regarding these pulses of long periods, one should note that due to closeness of period of these motions to natural vacillation period of tall structures, the behavior of structure tends towards resonance. Such a situation generates the possibility of large structural displacements which results in increase of P-delta effect upon the oscillatory behavior of tall structures. The emergence of pulse at the onset of record manifests the release of significant kinetic energy in a short period of time due to fault failure. In a short period of time, a large kinetic energy is transferred to the structure. This issue is one of the most significant characteristics of ground motion records in near field of the fault. In addition to resonance in structures with long periods, this phenomenon influences the materials used in construction of structures due to application of forces as pulses and it leads to a more fragile behavior of the structure.3
Incremental Dynamic Analysis Method
The incremental dynamic analysis method (IDA) is an analytical method recently developed for calculation of performance of a structure under seismic loads. This method includes the behavior of a structural model under one or more seismic motions. In this model, each earthquake is scaled in multiple levels so that depiction of diagrams of parametric response is done for different intensities of earthquake. In this type of analysis, in addition to the effects of live and dead loads, dynamic loads are applied on the structural foundation nodes in direction of y-axis. In the first place, the initial and final scale factor of the first and the last implementations are inserted and an interval for each scale factor is define to consider the middle levels of historical record. In this analysis, the mentioned numbers 1, 0.1, 0 and 0.3 were inserted into the model. This means that in the first analysis of historical records, all the values of acceleration in the curve of acceleration-time diagram are multiplied by 0.1 and then, they are applied on the structure. In the second analysis in which the scale factor equals 4 and 3=0, 1+0 and 0 are multiplied by the values of acceleration. In the same manner, the scale factor of the third analysis in which the scale factor equals 7 and 4=0, 3+0 and 0 are multiplied by the values of acceleration. In the fourth analysis, the scale factor equals 1 and because this value is equal with final scale factor, the fourth analysis is the last one.
Basic Principles of Incremental Dynamic Analysis
A seismic accelerometer (selected through a comprehensive source on ground accelerometer) is presumably used which might undergo some configurations by seismologists and earthquake engineers such as baseline correction, passing through filters and rotation. A non-scaled accelerometer a is an axis which includes a1(t1) members so that ϵ{0,,….…..}. A type of simple scaling is multiplication of all ai values by a fixed coefficient such as λ for which we have (0,)λϵ. This act might led to higher or lower values as represented by accelerometer. In such a case, the new accelerometer will show some values each of which can be defined as = λ. The scaling can also be done in classic acceleration spectrum and frequency domain (through Fourier transfer of the accelerometer).1
Seismostruct Non-linear Analysis Software
Among all applications developed by Seismosoft, Seismostruct is one of the newest and most powerful applications of structural analysis. This software can predict and monitor the behavior of special framers under static and dynamic loads and in large displacements. It also can model geometrical non-linearization and materials with the highest possible precision. This software can be verified through multiple models and the accuracy of its results is very close to manual calculations and laboratory results, Figure 1 and 2. In the preset study, the non-linear incremental analysis of the structure and depiction of diagrams of displacement, relative displacement, hysteretic behavior and push are done through Seismostruct, version 6.5.
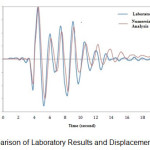 |
Fig. 1:- Comparison of Laboratory Results and |
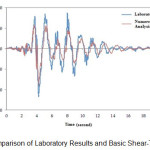 |
Fig. 2: Comparison of Laboratory Results and Basic Shear-Time Analysis |
Descriptions of Seven-storey Concrete Building with Shear Walls
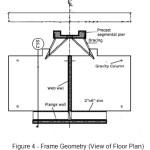
In the present study, a seven-storey concrete building with shear wall was modelled in Seismostruct Software. This building is analyzed in scenarios of a number of near-field and far-field earthquakes the results of which are summarized in figure 3 and 4. The geometrical details of the walls are summarized in table 1. Due to the fact that the building was made in laboratory and then modeled in the software with sufficient accuracy, the results of analyzing the model in the laboratory is almost identical with those of the real building. Seismostruct provided good results in comparative verification of numerical and laboratory analysis as shown in figure 1 and 2. The building was tested on a shaking table under dynamic conditions and four unidirectional motions of the ground. The building was originally designed through the method of capacity to displacement in a workshop in Los Angles.
 |
|
 |
|
Table1: Geometrical Details of Walls (in meter)
|
Storey |
Parapet |
Wall Wings |
Gravity Columns |
|
7 |
0.2032×3.6576 |
0.2032×4.8768 |
0.0333×0.1016 |
|
6 |
0.1524×3.6576 |
0.1524×4.8768 |
0.0285×0.1016 |
|
5 |
0.1524×3.6576 |
0.1524×4.8768 |
0.0285×0.1016 |
|
4 |
0.1524×3.6576 |
0.1524×4.8768 |
0.0285×0.1016 |
|
3 |
0.1524×3.6576 |
0.1524×4.8768 |
0.0285×0.1016 |
|
2 |
0.1524×3.6576 |
0.1524×4.8768 |
0.0285×0.1016 |
|
1 |
0.1524×3.6576 |
0.1524×4.8768 |
0.0285×0.1016 |
The concrete of the walls have pressure strength of 37415 Pa and tensile strength of 3742 Pa. The strain of the concrete in confined mode is 0.00326 and in non-confined mode, it is 0.00269. The steel materials used for reinforcement of the wall have elasticity modulus of 008+2.0000EkPa and failure stress of 488500 kPa with Poisson’s ratio of 0.014.The uniaxial elastic material model of symmetrical behavior in tension and compression for definition of materials used in circular hollow sections of reinforced concrete for modelling gravity columns with elasticity ratio of 008+2.0000EkPa was utilized.
Utilized Accelerometer
In the present study, the analysis of seven-storey concrete building in the cases of near-field and far-field earthquakes and behavioral comparison of the building in these two modes, three near-field and three far-field accelerometers were used. In the present study, the near field of the fault was supposed to be 60 kilometers. It is noteworthy that all accelerometers were matched to the peak acceleration of 0.35g.
Table 2: Features of Accelerometers in Present Study
|
Closeness to Fault |
Name of Earthquake |
Distance(km) |
Year |
|
Near-field |
Northridge (Sylmar Station) |
6.4 |
1994 |
|
Near-field |
Tabas (Daihok Station) |
17 |
1978 |
|
Near-field |
Kobe (Kakogawa Station) |
24.2 |
1995 |
|
Far-field |
Trinidad (CDMG090 Station) |
71.24 |
1983 |
|
Far-field |
ChiChi (TCU045) |
71.63 |
1983 |
|
Far-field |
Tabas (Ferdos Station) |
94.4 |
1978 |
Pulse Period of Near-field Accelerometer and Period of Desired Structure
The results of non-linear dynamic analysis show that the response of structures to pulse-like motions depend on T/TP
(period of structure to pulse period) and intensity of the earthquake. To calculate the pulse period, different equations were suggested of which one could point to the one by Alavior the one by Somerville both of which use the equation of pulse period of earthquake records as a function of magnitude. Rodriguez and Mark developed an equation to calculate pulse period and considered the site effects [4]. Here, Somerville’s equation is used to determine the pulse period of near-field accelerometers and the experimental equations of buildings with non-moment-resisting frames as determined in the third edition of Procedural Code 2800 was used to determine the main period of the structure. The obtained results are represented in the following and in table (3).
- Somerville’s Equation to Determine Pulse Period LOG10T= -2.5+0.425Mw (1)
- Experimental Equation of Main Period of Structure T= 0.05 H34 (2)
- Period of Studied Seven-storey Concrete Building: 0.49 Seconds.
Table3: Pulse Period of Earthquakes and Ratio of Pulse Period to Structural Period
|
Earthquake |
Pulse Period |
Ratio |
|
Northridge |
0.222 |
2.2 |
|
Tabas |
0.441 |
1.11 |
|
Kobe |
0.27 |
1.8 |
Comparison of Relative Displacement for Near-field and Far-field Earthquakes
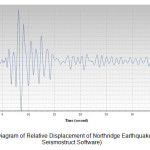
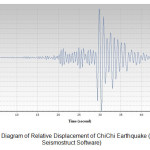
Following the incremental dynamic analysis of the structure through accelerometers mentioned by Seismostruct Software, the diagrams of relative displacement between the first and seventh floor were selected. As an instance, the two diagrams of relative displacement for near-field Northridge and far-field ChiChi earthquake are represented in figure 5 and 6. The comprehensive results of relative displacement for the structure for six studied earthquakes are compared in table 4.
 |
|
 |
|
Table4: Values of Relative Displacement of Structure for Studied Earthquakes (mm)
|
Earthquake |
Structural Displacement |
|
Northridge (Near-field) |
124.221 |
|
Tabas (Daihok Station, Near-field) |
-79.045 |
|
Kobe (Near-field) |
83.257 |
|
Trinidad (Far-field) |
23.739 |
|
ChiChi (Far-field) |
-55.522 |
|
Tabas (Ferdos Station, Far-field) |
-58.294 |
Another noteworthy point is that among the near-field earthquakes, the value of displacements increases as the ratio of structural period to pulse period rises. In figure 5, the values of magnitude, the ratio of structural period to pulse period and relative displacement of near-field earthquakes are compared. Tabas Earthquake, despite of higher magnitudes compared with Northridge and Kobe, had less relative displacement due to lower ratio of structural period to pulse period.
Table 5: Comparison of Magnitude, Ratio of Structural Period to Pulse Period and Relative Displacement of Earthquakes
|
Earthquakes |
Magnitude |
Ratio of Structural Period to Pulse Period |
Relative Displacement (mm) |
|
Northridge |
6.7 |
2.2 |
124.221 |
|
Kobe |
6.9 |
1.8 |
83.257 |
|
Tabas |
7.4 |
1.11 |
-79.045 |
Results and Discussion
As shown in figures 5 and 6 as well as table 4, the relative displacement between two nodes (pre-fabricated node of the first and seventh storey) arbitrarily selected from the structure has a significant difference between near-field and far-field earthquakes. The mean relative displacement of structural nodes for our desired three near-field earthquakes is almost double of three far-field earthquakes which shows the highly significant need for displacement of near-fault earthquakes. The comparison of relative displacement for near-field and far-field stations of an identical earthquake represents a difference of 35.6 percent (Tabas Earthquake: -79.045 and -58.249). Another noteworthy point is that among near-field earthquakes, the value of displacement increases as the ratio of structural period to pulse period rises. As shown in table 5, the values of magnitude, ratio of structural period to pulse period and relative displacement of near-field earthquakes were compared. Tabas Earthquake, despite of higher magnitudes compared with Northridge and Kobe, had less relative displacement due to lower ratio of structural period to pulse period.
References
- Azarbakht, A. Capability of seismic confidence in petrochemical steel structures, M.A. Dissertation, (International Research Center of Seismology and Earthquake Engineering, 2003).
- Niknam, A. Kazemi, M. and Niknam. A. Evaluation and comparison of seismic effects of near-fault and far-fault region with standard project spectrum of code of practice 2800 of Iran, Journal of Civil Engineering of Islamic Azad University, 2(1), 71-79 (2009).
- Tehranizade, M. and Movahed, H. The investigation of steel moment-resisting frames in tall structures in near-fault range. Journal of Civil Engineering and Mapping, 5(44), 621-633 (2011).
- Yahiai, M. and Panahande, F. Investigation of effects of period pulse on behavior of structures in near-field earthquakes, Iranian Sixth National Congress of Civil Engineering, April 26, Semnan (2011).


