Characterization of Factors Influencing Environmental Literacy in Suburban Park Users
Daniel G. Clark1 * , Amanda E. Sorensen1 and Rebecca C. Jordan2
http://dx.doi.org//10.12944/CWE.11.1.01
Copy the following to cite this article:
Clark D. G, Sorensen A. E, Jordan R. C. Characterization of Factors Influencing Environmental Literacy in Suburban Park Users. Curr World Environ 2016;11(1) DOI:http://dx.doi.org//10.12944/CWE.11.1.01
Copy the following to cite this URL:
Clark D. G, Sorensen A. E, Jordan R. C. Characterization of Factors Influencing Environmental Literacy in Suburban Park Users. Curr World Environ 2016;11(1). Available from: http://www.cwejournal.org/?p=13836
Download article (pdf)
Citation Manager
Publish History
Introduction
Environmental literacy is a concept dating at earliest to the late 1980s that developed more thoroughly as a framework in the 1990s as part of environmental education1. There are a number of competing definitions of what constitutes environmental literacy and how it is measured. These definitions proposed by major organizations include combinations of: knowledge about the environment and environmental functions (with some connection to how these impact human life), some ability to think about and analyze information as it relates the environment as well as attitudes towards the environment, and the ability and intention to act on this knowledge and transfer it to a set of behaviors and actions based on the environmental impacts of those behaviors and actions.2–5 There is some disagreement among organizations and researchers as to the relationship between these three components, and continuing research gives further insight to more concretely defining environmental literacy.
The second component of environmental literacy relates specifically to thoughts and cognitive habits that individuals have with regard to environment and health. These habits of mind impart individual identity, which informs both action and behavior. Whether or not a person engages in particular environmental behaviors can result not just from knowledge but from aspects of habit, mind, mood, and identity as well.6 An individual’s identity can also inform how one thinks and feels about issues, how they view their own role or function within their social context, and how they are connected to the environment.6 While environmental literacy in many forms has long been studied, there has been little work linking identity, personal experiences, and environmental knowledge, especially with regard to environmental related actions.Furthermore, how individuals think about a behavior or action has also been shown to strongly correlate with how the behavior or action is presented or framed.7 Thus, this work and our continuing work on the matter of environmental literacy is undertaken with the goal of explicitly linking the framing and presentation of environmental information to individual environmental literacy and knowledge.
A particular aspect of experience, and its link to environmental literacy, relates to where people live. It has been demonstrated in children that their surroundings deeply shape their observations and interactions with the world.8 These interactions and observations are part of the formation of thought and identity. Thus, living environment and place can be linked to environmental literacy and cognitive formation and development. Research on primary school students in Spain showed that those with more exposure to green space showed better memory and greater cognitive development.9 It is important then to establish whether exposure to green space and seeing green spaces may be explicitly linked to environmental literacy, especially with adults. Park land and urban canopy may be a potential proxy for daily individual exposure to green spaces – there is some evidence that enjoyable scenery and canopy cover increase overall time spent out side.10,11
New Jersey is an ideal place to study how environmental literacy develops in individuals and its relationship to location and place. While ranking forty-seventh out of fifty of states in the United States in total area, New Jersey is the eleventh largest state in population and the most densely populated.12 As defined by the US Census Bureau, New Jersey is entirely urban. However, there is a range of socio-economic conditions, racial and ethnic backgrounds, and living environments.12 Furthermore, the landscape across New Jersey is highly varied and contains myriad natural environments and ecosystems.13 The gradient in change across these diverse human and natural factors allow for the ability to detect and model the topography of environmental literacy and how it changes as a result of varying combinations across ranges of these factors.
For this research, we sought to investigate the extent to which green spaces are linked to environmental literacy. Explicitly we wanted to look into the role of parks and specific park features and amenities including canopy cover and park characteristics and their role in public levels of environmental literacy among urban and suburban park users. Our expectation was that persons living near higher quality parks would exhibit higher levels of environmental literacy, that persons utilizing parks more frequently would exhibit higher environmental literacy, and that specific characteristics of these parks would be demonstrably related to environmental literacy among park users.
Methods
Definitions: Abbreviations used in rest of this paper: EL (environmental literacy), GS (green spaces, unless otherwise noted, urban public green spaces), NJ (New Jersey), NEEF (National Environmental Education Foundation), INS (Inclusion of Nature in Self Scale), NAAEE (North American Association for Environmental Education). Furthermore, the terms “town”, “township” and “municipality” will be used interchangeably to refer to sub-county incorporated government entities despite the fact that some of these may have municipal governments that do not specifically identify as townships as their form of government. New Jersey can be characterized has having strong home-rule laws with most local enforcement and day-to-day governance taking place at the municipal level.14
The questionnaires and methodology for distribution for this research have been based on previously published research.6,7 As defined in these publications, sampling was conducted across six municipalities in central New Jersey. It was conducted as a stratified random sample with all residents coming from within 0.8km of a public green space. The questionnaire used had a variety of items including park use, demographic items such as age and racial/ethnic background, and items on mood and trust in institutions. For this study, we used the same questionnaire but focused our research on the section on environmental literacy with items from NEEF/Roper.15 These items have been thoroughly vetted for twenty years and give an accurate reflection on a respondent’s level of environmental literacy.3 The questions range in knowledge area, novelty and level of challenge. They are designed to assess the first component of EL by reflecting individual levels of knowledge of the environment (e.g. speciation, biodiversity) as well as environmental and environmental health related issues (e.g. toxic waste, greenhouse gas emissions).
Because of our interest in environmental education, environmental literacy and outdoor experiences, the items we used focused on these themes as well as personality and trust. Demographic information was used as well, as these characteristics are important factors in individuals’ levels of environmental literacy.16
In order to vet our questionnaire, preliminary testing was done on ten individuals ranging in age from twenty to seventy who lived in central New Jersey. Jordan interviewed this group following their completion of the questionnaire to address concerns they had about structure and formatting and to address issues arising from wording and layout. Following this, the questionnaire was modified to reflect changes that would more accurately capture responses that our team was looking for in a meaningful way. Pilot respondents were involved directly in these modifications.
The questionnaires were further piloted using 100 questionnaires randomly mailed to addresses within the study area. Twenty one were returned and based on responses further modification were made. The same pilot respondents were involved in this portion of the process as well and read the final questionnaires for clarity. Finally, the final version was mailed out to 380 addresses in the study region. We received 74 responses for response rate of approximately twenty percent. Some respondents did not fill out the entire questionnaire, giving slightly different response rates based on the items studied.
In order to ensure that our metric of environmental literacy was stable, we used multiple cognitive and attitudinal measures in our survey as previously published in Jordan (2015)6 and Sorensen (2015)7but conducted our own analysis, presented in Table 1. We analyzed these data together to ensure that responses were highly correlated; meaning that individuals were responding similarly to multiple measures. Following this analysis, we investigated environmental literacy and park use.
As a test of our questionnaire, confirmatory analysis was performed and is presented as previously published in Jordan (2015)6 and Sorensen (2015)7 and is presented in Table 1. People who reported being closer to nature did significantly correlate with having higher EL. Given that other studies have reported the same, and the other significant correlations, we moved on to analyze the park use and quality data. Additionally, educational attainment is correlated with both income and EL, but income and EL are not directly correlated with each other. Table 1 gives all comparisons of environmental attitude and literacy variables. These results are summarized here to give necessary background to this paper.
Table 1
|
Results |
Variables |
N |
Test Statistic |
P-value |
|
People who were closer to nature had higher EL |
Inclusion of nature in self and EL |
68 |
R2= 12.6984 |
0.0481 |
|
People who ID-ed as environmentalists had higher EL |
Self ID as environmentalist and EL |
68 |
R2= 3.3768 |
0.0236 |
|
The level at which people identify as an environmentalist and describe their closeness to nature are highly correlated |
Inclusion of nature in self and identify as environmentalist |
66 |
R2= 0.56074 |
<0.001 |
|
Self-rating of environmental knowledge correlated with EL |
EL and self reportedEnv knowledge |
68 |
R2= 0.30505 |
0.0114 |
|
EL and Educational Attainment are correlated |
EL and Education |
68 |
R2=0.28039(Pearson) |
0.0206 |
|
Educational Attainment and Income are correlated |
Ed and income |
66 |
R2=0.40292(P) |
0.0008 |
|
EL and Income are not correlated |
EL and income |
66 |
R2=0.13162(P) |
0.2921 |
In order to study canopy cover we used data from the New Jersey Department of Environmental Protection.17 These data were overlaid with the parks and townships within the study area, which allowed us to determine the amount of urban canopy cover and distribution of land cover types in the parks and municipalities within the study area. Presence or absence of canopy cover was the only land cover or land use type analyzed for this study.
To understand park use, we wanted an assessment of park quality. Because park quality is highly subjective, we decided to use a number of metrics. We define park quality as the number of amenities present, the preference of respondents for this park and access to the park. The preference of respondents for a park is based on pictures of these parks. The respondents ranked six pictures and so the number of amenities is multiplied by the percent of respondents in a town picking the park first minus the percentage putting it last.
Added to this is an access rating based on whether the park is mostly fenced (or has other impediments to access like heavy forests) and if it has or is adjacent to a parking lot. These two factors were rated as present, somewhat present, or absent. We recognize that actual and potential accessibility can differ,18 and attempted to build our rubric in ways that captured actual accessibility. The access score could be scored from 0-2 at one half intervals. A zero would indicate a wholly fenced or impeded park with no nearby parking whereas a 2 would indicated a park with minimal impediments to access and a dedicated parking lot. Half point scores would be for some impediments to access – fencing halfway around a park for example – or non-dedicated parking lots. However, there was no reliable way of testing this, as the sub-groups within the dataset based on adjacency to individual parks were small. The overall quality score can thus be expressed as:
Park Quality= [#Amenities*(%scoring first-%scoring last)] + [access score 0-2]To analyze the responses, assorted appropriate statistical analyses were performed using SAS version 9.4. Correlation analysis was used as the primary exploratory analysis for variables of interest. This type of analysis measures the linear relationship between two variables. Correlation analysis is most appropriate for variables, which are continuous or can be treated as continuous – such as our interval variables.
For other variables, no correlation analysis was appropriate, as they were categorical in nature. Categorical variables were analyzed using a chi-squared goodness-of-fit test. This type of test is a means of comparing whether the different categories of two variables are related in a significant way. This type of test assumes a frequency of five for each, or at least a majority of cells. For cases where this was not a valid assumption we used a test called Fisher’s exact test, which does not make this assumption.
Results presented are presented without a correction (e.g. Šidák, Bonferroni, Boole, Tukey, Holm). These type of correction can be over-conservative and quickly results in a high rate of Type II errors and can create more issues in data interpretation than they solve.19 Adjustments of this type rely on the idea of a family of hypotheses that is poorly defined and does not necessarily make sense in every context – for example, many of our tests use completely different sets of variables. Additionally, these adjustments are only useful for determining the likelihood that any one of the hypotheses are misclassified as significant (Type I error).19 A finding that a singular hypothesis among are has been misclassified would not invalidate the validity or significance of the rest of the findings and thus in this case corrections of this sort are not appropriate.
Results
Environmental literacy is correlated with access to high quality parks, as determined by our metric, but is not correlated with actual park use or perception of quality (Table 2). Additionally, persons living near parks with higher canopy cover exhibited higher levels of EL. Canopy cover was also correlated with educational attainment. Canopy cover was not included in the park quality index, as mentioned in the methods section. EL was not found to be significantly correlated with visiting local parks. Environmentalists also did not report a higher frequency of park visits than respondents not identifying as environmentalists did. In terms of infrastructure, parks with lower access ratings had fewer amenities.
Table 2
|
Results |
Variables |
N |
Test Statistic |
P-value |
|
People with access to higher quality parks exhibit higher environmental literacy |
Park Quality and EL |
68 |
Chi2=34 |
0.0475 |
|
People living near parks with higher canopy cover have higher environmental literacy |
Canopy Cover and EL |
68 |
R2= 0.25774 |
0.0338 |
|
People living in areas with higher Canopy cover tended to have higher educational attainment |
Canopy Cover and Education |
68 |
Z =11.1247 |
0.049 |
|
Parks with lower access had fewer amenities |
Access and amenities |
12 |
R2= 0.2455 |
0.03 |
|
EL is not related to visiting local parks |
Environmental Literacy and Visits to area parks |
68 |
not sig. |
not sig. |
|
Environmentalists do not visit parks more than non-environmentalists |
Self ID as environmentalist and visits to area parks |
68 |
not sig. |
not sig. |
|
Time spent in park not correlated with rating of park quality |
Park visits, perceived park quality |
68 |
not sig. |
not sig. |
These results enabled us to generate a framework under which to better present the current understanding of EL as well as our proposed future research path to studying factors influencing EL. This includes variables such as life stage and overall land use/landscape cover not analyzed as a part of this study that we plan on incorporating into future studies. The resulting framework is presented below in Figure 1.
|
|
|
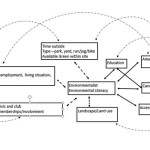
In solid are the known associations resulting from this study. The barred lines represent hypothesized relations we suggest to be present as mechanisms, represented as curved lines. These mechanisms are highlighted in the discussion.
Discussion
One of the most surprising outcomes of our research was that there was no relationship found between respondents’ ratings of their local parks and how much time they spend in them. Generally it is expected that people want to do more of things when they like them better.20 This is tempered by other conditions in terms of what an individual “likes” or thinks is “better” such as affordability and overall net cost or net benefit. However, there is an expectation that people who think that they live near higher quality parks would spend more time in them and those thinking their parks were of low quality would spend less time in them.
We looked further into this by analyzing park visitation and their current ratings of park quality as well as their ratings of whether parks had decreased/increased in quality in the past five years. No significant relationship was found between either of these variables and park visitation. This rating of the park as a place can be an important indicator of quality. Research in Sweden has linked perception of certain public green space features highly with perceptions of the quality of these green spaces.21 While we have detected no such pattern currently, a larger dataset would help to reveal the existence of one.
Currently we are looking into explanatory factors of park utilization. Perhaps people who visit parks frequently and regard them as low quality have some commonality in age or mood for instance. As shown in Figure 1, we expect there to be a relationship between some function of life stage and time spent in parks. Factors of life stage would include point in career, home ownership, having children or pets for example. Any of these would potentially shape not only how much people utilize parks and public green spaces, but also shape the activities they take part in while outside.
Our research did not find any links between time spent in local parks and level of environmental literacy. We recognize that time spent in parks does not necessarily correspond to time spent outside; however we expected a relationship between these two variables. This would support the idea that exposure to green spaces in and of itself increases levels of EL. Despite there being a difference between time spent in nearby parks and time spent outside, we do believe that measuring time explicitly spent in public green spaces is important to measure.
Civic officials and land stewards have no control over household yards or where individuals live, however they can affect existing outdoor public spaces and expenditures on such spaces in ways that may increase overall community EL and provide opportunities for local schools, clubs and civic organizations. Membership in different civic groups is frequently related to some of the life stage factors mentioned above, as organizations revolve around some commonality or interest. Therefore there is likely come level of co-occurrence or co-variance among these factors.
The quality algorithm we developed was shown to be directly correlated to EL. This could indicate a direct or possibly even a causal relationship. With more responses and further study of park amenities and access we will be able to see which factor(s) among these in a landscape are important in environmental literacy. Other researchers have attempted to capture park quality in a variety of ways including information on access and amenities or features and have found that having a diversity of uses that serve different populations overall increases park use.22 To better understand the role that these built features play, we will study more deeply which particular amenities attract subsets of respondents to the park and if these subsets can be characterized in some meaningful way. Tying park and outdoor amenities directly into behavior will give us a window into exactly what and why users go outside for, which, in turn, may be dependent on some common life stage or lifestyle characteristic(s).
Percentage of canopy cover in parks is also directly related to respondents’ levels of EL. Canopy cover may directly relate to park quality though we did not include it in our rubric. The relationship between canopy cover and EL would support our hypothesis that EL can be enhanced by exposure to green spaces. While overall landscape cover/land use was not studied here, we believe that in the future it will be important to integrate knowledge of canopy cover of recreational spaces with that of the surrounding landscape. This will allow for insight into the role played by a particular park in a given neighborhood. Here, as in other studies, it is likely that canopy cover is likely related to and perhaps acts in conjunction with other factors such as income and socio-economic status (see Table 1) and that it is likely not directly driving EL. Previous studies have shown that urban canopy cover is significantly correlated to the percentage of population with a bachelor’s degree.23 This is after adjusting for other landscape and population factors.
Work by Heynen and Lindsey24 suggested that education and income are not directly correlated and that income is not directly related to urban canopy cover. Other studies have demonstrated an increase in property values related to urban canopy cover – and not necessarily directly over a lot.24,25 However, in this case we hypothesize that there may be a feedback loop in which persons with higher EL preferentially move into treed areas and take actions to maintain the urban canopy.
Park availability is something that can be explicitly linked to questions of policy and funding of outdoor spaces and environmental education programming. Public green spaces can provide readily available and low cost places to engage in inquiry-based learning about the environment which has been shown to be effective in developing environmental literacy in children.26 Having access to public green spaces can explicitly play a role in enhances education about the environment. Thus, if increasing public levels of environmental literacy is a goal, understanding the role of public green spaces and the availability of and access to these green spaces in environmental literacy is an important part of achieving this goal. These budgets have frequently been cut in recent years which can lead directly to degradation of public green spaces.27
These data have lead us to question how landscape/land use and place shape environmental literacy in adults and which specific factors in regards to public infrastructure (such as parks and their amenities) and land cover (type, amount, and location) enhance environmental literacy. It further lead us to question how to better link questions of education and environmental literacy to the thoughts and actions of the public and how they link to support for environmental policies. By understanding these attributes better we aim to understand how to effectively plan in a way that creates sustainable communities with environmental literate populations.
Public support of and engagement with environmental policy has played an important role in the research on and protection of ecosystems.28 Positive outdoor experiences and educational opportunities from a young age are key in shaping how individuals view environmental issues.29 This paper addresses environmental engagement by the public through investigating use of green spaces across central New Jersey. Our current work will expand this understanding by investigating linkages to lifestyle, as well as utilization and characterization of behavior in outdoor spaces by suburban and urban residents and connection between these and environmental literacy and landscape. Ultimately, this research allows for the creation of planning tools and further guidance in policy decisions on public green spaces and enhancement of public environmental literacy.
Acknowledgements
All work was carried out and conducted with the approval of the Rutgers University Institutional Review Board reference #13-390 and in accordance with its Human Subjects Training. The authors would like to acknowledge the help of Daniel Betz and David Howe. Some funding provided by HATCH Multi-State NC1962
References
-
Marcinkowski, T., Potter, G. & Day, B. National Environmental Literacy Assessment Project: Year 1, National Baseline Study of Middle Grades Students Final Research Report. (2008).
-
Hollweg, K. S. et al.Developing a framework for assessing environmental literacy. (North American Association for Environmental Education, 2011).
-
Coyle, K. Environmental Literacy in America: What ten yeats of NEETP/Roper research and related studies say about environmental literacy in the U.S. (The National Environmental Education & Training Foundation, 2005).
-
National Environmental Education Foundation. Environmental Literacy in the United States: An Agenda for Leadership in the 21st Century. (National Environmental Education Foundation, 2015).
-
Scholz, R. W. & Binder, C. R. Environmental literacy in science and society: from knowledge to decisions. (Cambridge University Press, 2011).
CrossRef -
Jordan, R., Sorensen, A. & Clark, D. Urban/Suburban Park Use: Links to Personal Identity? Curr. World Environ.10, 355–366 (2015).
CrossRef -
Sorensen, A. E., Clark, D. & Jordan, R. C. Effects of alternative framing on the publics perceived importance of environmental conservation. Front. Environ. Sci.3, (2015).
CrossRef -
C. Eberbach & Crowley, K. From everyday to scientific observation: how children learn to observe the biologist’s world. Rev. Educ. Res.79, 39–68 (2009).
CrossRef -
Dadvand, P. et al. Green spaces and cognitive development in primary schoolchildren. Proc. Natl. Acad. Sci.112, 7937–7942 (2015).
CrossRef -
Brownson, R. C., Baker, E. A., Housemann, R. A., Brennan, L. K. & Bacak, S. J. Environmental and policy determinants of physical activity in the United States. Am. J. Public Health91, 1995–2003 (2001).
CrossRef -
Coley, R. L., Sullivan, W. C. & Kuo, F. E. Where Does Community Grow?: The Social Context Created by Nature in Urban Public Housing. Environ. Behav.29, 468–494 (1997).
CrossRef -
U.S. Census Bureau. United States Census 2010. (U.S. Census Bureau).
-
Costanza, R. et al. The value of New Jersey’s ecosystem services and natural capital. Gund Inst. Ecol. Econ. Univ. Vt. N. J. Dep. Environ. Prot. Trenton N. J.13, (2006).
-
Coester, A. Home Rule State or Dillons Rule State. (2004).
-
McBeth, W. C., Marcinkowski, T., Giannoulis, C., Hungerford, H. & Volk, T. Secondary Analyses of the National Environmental Literacy Assessment: Phase One & Phase Two Student, Teacher, Program, and School Surveys Final Research Report. (North American Association for Environmental Education, 2014).
-
McBeth, W. C., Hungerford, H., Marcinkowski, T., Volk, T. & Cifranick, K. National Environmental Literacy Assessment, Phase Two: Measuring the Effectiveness of North American Environmental Education Programs with Respect to the Parameters of Environmental Literacy Final Research Report. (North American Association for Environmental Education, 2011).
-
New Jersey Department of Environmental Protection (NJDEP), Office of Information Resources Management (OIRM), Bureau of Geographic Information Systems (BGIS). Land Use/Land Cover 2012 Update, Edition 20150217 Subbasin 02040302 - Great Egg Harbor, Subbasin 02040303 - Chincoteague (Land_lu_2012_hu02040302_303). (2015).
-
Dai, D. Racial/ethnic and socioeconomic disparities in urban green space accessibility: Where to intervene? Landsc. Urban Plan.102, 234–244 (2011).
-
Perneger, T. V. What’s wrong with Bonferroni adjustments. BMJ316, 1236–1238 (1998).
-
McEachern, W. A. Microeconomics a Contemporary Introduction. (Thomson Higher Education, 2006).
-
Bjork, J. et al. Recreational values of the natural environment in relation to neighbourhood satisfaction, physical activity, obesity and wellbeing. J. Epidemiol. Community Health62, e2–e2 (2008).
-
Bedimo-Rung, A. L., Mowen, A. J. & Cohen, D. A. The significance of parks to physical activity and public health: a conceptual model. Am. J. Prev. Med.28, 159–168 (2005).
-
Adler, I., Zion, M. & Mevarech, Z. R. The effect of explicit environmentally oriented metacognitive guidance and peer collaboration on students’ expressions of environmental literacy: THE META-CIC MODEL AND ENVIRONMENTAL LITERACY. J. Res. Sci. Teach. n/a–n/a (2015). doi:10.1002/tea.21272
-
Heynen, N. C. & Lindsey, G. Correlates of Urban Forest Canopy Cover: Implications for Local Public Works. Public Works Manag. Policy8, 33–47 (2003).
CrossRef -
Sander, H., Polasky, S. & Haight, R. G. The value of urban tree cover: A hedonic property price model in Ramsey and Dakota Counties, Minnesota, USA. Ecol. Econ.69, 1646–1656 (2010).
CrossRef -
Netusil, N. R., Chattopadhyay, S. & Kovacs, K. F. Estimating the demand for tree canopy: a second-stage hedonic price analysis in Portland, Oregon. Land Econ.86, 281–293 (2010).
-
Chiesura, A. The role of urban parks for the sustainable city. Landsc. Urban Plan.68, 129–138 (2004).
CrossRef -
Satterfield, T. In Search of Value Literacy: Suggestions for the Elicitation of Environmental Values. Environ. Values10, 331–359 (2001).
CrossRef -
Tidball, K. G. & Krasny, M. E. Urban environmental education from a social-ecological perspective: Conceptual framework for civic ecology education. Cities Environ. CATE3, 11 (2011).


