Effect of Changing Climatic Conditions on Chill Units Accumulation and Productivity of Apple in Mid Hill Sub Humid Zone of Western Himalayas, India
Hukam Chand 1 * , S. C. Verma 2 , S. K. Bhardwaj 1 , S. D. Sharma 3 and P. K. Mahajan 4
http://dx.doi.org/10.12944/CWE.11.1.18
The present study was carried out during 2014-15 in the Kullu district of Himachal Pradesh, which is situated between 31º52’00” to 31º58’00” North latitude and 76º13’00” to 77º44’00” East longitudes.The cumulative chill units hours available for apple crop were calculated by using UTAH model for the period of 1986 to 2015 and a decrease of 6.38 chill units(CU) hours per year was recorded at Kullu Valley of Himachal Pradesh. Chill units for the last three decades i.e. 1986-1995, 1996-2005 and 2006-2015 also revealed a decreasing trend of the order of 63.79 CU decreased per decade.Monthly accumulation of chill unit hours during the same period for each winter month (November, December, January and February) revealed maximum decrease of 2.186 CU per year was observed for the month of February. Trend analysis of last five years 2011-2015 showed there was a huge decrease of 14.98 chill units per year. Data on apple productivity in Kullu district for last decade (2005-2014) showed a decreasing trend of the order of 0.183 tons/ha /year as per the regression equation y = -0.183x + 5.745. Thus the climatic conditions for apple cultivation in the Kullu district will be becoming unfavorable in the coming years.
Copy the following to cite this article:
Chand H, Verma S. C, Bhardwaj S. K, Sharma S. D, Mahajan P. K, Sharma R. Effect of Changing Climatic Conditions on Chill Units Accumulation and Productivity of Apple in Mid Hill Sub Humid Zone of Western Himalayas, India. Curr World Environ 2016;11(1) DOI:http://dx.doi.org/10.12944/CWE.11.1.18
Copy the following to cite this URL:
Chand H, Verma S. C, Bhardwaj S. K, Sharma S. D, Mahajan P. K, Sharma R. Effect of Changing Climatic Conditions on Chill Units Accumulation and Productivity of Apple in Mid Hill Sub Humid Zone of Western Himalayas, India. Curr World Environ 2016;11(1). Available from: http://www.cwejournal.org?p=880/
Download article (pdf)
Citation Manager
Publish History
Introduction
Apple is one of the most important temperate fruit crops in India which accounts for about 10 % of the total fruit production of the country. It accounts for 46 %of total area under fruit crops and 76 %of the total fruits production. The area under apple in Himachal Pradesh has increased from 3025 hectares in 1960-61 to 107686 hectares on 2013-141. However, decrease in productivity of apple crop in the recent years due to change in climatic conditions have become a serious concern of the growers in Himachal Pradesh. Apple trees develop their vegetative and fruiting buds in the summer and as winter approaches the developed buds undergo dormancy due to shorter day lengths as well as cooler temperatures. The apple buds remain dormant until they have accumulated sufficient chilling units (CU) during the winter season. When required chilling units accumulate, the buds grow in response to warm temperatures. Different combinations of the temperatures during the dormant phase and the duration of the chilling period fulfill the plant’s chilling requirements2. But due to lack of sufficient chilling temperatures during winter apple plantdevelops physiological anomalies viz. delayed foliation, reduced fruit set, increased buttoning and reduced fruit quality. Which affect the yield and quality of apple fruit crop. Among all the productivity reducing factors, climate is one of the most important factor and difficult to manage3. Climate change has important implications on fruit crop production and apple is no exception. According to IPCC (2007)4, air temperature near the earth surface rose by 0.740 C from 1906 to 2005 and it could be increased as much as 6.40 C on average during the 21st century.If climatic factors such as temperature and precipitation change in a region beyond the tolerance of a species then distribution changes of the species may be inevitable5. According to Parmesan and Yohe (2003)6 plant species are shifting their ranges in altitude and latitude as a response to changing regional climate. In the present study Kullu district of Himachal Pradesh has been selected as a typical high mountain environment characterized by vertical zonation of eco-climatic zones. The altitude of the district ranges from 500-5000 m above the mean sea level, but the habitation is only up to 3500 m. The total geographical area of the district is 5503 km2 and more than 80 % of the people are engaged in agricultural and horticultural activities. The objective of this study is to examine change in climatic parameters especially chilling units and associated changes in apple productivity in Kullu district of Himachal Pradesh.
Materials And Methods
Study Area
The present study was undertaken during 2014-15 in the Kullu district of Himachal Pradesh which comprises the major apple belt in the state and is famous for apple cultivation. The Kullu district is situated between 31º52’00” to 31º58’00” North latitude and 76º13’00” to 77º44’00” East longitudes.
Agro-Climatic Conditions
The district is characterized with cold dry weather. The maximum temperature varies from 15.8°C in January to 32.8°C in June, whereas the minimum temperature ranges from 21.1° C in July to as low as 0.7° C in December. The upper regions experience snow and sleet fall while rains are confined to lower heights. Kullu district comprises of two agro-climatic zones i.e., mid hill sub humid zone (615-1800 m amsl, Zone II) and high hill wet temperate zone (above 1800 m amsl, Zone III).
Data collection
The data on daily maximum and minimum temperature were collected for the period of 1985 to 2015 from the regional office of India Meteorological Department, Shimla, for Bhunter meteorological station situated at Kullu district of Himachal. The temperature data for four winter months (November-February) was used to calculate chill units. Apple area and production data from 1990 to 2014 was collected from the Directorate of Horticulture, Govt. of Himachal Pradesh, Shimla.
Chill unit calculation model
The effective chill units for apple crop were worked out using UTAH model7. It quantifies winter chill as the number of hours during the winter season, when temperatures are between 0 and 7.2 0C 8,9.
Utah model full range
1 hour below 32 degrees F = 0.0 chill unit
1 hour 32-36 degrees F = 0.5 chill units
1 hour 37-48 degrees F = 1.0 chill units
1 hour 49-54 degrees F = 0.5 chill units
1 hour 55-60 degrees F = 0.0 chill units
1 hour 61-65 degrees F = -0.5 chill units
1 hour >68 degrees F = -1.0 chill units
Statistical Analysis
Linear regression analysis was done to predict the chill units trends for the study area.
Results and Discussion
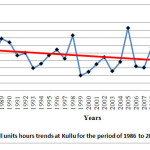
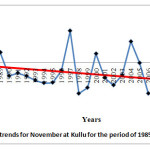
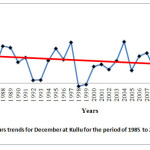
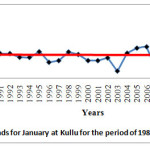
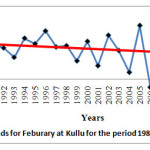
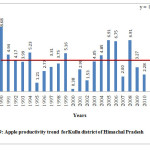
The requirement of chilling hours for apple standard variety is 800-11007and daily temperature of 70°F and higher for 4 or more hours received by the plant during the previous 24 to 36 hours can actually negate chilling in apple. Perusal of data (Fig. 1) on accumulation of cumulative chill units showed a decreasing trend of the order of 6.385 chill units (CU) decreased per year as per the regression equation (y = -6.385x + 555.7). Similar to the present investigations but with another location (Bajaura) in the same valley Aditya et al.,(2013)10 observed a decreasing trend in the chill unit accumulation of the order 8.201 chill unit decrease per year during 1985-2009. Monthly accumulation of chill unit hours was also calculated during the same period for four winter months, i.e. November – February, showed decreasing trends (Fig. 2-5). The maximum decrease of 2.186 CU per year was observed for the month of February followed by December (1.890 CU/year), November (-1.611 CU/year) and January (0.038 CU/year).
 |
|
 |
|
 |
|
 |
|
 |
|
 |
|
 |
|
 |
|
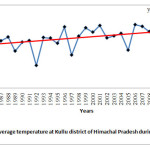
The decrease in chill units may be due to the overall increasing trend (0.027oC per year) of average temperature over the period 1985-2014 (Fig. 11) which resulted a decrease in chill units in the study area. The present investigations are in confirmation with the finding of Rana et al., (2009)11 who reported that there was maximum decrease in chill unit accumulation for February month during the period 1986-2005 in the Kullu valley of Himachal Pradesh.
 |
|
 |
|
 |
|
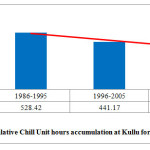
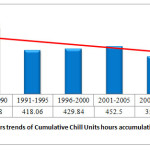
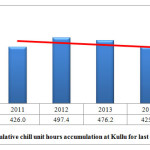
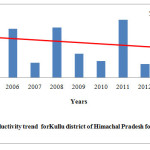
The study also revealed that the chill unit for the last three decades i.e. 1986-1995, 1996-2005 and 2006-2015 showed a decreasing trend in the order of 63.79 CU decreased per decades as per the regression equation y = -63.79x + 584.4 (Fig. 6). Data depicted in the Figure 7 revealed a decreasing trend of 32.44 chill units decreased with every five year as per the regression equation y = -32.44x + 570.3. The data on trend analysis of last five years (2011-2015) (Fig.8)showed a decreasing trend in the chill unit accumulation as per regression equation y = -14.98x + 487.3). The trend revealed that there was a decrease (14.98 CU/year) of chill units which indicated increase in both maximum and minimum temperature at faster rates during the recent years and is a serious threat as far as apple production is concerned. Data depicted in Figure 9 revealed a constant trend for the apple productivity in Kullu district during last twenty five years (1990-2014) as per the regression equation y = -0.000x + 4.176. The highest productivity (8.68 tons/ha) was recorded during the year 1990 with the average annual maximum temperature (25.10C) and minimum temperature (10.6 0C) whereas it was lowest (0.38 tons/ha) during the year 2000 during which maximum and minimum temperatures were 26.3 0C and 10.5 0C, respectively. This indicated that the temperature during the year 1990 might be the best for apple production and can be used as an index temperature range in the region. However the productivity of apple crop in the Kullu district during the last decade (2005-2014) showed a decreasing trend of the order of 0.183 tons/ha /year as per the regression equation y = -0.183x + 5.745 (Fig. 10). This indicates that the climatic conditions particularly temperature approaching towards unfavorable for the apple production in the Kullu valley of Himachal Pradesh in the recent years. The present findings were in accordance with the findings of Sen et al. (2015)12 who reported that there was a decreasing trend in the apple productivity of the order of (0.016 tons/ha/year) during the period 1985-2009 in the Kullu valley.
Conclusion
Thus the climatic conditions for apple cultivation in Kullu valley would be unfavorable in coming years due to reduced chill units in the mid-hill sub-humid zone of valley as a result of increase in surface air temperature. This may leads to shift in apple belt to higher altitude where appropriate chill units could meet for apple cultivation in the region.
Acknowledgements
The first author is highly thankful to Department of Science & Technology, New Delhi, Govt. of India for the financial assistance (INSPIRE Fellowship) during the study.
References
- Development of horticulture - facts and figures. Department of Horticulture, Govt. of Himachal Pradesh, Shimla: pp. 7-20 (2014).
- Jacobs, J.N., Jacobs G. and Cook, N.C. Chilling period influences the progression of bud dormancy more than does chilling temperature in apple and pear shoots. Journal of Horticultural Science, 77: 333-339 (2002).
CrossRef - Arora, V.P.S., Bargali, S.S. and Rawat, J.S. Climate change: challenges, impacts and role of biotechnology in mitigation and adaptation. Progressive Agriculture, 11: 8-15 (2011).
- Intergovernmental Panel on Climate Change Special Report on Emissions Scenarios retrieved 26 June (2007).
- Lynch, M. and Lande, R. Evolution and extinction in response to environmental change. In: Biotic Interactions and Global Change (Kareiva, PM and Kingsolver J eds.). Sinauer Associates Inc., Sunderland, MA, USA : 234-250 (1993).
- Parmesan, C. and Yohe, G. A globally coherent fingerprint of climate change impacts across natural systems. Nature, 421: 37-42 (2003).
CrossRef - Byrne, D.H. and Bacon, T.A. Chilling estimation: its importance and estimation. The Texas Horticulturist,18 (8): 8-9 (1992).
- Bennett, J.P. Temperature and bud rest period. Effect of temperature and exposure on the rest period of deciduous plant leaf buds investigated. Californian Agriculture, 4: 11-16 (1950).
- Weinberger, J.H. Chilling requirement of peach varieties. Proceedings of American Society of Horticultural Science, 56: 122-128 (1950).
- Aditya, Rana, R.S., Chauhan, R.C. and Sen,Vijayshri. Farmers’ Perception in relation to Climate Variability in Apple Growing Regions of Kullu District of Himachal Pradesh. Journal of Agricultural Physics,13 (1):48-54 (2013).
- Rana, R.S., Bhagat, R.M.,Kalia, Vaibhav and Harbans Lal. Impact of climate change on shift of apple belt in Himachal Pradesh. In: ISPRS Archives XXXVIII-8/W3 Workshop Proceedings: Impact of Climate Change on Agriculture, 131-137 (2009).
- Sen, Vijayashri, Rana, R.S., Chauhan, R.C. and Aditya. Impact of climate variability on apple production and diversity in Kullu valley, Himachal Pradesh. Indian Journal of Horticulture, 72 (1): 14-20 (2015).
CrossRef


