The Integrate of HEC-HMS and HEC-RAS Models in GIS Integration Models to Simulate Flood (Case Study: the Area of Karaj)
Amir Abbas Mosaddegh Khaghan 1 * and Barat Mojaradi 2
1
Sharif University of Technology,
Tehran
Iran
2
Elm-o-Sanat University,
Iran
http://dx.doi.org/10.12944/CWE.11.Special-Issue1.01
Residential and urban development in the context of flood plain rivers and hydrological and hydraulic conditions regardless of the watershed and river, an increasment risk of flooding and loss of the other side can make investment in these areas. The purpose of this study is to evaluate the behavior of river flooding and the spread of Karaj in Alborz province. combining hydrological model HEC-HMS and HEC-RAS hydraulic model was used for this purpose, meteorological and hydrometric stations using rainfall data and runoff area HEC-HMS model was calibrated and river cross sections taken at intervals residential areas, flood zones showed with return periods of 10, 20 and 50 years in GIS using HEC-GeoRAS amendments in Arc view is displayed.
Copy the following to cite this article:
Khaghan A. A. M, Mojaradi B. The Integrate of HEC-HMS and HEC-RAS Models in GIS Integration Models to Simulate Flood (Case Study: the Area of Karaj). Special Issue of Curr World Environ 2016;11(Special Issue 2(2016). DOI:http://dx.doi.org/10.12944/CWE.11.Special-Issue1.01
Copy the following to cite this URL:
Khaghan A. A. M, Mojaradi B. The Integrate of HEC-HMS and HEC-RAS Models in GIS Integration Models to Simulate Flood (Case Study: the Area of Karaj). Special Issue of Curr World Environ 2016;11(Special Issue 2(2016). Available from: http://cwejournal.org?p=922/
Download article (pdf)
Citation Manager
Publish History
Introduction
Flood is one of the major natural disasters that damage from disasters such as drought and famine is more human than the others (Green et al.,2008). Various studies indicate that lack of attention to privacy issues and rivers, causing an exponential growth in the frequency of flooding and the damage is among urban and semi urban and greatest potential flood risk model. Because complete protection from the risk of flooding is not possible (more et al.,2008), living in the flood of new policies regarding land use management and development of river areas in order to reduce its harmful effects is essential. Analysis of runoff in the river and it is useful to consider how to expand. The use of geographic information systems (GIS) to display and analyze spatial data in a number of studies that deal with spatial data in a way that is accepted in flood management and flood retention tool is efficient determination of levels.
Studies on the simulation of flood and hydrological models used to study the flow of runoff at the outlet area to be explored so that Radwan for regional flood analysis Petra model in Jordan, the role of flood control measures on the discharge of flood be studied. De Hoo et al (2007) also utilizes the LISFLOOD model the role of land use changes on flood peak in two areas studied. Benavides et al (2006) with HEC-HMS and HEC-RAS model integrated with GIS to analyze the various options for flood control and was the preferred option. Also Knebl et al (2005) with the integration of these models in the San Antonio area for flood proposed model and model in predicting floods were noted.
Further studies in the country to determine the areas of flooding using hydrological models and flood mapping using hydraulic models have studies Fallah (2010) in Mohammad Abad province, Khosroshahi (2011) in the watershed Damavand, Jowkar (2012) Shapur River HEC-HMS model of research which confirms the efficiency of the model. In addition, Sadeghi and colleagues (2013) from HEC-RAS model and GIS integration zoning river flood Darabad used the results indicate efficiency in the model in flood zoning. Haji Gholizadeh (2012) in a research to investigate the role of human intervention, including bridges, culverts, water Crushers, Crushers dip in the river shall pay Tehran using HEC-RAS model. The results of different studies on the impact of each of the structural measures for flood control on the depth different return periods in the study area.
According to studies, the combination of hydrological and hydraulic models to simulate flooding in residential areas in the country was low, and using these models to manage downstream land use is not considered. In this study, using a combination of hydrological and hydraulic models and HEC-RAS HEC-HM and GIS to process simulation and analysis of rainfall and runoff in river flood in Karaj.
Materials and Methods
The study area with 75.87 square kilometer in the city of Karaj, 10 km West of the province in Alborz is stated. Average slope area of 42.44% and the climatic conditions of semi-arid climate and annual rainfall of 381 mm was wet is the value (Mirzakhan, 2008).
In this study, in order to simulate rainfall, runoff and flood hydrograph output to determine the scope of HEC-HMS model version 2.2.2 was used according to the method of choice in this model was to identify the model inputs. The conversion of precipitation to runoff curve number method was used for this purpose or map of the area of ​​combination of vegetation, soil hydrological groups and land use in GIS software Arc View 3.3 were prepared. Calibration and validation of precipitation and runoff events using a single global rainfall and runoff events in the region and selected stations was carried out to investigate the spatial distribution of rainfall in GIS was used IDW method to determine the temporal pattern of each sub-catchment precipitation of the pattern is the nearest stations were used. After calibration and validation of model and parameters extraction, precipitation of Dvrhbazgshthay 10, 20 and 50 years of curves, intensity, duration, frequency extraction station Karaj and was the model for the flood hydrograph was calculated. The roughness coefficient of Cowan (Cowan, 2006) due to multiple factors and roughness control (Haji gholizadeh, 2009, Sadeghi and Jalali Rad, 2008) were determined. Then in GIS extension HEC-Geo RAS geometry of the range was used for the preparation and data entry that includes Msyrjryan, left and right side, cross sections in the form of new data layers Arc View to the HEC-RAS model were entered then enters the output Hydrograph-Hay HEC-HMS model and the introduction of roughness coefficients, convergence and divergence channel HEC-RAS model has been implemented and hydraulic analysis and monitoring of flood zones and flood depth was done in Arcview with the back 10, 20 and 50 years respectively.
Results and Discussion
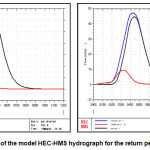
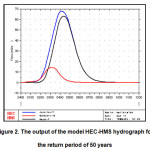
Flood simulation for Karaj area was residential areas to provide the results of the input data is given in Table 1. HEC-HMS model calibration and validation of the simulation of the hydrologic basin of Karaj indicates the average difference between 64/6% in the flood, and 08/29% in volume, respectively. The results indicate the importance of calibration parameters that CN and the early uptake of the results Khosroshahi (2007), Razavi (2005) and Knebl et al (2005) based on the calibration of SCS model to changes in the values ​​correspond CN. Implementation models for rainfall return periods 10, 20 and 50 years, respectively, leading to the occurrence of peak flows of 38.43, 17.61 and 4.85 cubic meters per second, which in Figures 2 and 3 Hydrvgraf output for different presented the results of other studies (East Water Engineers, 2009) and research (Mirzakhan, 2009) is not significantly different in the field. Thus, the model HEC-HMS study comparisons were made using the peak, the flood hydrograph base time and approved the formation of the findings (2004), Khosroshahi (2010), Jowkar (2011) and Knebl (2005) approving the performance of the model using the standard peak is full compliance.
Table 1: The input data for the model HEC-HMS
|
Basin |
Area (Km2) |
CN (I) |
S(mm) |
The initial attraction (mm) |
Time of concentration (min) |
Time delay (min) |
|
1 |
6.96 |
73 |
93.9 |
18.8 |
29.2 |
17.5 |
|
2 |
7.38 |
72 |
98.8 |
19.8 |
12.2 |
12.7 |
|
3 |
9.45 |
72 |
98.8 |
19.8 |
18 |
10.8 |
|
4 |
8.46 |
72 |
98.8 |
19.8 |
42.2 |
25.3 |
|
5 |
8.15 |
72 |
98.8 |
19.8 |
47.7 |
28.6 |
|
6 |
3.40 |
72 |
98.8 |
19.8 |
32 |
19.2 |
|
7 |
8.19 |
70 |
108.9 |
21.8 |
48 |
28.8 |
|
8 |
1.96 |
73 |
93.9 |
18.8 |
33.4 |
20 |
|
9 |
8.08 |
68 |
119.5 |
23.9 |
45.2 |
27.1 |
|
10 |
13.85 |
70 |
149.2 |
29.8 |
75.1 |
45.1 |
 |
|
 |
|
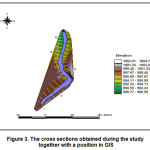
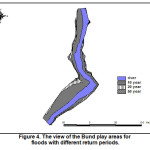
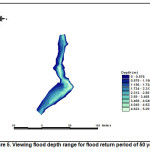
The interval is an extension of applying HEC-GeoRAS prepared as limiting stem geometric characteristics of the HEC-RAS lots is shown in Figure 1. HEC-RAS model results and Output in steady flow conditions to faces graphics and tables provide. These include cross sections, profiles, curves, Hydrograph and graphs next to each section and output joint on hydraulic systems. it is an agreement that given the multiplicity of levels, not included. The results of the HEC-RAS model indicates the ability to determine the flow models in the range have been studied. According to the initial information provided geometry in GIS, HEC-RAS and GIS applications combining high potential in Karaj have watershed management, floods which also results et al (2002), Sadeghi and Jalai Rad (2004 ) that the successful integration of the hydraulic model HEC-RAS and Arc View GIS is consistent in. It also displays the HEC-RAS Output GIS to better understand conditions in the event of floods show that by the results Sadiq (2007) is consistent. In Figure2, for example, the depth of flood maps are 50 years old.
 |
|
 |
|
 |
|
Conclusion
The results indicate the ability of HEC-HMS and HEC-RAS models in simulated the behavior of the hydrological and hydraulic basin is Karaj. The ability to use geographic information systems in providing inputs to the accuracy of model and view, combining performance shows. If the present composition of hydrometric and rainfall accompanied with appropriate data accurately convenient to be able to simulate floods on the other hand it is an accurate survey maps of the river bed and residential areas floodplain could be the efficiency and the accuracy of the maps as increase output. Thus, therapies studied in flood management and flood insurance and is also planning to develop residential areas for similar areas, especially urban areas recommended in throughput.
Refrences
- Benavides, J. A., Pietruszewski, B., Kirsch, B and Bedient, Ph., 2003. Analyzing Flood Control Alternatives for the Clear Creek Watershed in A Geographic Information System Framework, ruf.rice.edu
- De Hoo. A., Odijk, M., Koster. E. and Lucieer, A., 2001. Assessing The Effects of Land Use Changes on Floods in The Meuse and Oder Catchments, Phys. Chem. Earth(B), 26(7-8):593-599.
- HEC, 2002. River Analysis System: Hydraulic Reference Manual. Us Army Crops Of Engineers Hydrologic Engineering Center. Davis Ca
- 2000. Hydrologic Modeling System: Application Guide Us Army Crops of Engineers Hydrologic Engineering Center. Davis. C. A., 116p.
- Knebl, M.R., Yang, Z.L., Hutchison, K., Maidment, D.R., 2005. Regional Scale Flood Modeling using NEXRAD, Rainfall, GIS, and HEC-HMS\RAS: A Case Study for the San Antonio River Basin Summer 2002 Storm Event, Journal of Environmental Management, 75: 325-336.
- Radwan, A., 1999. Flood Analysis and Mitigation for Area in Jordan, Journal of Water Resources and Management, 125(3): 170-177.


