Socio-Economic Change Impact After the closure of Mining Activities. A Case study of Aravalli Hills of Faridabad District, Haryana
Deepa Nathalia 1 , Gopal Krishan 2 * and Naval Kishore 1
http://dx.doi.org/10.12944/CWE.12.2.12
Mining activities in Aravali hills had played a vital role in industrial growth of the Haryana state but these are also responsible to affect the environment and social life of the community located nearby the area. Present study carried out through special questionnaire consisting of selective parameters such as type of houses, source of water, sanitary facilities, source of income, source of energy, asset, communication services and educational status etc. This elicited from 326 residents of surrounding villages of mining areas situated in Aravalli hills explaining the socio-economic status of the local people after the closure of mining activities for 13 years. The finding shows both positive and negative impact of closure of mining activities. The positive impacts found as reduction in environmental degradation, health and education improvement, while the negative impact observed on income stability, employment, migration etc. Taking into consideration these impacts, government and regional organizations should take possible steps to overcome this major problem of the district.
Copy the following to cite this article:
Nathalia D, Krishan G, Kishore N. Socio-Economic Change Impact After the closure of Mining Activities. A Case study of Aravalli Hills of Faridabad District, Haryana. Curr World Environ 2017;12(2). DOI:http://dx.doi.org/10.12944/CWE.12.2.12
Copy the following to cite this URL:
Nathalia D, Krishan G, Kishore N. Socio-Economic Change Impact After the closure of Mining Activities. A Case study of Aravalli Hills of Faridabad District, Haryana. Curr World Environ 2017;12(2).
Available from: http://www.cwejournal.org/?p=17191
Download article (pdf)
Citation Manager
Publish History
Introduction
Beginning of mining and its termination contributes towards both positive and negative effect the socio-economic status of the people living in the mining areas and its surroundings. The positive contribution noticed in the form of increasing income source, job creation/increasing employment, migration, community formation, population growth and maintenance of social activities. While the negative impacts includes labour migration, loss of cultural heritage, and risk of health hazards and change of local population of the area by inviting labor from outside leading to income inequality among the employees, which further leads to community conflicts, and environment concerns. In addition to these, removal of vegetation, topsoil, waste and ore bring inevitable natural consequences such as deforestation, climate change, erosion, and air and water pollution13. The most noticeable impacts on the ecosystem are degradation of land, deforestation, displacement of wildlife, effects on aquatic ecosystem, loss of habitat for biodiversity including rare flora and fauna.
Kitula (2006)12 studied the socio-economic and environment impacts of mining in Geita District, Tanzania. These impacts included land degradation, damage to water quality, pollution, and harm to livestock and wildlife biodiversity. Behera (2015)2 reported that due to mining activity the stream water is contaminated, the agriculture field’s fertility is affected. Maconachie (2007)21 investigated that the economic, social, cultural, health and environmental impacts of medium and large-scale mining operations on local communities. The lack of effective or adequate employee training3 compounds the negative impacts of closure, including inadequate job creation. Unemployment, loss of social services and amenities, pollution, disturbance of the landscape, the loss of land utility and increased risks to health and safety.1, 18
Researchers11,19 reported that the mining ban has affected the economic life of most of the Goans, people are unemployed and cannot get an alternate job. Lad et al (2009)16 stated that when the mines close all the economic opportunities cease which leads to disruption of the economic base of the communities. The society living near mining industry is at higher risk of facing adverse effects of unplanned mine closure in near future7,25,27. Sarkar et al (1996)26 illustrated abandoned mine sits after the closure of mining activities continue to pose potential threat to human safety, health and environment. Limpitlaw (2004)17 stated that mine site closure planning should occur within the initial mine site operations. Various literature indicates that improved mine closure and mine site rehabilitation planning are best mining procedures, identifies mining for closure as a sustainability issue, and is no longer simple an environmental issue23. The socio-economic impact of closure of mining activities are the issue that is captured in the mine legislation, however are increasingly including in the mine closure procedures and plans of leading mining companies4, 8, 9, 10,22.
Change in Social and economic variables are the two major aspects that concertize this survey. This study represents the socio-economic status just during the mining activities and after the closure of mining activities. This study provides new insights because generally economy heavily depends upon mining activities and it decline after the closure of mining activities.
Study Area
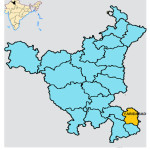
A study area (fig.1) Faridabad district of Haryana lies between the latitudes 27o 51’ 15” and 28o 30’ 52” North and the longitudes 77o 04’ 39” and 77o 35’ 50” East covering an area 273 km2 and is represented in the survey of India topographical sheet No: 53H/3 and 53H/7on the scale of 1:50,000. The Aravalli hills are taken as the main centre of the study area, which is, located about 10-12 km from the Faridabad city. Mining in the Aravalli range provides open cast mining of Silica, Quartzite, Badarpur sand and other good quality construction materials, which is basic need of construction activities. During mining activities, it provided livelihood to a large section of society living in and around the villages of mining areas.
 |
|
Methodology
The field survey of the study has been done in October to December 2015 in and around the villages of the mining area. The data of the study has been divided into two categories i.e Primary and Secondary data. Primary data are collected through questionnaire interviews, focus group discussion (FGDs), and other participatory approach. Primary data are raw data while secondary data are already processed data presents in unpublished reports, publications and stored in the forms of soft or hard copy. This study is strictly follows a primary data based on specific questionnaire. Data from 326 samples (242 in the Aravalli hills and 84 around Aravalli hills) collected based on framed questionnaires on the idea to compare socio-economic impact in two different conditions. The survey frame follows the study, which is preparatory and descriptive in nature, and the data are strictly collected from the selected samples. The conducted samples survey covers about 84 households (out of 1694) around Aravalli hills and 242 households (out of 4882) from different villages in Aravalli hills.
Results and Discussion
Socio-economic change detection analysis of the households
In this section, household status is analysed based on following parameters, namely demographic features, housing particulars, income and expenditure particulars to assess common property resources, basic infrastructure and basic facilities to the mining people provided by mining owner or government are presented here. Analysis was carried out on the possible facts of mining on the financial capital (household income), physical capital (land, house and other physical asset), human capital (health and literacy), social capital (displacement and social network) and shown in Table nos. 1 to 13. In Table 1, the details of the villages and population are given and Table 2 provides the number of males and females surveyed in and around Aravalli hills.
Table 1: Number of villages surveyed in and around the Aravalli hills.
|
Sr.no |
Villages in Aravalli Hills |
Household(survey)/Total Household |
Villages around Aravalli Hills |
Household (survey)/Total Household |
|
|
1 |
Manger |
18/368 |
Pakhal |
12/250 |
|
|
2 |
Kot |
10/203 |
Peota |
24/480 |
|
|
3 |
Dhoj |
102/2046 |
Alampur |
27/545 |
|
|
4 |
Selakhri |
8/157 |
Sirohi |
21/419 |
|
|
5 |
Gothda Mohabattabad |
26/534 |
- |
- |
|
|
6 |
Pali |
62/1258 |
- |
- |
|
|
7 |
Anangpur |
16/316 |
- |
- |
|
|
Total |
242/4882 |
84/1694 |
|||
Data source- Census Handbook (2011)5
Table 2: Demographic Features of sample Households both in values and in percentage
|
Variable |
Villages in Aravalli Hills (N=350) |
Villages Around Aravalli Hills (N=90) |
Total (N=440) |
|
Gender Male Female
|
189(54.07) 161.(45.93)
|
49(54.44) 41(45.55)
|
238(54.09) 202(45.90)
|
N is a number of people surveyed.
Table 3: Socio-Economic change detection of the respondents in 2015 and 2002.
|
Variable |
Villages in Aravalli Hills |
Villages around Aravalli Hills |
||||
|
2002 (%) |
2015 (%) |
Difference |
2002 (%) |
2015 (%) |
Difference |
|
|
Labour |
7.6 |
30.53 |
+22.93 |
13.6 |
13.87 |
+0.27 |
|
Businessman |
9.3 |
15.64 |
+6.34 |
3.0 |
3.56 |
+0.56 |
|
Mining involvement |
34.6 |
Ban |
-34.6 |
4.0 |
Ban |
+4.0 |
|
Agriculture |
45.50 |
48.46 |
+2.96 |
78.2 |
81.23 |
+3,03 |
|
Government Employee |
3.0 |
5.64 |
+2.64 |
1.2 |
1.34 |
+0.14 |
Employment change
Mining industry not only creates mining jobs but also generates employment indirectly by stimulating demand for goods and services. Mine spends thousands of rupees on equipment, maintenance, food and other services and often use local contractors and suppliers. This creates jobs indirectly in processing of mined material, transportation, and providing equipment and services to the mining industries. The analysis of economic activities of the people reveals that the agriculture is still the most prominent activities among the people from 2002 to 2015 in all the regions (Table 3). In Aravalli hills, most of people had engaged in Mining activities that was the most famous and best occupation in this region until 2002. 38.8% people were engaged in mining activities. However, after the closure of mining activities most of the people moved from mining area to other areas and some of them opted other occupation due to the consequent decreasing economic status. Around the Aravalli hills, 78.2% in 2002 people were engaged in agriculture, which is increased by 3.03 from 2002 to 2015. Crusher zone in Mohabattabad and Pali are still running. It gets raw material from Rajasthan and other surrounding areas after the closure of mining activities.
Table 4: Surveyed on Literacy status in 2002 and 2015.
|
Variables |
Village in Aravalli Hills |
Village Around Aravalli Hills |
||||
|
2002(%) |
2015(%) |
Difference |
2002(%) |
2015(%) |
Difference |
|
|
Illiterate |
61.34 |
54.23 |
-7.11 |
75.91 |
68.56 |
-7.35 |
|
Below primery |
13.32 |
14.80 |
+1.48 |
11.02 |
13.23 |
+2.21 |
|
Primery |
11.6 |
13.34 |
+1.74 |
8.02 |
9.38 |
+1.36 |
|
Secondary |
9.39 |
11.21 |
+1.82 |
4.03 |
5.03 |
+1.0 |
|
Higher seconary |
4.23 |
6.08 |
+1.85 |
2.12 |
4.02 |
+1.9 |
|
Graduation and above |
0.12 |
0.34 |
+0.22 |
0.3 |
0.5 |
+0.2 |
Literacy Status
The data on education status of sample household indicates that illiteracy is decreases from 2002 to 2015 (Table 4). It is also observed that the less number of people are matriculate and graduate. It is due the reason of lack of necessary literacy skill, awareness and also facilities in school. Other factors responsible are illiteracy of parents and distant locations of school or colleges.
Table 5: Surveyed on landholding in 2002 and 2015
|
Variable |
Village in Aravalli Hills |
Village around Aravalli Hills |
||||
|
2002 (%) |
2015 (%) |
Difference |
2002 (%) |
2015 (%) |
Difference |
|
|
Landless |
13.45 |
25.64 |
+12.19 |
21.45 |
34.09 |
+12.64 |
|
<2acres |
34.67 |
36.05 |
+1.38 |
34.71 |
45.07 |
+10.36 |
|
2-5 acres |
47.23 |
30.89 |
-16.34 |
28.67 |
17.08 |
-11.59 |
|
5 acres and above |
4.65 |
7.42 |
+2.77 |
15.17 |
13.76 |
-1.41 |
Landholding
India is an agrarian economy mostly dominated by the small and marginal farmers. Land holding is one of the most important activity among people. However, survey of the study depicts (Table 5) that the number of the people in Aravalli villages who have 2-5 acres are 47.23 % in 2002 which decreased to 30.89% in (2015) indicating that during mining activities people have more income and had more land.
Table 6: Surveyed on Monthly income in 2002 and 2015.
|
Variable (Rs.) |
Mining in Aravalli Hills |
Mining around Hills |
||||
|
2002(%) |
2015(%) |
Difference |
2002(%) |
2015(%) |
Difference |
|
|
<5000 |
12.87 |
8.87 |
-4 |
13.45 |
7.45 |
-6 |
|
5000-10000 |
34.45 |
44.71 |
+10.26 |
46.35 |
45.9 |
-0.45 |
|
10000-15000 |
23.75 |
28.97 |
+5.22 |
34.60 |
38.76 |
+2.16 |
|
15000 and above |
28.93 |
17.45 |
-11.48 |
5.60 |
7.89 |
+2.29 |
Income Status
Income details collected from various sources shows that in 2002, only 28.93 % people had good salary i.e. above Rs. 15000 (Table 6) which is decreased to 17.45 % in 2015 (after the closure of mining activities). This reveals that the people got benefits from mining activities but presently an average person earns 5000-10,000 per month by doing labour or some other works. After the closure of mining activities, they do not have good occupation.
Table 7: Survey on Monthly Expenditure in 2002 and 2015
|
Variable (Rs.) |
Mining in Aravalli Hills |
Mining around Aravalli hills |
||||
|
2002(%) |
2015(%) |
Difference |
2002(%) |
2015(%) |
Difference |
|
|
<1000 |
65.34 |
21.03 |
-44.31 |
72.45 |
36.78 |
-35.67 |
|
1000-2000 |
14.7 |
32.64 |
+17.94 |
12.89 |
45.08 |
-32.19 |
|
2000-3000 |
12.07 |
35.43 |
+23.36 |
8.09 |
13.11 |
+5.02 |
|
>3000 |
7.89 |
10.90 |
+3.01 |
0.56 |
5.03 |
+4.47 |
Expenditure Status
In the villages, most of the household spend a large part of their income on food, and less on non-food items. As the income increases expenditure also increases on non-food items especially on health, education, recreational/entertainment, etc. Income and expenditure are directly proportional to each other. The study reveals that number of people in villages under Aravalli hills having monthly expenditure Rs. 2000-3000 per month is 12.07% (2002) increased to 35.43 % (2015) which have been increased by 23.36 (Table 7) with respect to time because with the time wages increase as per government rule.
Table 8: Survey on Vehicle possession in 2002 and 2015
|
Variable |
Village in Aravalli Hills |
Villages around Aravalli Hills |
|||||
|
2002(%) |
2015(%) |
Difference |
2002(%) |
2015(%) |
Difference |
||
|
No-vehicle |
11.34 |
7.90 |
-3.44 |
19.05 |
12.10 |
-31.15 |
|
|
cycle |
39.45 |
28.23 |
-11.22 |
65.58 |
60.18 |
-5.4 |
|
|
Two-wheeler |
18.53 |
45.78 |
+27.25 |
12.34 |
23.70 |
+11.36 |
|
|
Four wheeler |
21.68 |
18.09 |
-3.59 |
3.03 |
4.02 |
+7.05 |
|
Vehicle Possession
The survey of households data shows that 11.34% people who lived in Aravalli hills had no vehicle in 2002 further decreased to 7.90% in 2015 (Table 8) and 21.68 % people had four wheeler vehicle specially trucks in 2002 which is decreased to 18.09% in 2015. This shows that when people engaged in mining activities (2002) had good income and had ability to buy trucks for further use in mining work for their benefits. Large number of people who lives in village around the Aravalli hills still have cycle, which indicates that more number of people are poor and have no alternative source of income to increase their standard of living.
Table 9: Surveyed prospective on water Facilities in 2002 and 2015
|
Variable |
Villages in Aravalli Hills |
Villages Around Aravalli Hills |
||||
|
2002(%) |
2015(%) |
Change |
2002(%) |
2015(%) |
Change |
|
|
Bore well |
74.34 |
54.02 |
-20.32 |
76.02 |
43.89 |
-32.13 |
|
Tube well |
25.66 |
45.98 |
+20.32 |
23.98 |
56.11 |
+32.13 |
Water facilities
The sample household data on the wells situated in and around the mining areas, shows that the large number of the people i.e.74.34 % in 2002 in villages of Aravalli hills, depends on bore well, which is reduced to 54.02 % in 2015 (Table 9). However, now people use tube wells increased from 25.66 % in to 45.98% in 2015. A large extractions from groundwater has resulted in increasing the depth to water level which has been observed in many studies in northwest India and Indo-gangetic basin 3,14,15,20,24.
Table 10: Survey on House types of villages in 2002 and 2015
|
Variable |
Villages in Aravalli hills |
Villages around Aravalli hills |
||||
|
2002(%) |
2015(%) |
Difference |
2002(%) |
2015(%) |
Difference |
|
|
Pucca House |
34.56 |
67.32 |
+32.76 |
27.89 |
63.49 |
+ 35.6 |
|
Mixed House |
33.43 |
19.68 |
-12.75 |
33.66 |
27.51 |
- 6.15 |
|
Kutcha House |
32.01 |
13.0 |
-19.01 |
38.45 |
9.01 |
- 29.44 |
Housing Types
House variable is consisting of three different types of houses i.e Pucca houses, mixed houses and Kutcha houses (Table 10). Pucca houses are strong houses, which is made up of wood, bricks, cement, iron rods and steel also called permanent house. Mixed house made of both type of material wood, brick, cement, wood , mud, straw these types of houses are not strong as pucca house but better than Kutcha house. Kutcha house is made up of wood, mud, straw and dry leaves also called temporary houses. The data on housing variables shows that in Aravalli hills, people lived in all types of house during mining activities (2002) but after the closure of mine (2015) number of people live in pucca house increased by 32.76% from 2002 to 2015. This increasing trend can be attributed to the good amount saved from the salaries received while engaging in the mining activities as per the information received after interview. Most of People who lived in villages around the Aravalli hills had kutcha house in 2002 i.e 38.45% decreased to 29.44% in 2015. According to survey, most of people here are engaged in Agriculture and they do not get sufficient income from agriculture and still they lives in mixed or kutcha type of house.
Table 11: Health Status in 2002 and 2015
|
Variable |
Mining communities |
Non-mining communities |
||||
|
2002(%) |
2015(%) |
Difference |
2002(%) |
2015(%) |
2015 |
|
|
Respiratory diseases |
37.82 |
13.24 |
-24.58 |
9.02 |
5.68 |
-3.34 |
|
Problem from water(Teeth problem, Geying of hair, bones related problem, malaria) |
15.49 |
34.61 |
+19.21 |
22.53 |
47.63 |
+25.1 |
|
Skin Diseases |
8.86 |
1.24 |
-7.62 |
3.40 |
12.1 |
+8.7 |
|
No Major Diseases |
36.42 |
41.93 |
+5.51 |
64.68 |
33.06 |
-31.62 |
Health Status
Diseases classified into various types of sub categories some of them caused during working in mining activities such as loss of hearing, lungs problem including respiratory problem, Asthma, tuberculosis, chronical bronchitis, skin allergies etc. Some of them cause due to waste of mining activities and mining pits with water such as water borne diseases including, malaria, cholera, intestinal diseases etc. caused due to poor water quality such as weakening and yellowing of teeth, greying of hair, bones related problem, gastric problem. According to secondary data and interview report respiratory diseases has been decreased after the closure of mining activities because most of the skin allergies and respiratory problem had been caused due to dust, which was spread during extraction of sand mining. Presently, number of people who live around the Aravalli hills has water related diseases increased by 47.63% with the difference of 25.53% from 2002 to 2015. The diseases may be due to the poor water quality and water borne disease originated in stagnant water in abandon pits during monsoon season.
Table 12: Types of fuel in 2002 and 2015
|
Variable |
Villages in Aravalli Hills |
Villages around Aravalli Hills |
||||
|
2002(%) |
2015(%) |
Difference |
2002(%) |
2015(%) |
Difference |
|
|
Wood |
82.89 |
64.89 |
-18 |
85.64 |
81.45 |
-4.19 |
|
Gas |
17.32 |
35.11 |
+18 |
14.36 |
18.55 |
+4.19 |
Fuel
Firewood was the major source of fuel in 2002 in and around the Aravalli zone (Table 12). Wood use decreased from 82.89% to 64.89% from 2002 to 2015 in Aravalli hills and 85.64 % to 81.45% around Aravalli village. Other sources of fuel LPG increased from 17.32% to 35.11% in Aravalli hills and 14.36% to 18.55% around Aravalli hills but still people here mostly, depend on firewood because due to its easy availablability in forest area.
Table 13: Road condition and electricity in 2002 and 2011.
|
Variable |
Villages in Aravalli Hills |
Villages around Aravalli Hills |
|||||
|
2002(%) |
2015(%) |
Difference |
2002(%) |
2015(%) |
Difference |
||
|
Road condition |
Bad |
16.03 |
23.56 |
7.53 |
48.87 |
12.58 |
36.29 |
|
Moderate |
75.64 |
65.87 |
9.77 |
43.64 |
67.60 |
23.96 |
|
|
Good |
18.33 |
10.56 |
7.77 |
7.49 |
19.82 |
12.33 |
|
|
Electrification |
Yes |
55.56 |
68.78 |
13.22 |
47.85 |
60.32 |
12.47 |
|
No |
44.44 |
31.22 |
13.22 |
52.15 |
39.68 |
12.47 |
|
Road condition and electrification
The road connectivity to the household information reveal that 75.64% road condition were in good to moderate condition during the times of mining but deteriorated due to lack of maintenance after the closure of mines. The electrification still in poor condition.
Conclusion
- A total number of 326 people were selected for in-depth interviews with the help of framed questionnaire in relation to analyse the change detection in the Aravalli hills of Faridabad. Out of the total number of people interviewed, most of them belongs to the age group of 30-40 years and majority of them were males. Socio-economic status before the closure of mine has been collected from published/unpublished reports, state, local experts and impacted group of population who were directly or indirectly involved in mining activities.
- According to respondent interviewed mining activities, produce a good source of income to the people. A large number of the people willing to do mining related work in the mining industries if a job will offer to them irrespective of their educational qualification. From the survey it is highlighted that less number of the respondents hardly have, their higher degree even does not have matriculation degree, which indicates that educational qualification is not only the prerequisite for the people to start mining activities.
- As per survey, respondent wish to work in the mining companies again rather than their own business because mining companies make good relationship with their workers by offered them good income with necessary facilities.
- As the mining provided a lots of opportunities to the local people consequently majority of the people have been affected by the closure of mining activities as it created unemployment among the people and still people do not get suitable job for their daily expenditure.
- In order to overcome the financial trouble the government had offered some financial facilities to the affected people but from the survey it is opened that very few people availed these facilities and those who availed the facilities they were not satisfied with the money.
- Research survey indicated that banning on mining sites has affected the economic status of the local people. A large number of people are presently unemployed because they do not have good jobs due to lower educational qualification and less job opportunities in the areas. People who have invested huge amount of money in the mining business on finance have faced instalment burden. These people are mostly truck and barges owners. They are continuing their life with the belief that someday mining will begin again.
- The ban of mining resulted in the huge changes in the demographic status, migration of people in the search of job have been increase and some of them leaves villages under mining area for better job opportunities.
- Mining is an important economic activity in Aravalli zone provides direct or indirect employment facilities such as transport, medical, educational facilities and welfare amenities to the worker. Now, government should take some positive step for the welfare of the affected people. They should start up mining again if possible or arranged some alternative source of income with all basic facilities even after the closure of mine so they would maintained their healthy life.
- After the closure mine, mining sites should be reused as recreational land, visitor attractions, creative gardens and lakes with the collaboration of mining companies, investors, and land use planners etc. to enhance the job opportunities for the local people.
- Mining must be environmentally sustainable by innovative methods that decrease the environmental impact caused by mining activities. These methods include parameters such as decreasing water and energy utilization, minimizing land mismanagement, water and air pollution at mine sites and maintaining prosperous mine closure and reclamation activities.
References
- Azapagic, A. Developing Framework for sustainable Development indicators for the Mining and Minerals Industry. Journal of cleaner production.Vol 12.page:-639-662(2003).
- Behera, P K. Socio-Economic Impact of Industrialization and Mining on the Local Population: A case Study of Nalco Industrial area, koraput International Journal of Economics and Management Sciences4:273.doi:10.4172/21626359.1000273 (2015).
- Brady, K., Clipsham, J and Thomas, W. Stake holder engagement at Falconbrige/Noranda Environment case study: Five winds International (2004).
- Bass, S. ‘Change towards Sustainability in Resource Use; Lessons for MMSD from the mining sector’, Canadian Mining Journal, Canada (2001).
- Census handbook 2011.
- Chopra, R.P.S. and Krishan, Gopal. Analysis of aquifer characteristics and groundwater quality in southwest Punjab, India. Journal of Earth Science and Engineering. 4(10): 597-604 (2014).
- Haney, et al. Mine closure and its impact on the community: Five year after the closure in Romania, Russia and Ukraine (2003).
- Dickson, M., and Nyariki. Household data collection for socio-economic Research in Agriculture: Approaches and Challeges in Developing Countries. Journal of social science (2009).
- Himansu, S P., Kumar M., Sethy, M., and Mohan K. Socio-economic profile and quality of life of villages in and around mining area of Keonjhar District, Orissa, India, International research journal of social sciences (2015).
- http://www.miningfacts.org
- Jorge, T et al. Survey of Environmental & Socio-Economic Impacts of Interim ban on miningin Goa. Published report in 2013 by EIA Resource and Response Centre Goa, India (2013).
- Kitula, A. The environmental and socio-economic impacts of mining on local livelihoods in Tanzania: A case study of Geita district. Journal of cleaner Production 14:405-414 (2006).
CrossRef - Krishan, Gopal,; Kushwaha, S.P.S and Velmurugan, A. Land degradation mapping in upper catchment of river Tons. Journal of Indian Society of Remote Sensing. 37: 49-59 (2009).
CrossRef - Krishan, Gopal, Rao, M.S., Loyal, R.S., Lohani, A.K., Tuli, N.K., Takshi, K.S., Kumar, C.P., Semwal, P and Kumar Sandeep. Groundwater level analyses of Punjab, India: A quantitative approach. Octa Journal of Environmental Research. 2(3): 221-226 (2014).
- Krishan, Gopal, Lohani, A.K., Rao, M.S., Kumar, Sudhir and Takshi, KS. Spatiotemporal Variability Analysis of Groundwater Level for Water Resources Development and Management in Northern Punjab, India. Journal of Environmental and Analytical Toxicology. 5(4):279 (2015).
- Lad, R et al. Environmental and social impacts of mining in the Western Ghats: A case study of warna Bain (2009).
- Limpitlaw, D. ‘Mine closure as a framework for sustainable Development; Sustainable Development Practices on mine sites, University of the Witwatersrand (2004).
- Laurence, D. Optimisation of the mine closureprocess. Journal of cleaner Production, Vol 14, 2006, pp285-298 (2006).
- Manerkar Gouri, K. Impact of mining Ban on the Goan economy- A case study. International journal in commerce. IT & Social science: ISSN-2394-5702 (2015).
- MacDonald, Alan, Bonsor, Helen , Ahmed, Kazi, Burgess, William, Basharat, Muhammad, Calow, Roger, Dixit, Ajaya, Foster, Stephen, Krishan, Gopal , Lapworth, Daniel , Lark, Murray, Moench, Marcus, Mukherjee, Abhijit, Rao, M.S., Shamsudduha, Mohammad, Smith, Linda, Taylor, Richard, Tucker, Josephine, Steenbergen Frank van, Yadav, Shobha. 2016. Groundwater depletion and quality in the Indoâ€Gangetic Basin mapped from in situ observations. Nature Geosciences. 9:762-766 (2016).
CrossRef - Maconachie, R., and Binns, JA. Farming miners or mining farmer? Diamond mining rural development in post -conflict Sierra Leone. Journal of Rural studies 23:367-380 (2007).
CrossRef - Kumar, P B. Socio-economic impact of industrialisation and mining on local population: A case study of Nalco Industrial Area, Koraput. International Journal of Economic and Management Sciences. Issn-2162-6359 (2015).
- Peck, P. ‘Mining for closure; Policies and Guidelines for sustainable Mining Practice and Closure of Mines’. The Environment Security (ENVSEC) (2005).
- Priyanka, Krishan G, Sharma L. M, Yadav B. K, Ghosh N. C. Analysis of Water Level Fluctuations and TDS Variations in the Groundwater at Mewat (Nuh) District, Haryana (India). Current World Environment. 11(2): 388-398 (2016).
CrossRef - Rao, P and Malikarjun et al. Socio-economic impacts of mine closure: A case study using Satellite imagery. International journal of Environment Studies: 0020-0400 (2007).
- Sarkar, S.K. and Sarkar, S. State of Environmental and Development in Indian coalfields: Coalfields in west Bengal ( IBH Publishing)(1996)
- Stacey, J et al. The socio-economicaspects of mine closure and sustainable development:literature overview and lessons for the socio-economic aspect of closur.Report (2010).


