Land Use and Land Cover Mapping Based on Normalized Difference Vegetation Index Using Remote Sensing and Geographical Information System in Banjar River Watershed of Narmada Basin
Jagriti Tiwari 1
*
 , S.K.Sharma 1
and R.J.Patil 2
, S.K.Sharma 1
and R.J.Patil 2
1
Department of Soil and Water Engineering,
College of Agricultural Engineering, J.N.K.V.V,
Jabalpur,
(M.P.)
India
2
Department of Engineering, Schofileld Centre,
University of Cambridge, Cambridgeof Engineering,
U.K
http://dx.doi.org/10.12944/CWE.12.3.19
The spatial analysis of land use and land cover (LULC) dynamics is necessary for sustainable utilization and management of the land resources of an area. Remote sensing along with Geographical Information System emerged as an effective technique for mapping the LU/LC categories of an area in an efficient and cost-effective manner. The present study was conducted in Banjar river watershed located in Balaghat and Mandla district of Madhya Pradesh, India. The Normalized Difference Vegetation Index (NDVI) approach was adopted for LU/LC classification of study area. The Landsat-8 satellite data of year 2013 was selected for the classification purpose. The NDVI values were generated in ERDAS Imagine 2011 software and LU/LC map was prepared in ARC GIS environment. On the basis of NDVI values five LU/LC classes were recognized in the study area namely river & water body, waste land & habitation, forest, agriculture/other vegetation, open land/fallow land/barren land. The forest cover was found to be highly distributed in the study area with an extent of 115811 ha and least area was found to be covered under river and water body (4057.28 ha). This research work will be helpful for the policy makers for proper formulation and implementation of watershed developmental plans.
Copy the following to cite this article:
Tiwari J, Sharma S. K, Patil R. J. Land Use and Land Cover Mapping Based on Normalized Difference Vegetation Index Using Remote Sensing and Geographical Information System in Banjar River Watershed of Narmada Basin. Curr World Environ 2017;12(3). DOI:http://dx.doi.org/10.12944/CWE.12.3.19
Copy the following to cite this URL:
Tiwari J, Sharma S. K, Patil R. J. Land Use and Land Cover Mapping Based on Normalized Difference Vegetation Index Using Remote Sensing and Geographical Information System in Banjar River Watershed of Narmada Basin. Curr World Environ 2017;12(3). Available from: http://www.cwejournal.org?p=1036/
Download article (pdf)
Citation Manager
Publish History
Introduction
The earth resources are key component in the development of a nation as well as of a region. The update information of the landscape is of great significance in the management and monitoring of an environment. LU/LC classification is one of the prime prerequisites for analyzing the information of the existing earth resources and changes occurring on the landscape pattern of an area through time. Land cover data refers to the area of a region covered under natural resources viz. forests, wetlands, agriculture, and other land, rivers and water bodies. Land use documents for the region utilized for carrying anthropogenic activities – whether for development, conservation, mining and mixed uses1. In present scenario, the modernization and immense increase in population has imposed pressure on the available earth resources. Overexploitation of the land resources creates an alarming condition for the rational use of these resources. Therefore, to forbid this overuse, the accurate mapping of LU/LC is very essential. Satellite image classification is an important procedure to categories the different features of the landscape for proper planning of the conservative measures2,3.
Observation of Earth surface from space is crucial phenomena to understand the influence of human interferences and there by impacts on changes in the pattern of land over time4,5. The introduction of Remote Sensing in the field of advance technology has made it possible to generate landscape information at regional and local scales6,7. The Remote Sensing when integrated with Geographical Information System becomes more effective toolset and has considerable potential to efficiently analyse the landscape dynamics8,9,10,11. The combination of RS and GIS provides a suitable platform analysing the data to study the transitions of the land landscape in less time and with better accuracy in a cost effective manner12.
The classification of multi-spectral satellite images has been successfully applied for classifying the different features of land. But mapping of landscape on the basis of Remote Sensing index i.e. Normalized Difference Vegetation Index (NDVI) by utilizing the satellite data proves to be an effective way of classifying the LU/LC. In order to estimate quantity, quality and changes occurring in vegetation, NDVI takes into account the spectral information of red and near infrared bands13,14,15. It is rely upon the reflectance characteristics of vegetation, water, rocks and bare soil16. Additionally, the generated NDVI data could be utilized to identify the pattern of changes occurring on vegetation cover on temporal basis. The NDVI data layer is defined as:
NDVI = (NIR – red) / (NIR + red)
Where NIR refers to spectral reflectance in near infrared band and R refers to red band. The development of NDVI led to worldwide application of it in RS and GIS based studies. 17. NDVI values lies between -1.0 and 1.0, where higher values are for higher intensity of dense green vegetation and lower values for other surface materials. Bare soil is associated with NDVI values which are nearest to 0 and water bodies are indicated with negative NDVI values18. The important concept of analysising vegetation using NDVI is the high absorption of chlorophyll which is a vegetation pigment in the red spectral region and high reflectance in the near infrared region. NDVI is greatly related with the photosynthetic activity and represents the greenness of dense vegetation. It can significantly separate various spectral classes of LULC. NDVI can be used for comparison of vegetation index information derived from different dates of satellite imagery. This paper concentrates on land use and land cover classification based on NDVI by employing Remote Sensing and Geographical Information System in Banjar River watershed of Narmada Basin.
Overview of Study Area
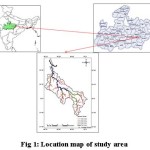
The study focuses on Banjar river watershed which lies in Upper Narmada basin (Fig 1)
geographically located in Balaghat and Mandla districts of Madhya Pradesh, with extent of 22005’N to 23029’N latitudes and 80022’E to 81000’E longitudes. The watershed covers about 246084 ha up to gauging point. Climate of the area is tropical with moderate winter and severe summers and well distributed rainfall received from southwest monsoon. The normal annual rainfall of study area is 1300 mm. Soils of the area are categorized in black grey, red and yellow colours. The shallow soil is found in barren lands.
 |
|
Materials and Method
Database Generation
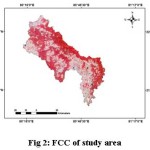
The satellite data of study area has been acquired in the year 2013. The data set was Landsat-8 OLI-TIRS consist of eight bands downloaded from scientific user’s website Earth Explorer (USGS) (https://earthexplorer.usgs.gov) at the resolution of 30 m. This dataset was imported in ERDAS Imagine 2011. This image processing software was used to generate a false colour composite (FCC) (Fig 2) of study area by selecting the layer stack option available in image interpreter toolset. The study area was extracted from satellite image by taking geo-referenced out line boundary of Banjar river watershed. Universal Transverse Mercator (UTM) coordinate system, Datum WGS 1984, zone 44 North projection system was used for projecting the satellite data using 1:250, 000 topographic map of Banjar river watershed. This data was utilized for LU/LC classification.
 |
|
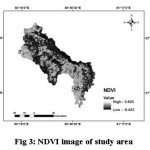
Land use and land cover mapping using NDVI
The LU/LC features of the study area were classified using Landsat-8 satellite data. The NDVI is found to be an appropriate remote sensing index to understand the variation in the LU/LC pattern. The NDVI tool present in classification menu of ERDAS imagine 2011software was used for creation of NDVI image (Fig 3) using false color composite image of study area. The NDVI images magnified the vegetation class in the satellite images and helped in distinguishing it from other non-vegetation classes. The spectral classes which are function of NDVI are evaluated to assign into suitable LU/LC classes. The various LU/LC classes interpreted in the study area include, river & water body, waste land & habitation, forest, agriculture/other vegetation, open land/fallow land/barren land (Table 1).
 |
|
Table 1: Detailed description of land use and land classification
|
Sr. No. |
Class Name |
Description |
|
1. |
River & Water body |
River, open water and ponds |
|
2. |
Waste land & Habitation |
Sandy area, land with or without scrub, Marshy area, Residential, commercial, industrial area |
|
3. |
Forest |
Mixed forest lands |
|
4. |
Agriculture/other vegetation |
Crop fields, Plantations |
|
5. |
Open land/Fallow land/Barren land |
Grazing land, land temporarily out of cultivation and land which cannot be brought under cultivation |
Result and Discussion
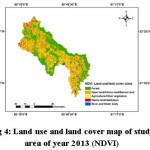
Five categories of LU/LC classes have been identified in the study area, these are - river & water body, waste land & habitation, forest, agriculture/other vegetation, open land/fallow land/barren land. The NDVI method of classification was adopted for LU/LC mapping. The NDVI values calculated from Landsat-8 satellite image of year 2013 was found to be in the range of 0.62 to -0.422. The higher values of NDVI were found in the areas covered under forest. The lower values of NDVI were found in the rivers and water bodies. LU/LC map of study area is shown in Fig 4. Area covered under different categories is presented in Table 2.
 |
|
Table 2: Distribution of study area under different LU/LC classes in 2013
|
NDVI based LU/LC classes |
2013 |
|
|
Area (ha) |
Area (%) |
|
|
River and Water body |
4057.28 |
1.65 |
|
Waste land and Habitation |
5872.86 |
2.39 |
|
Forest |
115811.00 |
47.06 |
|
Agriculture/Other vegetation |
49472.50 |
20.10 |
|
Open land/Fallow land/Barren land |
70870.40 |
28.80 |
The LU/LC map of the study area illustrates that forest occupies the highest proportion of area i.e. 115811.00 ha in relation to the other classes. The study area covered under forest is highly covered with the different mixed forests such as Sal, Teak etc. It is noteworthy that area extension under agriculture/other vegetation is 49472.50 ha which is found to be quite less as compared to the area covered under open land/fallow land/ barren land (70870.40 ha). There is necessity of proper planning of land use and implementation of suitable agricultural practices. In contrast the wasteland and habitation cover is found to be less than the agriculture/other vegetation. This statistics reflects the high level impact of human encroachment and activities in the study area as the main occupation of people in Banjar river watershed is farming. The areal extent of river and water body is computed as 4057.28 ha which is less in comparison with other LU/LC classes.
Conclusion
The preparation of LU/LC maps is necessary for better understanding of land utilization pattern and its planning. The present study illustrates the usefulness of Remote Sensing and Geographical Information System for classifying study area as per the major LU/LC types on spatial basis. The NDVI method was proposed to identify the LU/LC categories. The higher values of NDVI were found in the forest cover which is the dominant feature of Banjar river watershed. The lower values of NDVI indicate an area under river and water body. It can be concluded that NDVI formed the basis for better classification of different features of an area and can be utilized for effective analysis of the landscape information as compared to any other methods of classification.
Acknowledgement
The authors acknowledge all the support received from Department of Soil and Water Engineering, College of Agricultural Engineering, J.N.K.V.V., Jabalpur (M.P.), India for this study.
References
- National Ocean Service. Department of Commerce. https://oceanservice.noaa.gov/facts/lclu.html. Visited on 6 July 2017.
- Tiwari, J., Sharma, S. K. and Patil, R. J. 2017. An Integrated Approach of Remote Sensing and GIS for Land Use and Land Cover Change Detection: A Case Study of Banjar River Watershed of Madhya Pradesh, India. Current World Environment. 12(1): 157-164 (2017).
- Patangray, A.J., Patil, N.G., Singh, S.K., Mishra, V.N., Reddy, C.V.P. and Ramteke I.K. Land use/land cover change detection using geospatial techniques in Kupti watershed of Darwha block of Yavatmal district, Maharashtra. Journal of Soil and Water Conservation. 16(1) (2017).
- Howart Z. Using Landsat Satellite Imagery to Determine Land Use/Land Cover Changes in Međimurje County, Croatia. Hrvatski Geografski Glasnik. 75/2; 5-28 (2013).
- Sreenivasulu, G, Jayaraju, N, Pramod Kumar, M and Lakshmi Prasad, T. An Analysis on Land Use/Land Cover Using Remote Sensing and GIS – A Case Study In and Around Vempalli, Kadapa District, Andhra Pradesh, India. International Journal of Scientific and Research Publications. 3(5); 1-4 (2013).
- Sharma, S.K., Yadav, A and Gajbhiye, S. Remote Sensing and GIS Approach for Prioritization of Watershed. LAP LAMBERT Academic Publishing. (2014)
- Patil, R.J., Sharma, S.K. and Tignath, S. Remote Sensing and GIS based soil erosion assessment from an agricultural watershed. Arabian Journal of Geosciences. 8; 6967–6984 (2015).
- Sharma, S.K., Tignath, S., Gajbhiye, S. and Patil, R.J. Application of Principle Component Analysis in Grouping Geomorphic Parameters of Uttela Watershed for Hydrological Modeling. International Journal of Remote Sensing & Geosciences. 2(6); 63-70 (2013a).
- Sharma, S.K., Tignath, S., Gajbhiye, S. and Patil, R.J. Use of Geographical Information System in Hypsometric Analysis of Kanhiya Nala Watershed. International Journal of Remote Sensing & Geosciences. 2(3); 30-35 (2013b).
- Patil, R.J., Sharma, S.K., Tignath, S. and Sharma, A.P.M. 2016. Use of remote sensing, GIS and C++ for soil erosion assessment in Shakker river basin. Hydrological Sciences Journal. http://dx.doi.org/10.1080/02626667.2016.1217413.
- Tiwari, J, Patil, R.J. and Sharma, S.K. Morphometric Analysis of Gour River Catchment: A GIS based approach. International Journal of Engineering Research-Online. 4 (5); 135-143 (2016b).
- Tiwari, J, Patil, R.J. and Sharma, S.K. Gour River Sub-watersheds Prioritization using Morphometric Parameters: A Remote Sensing and GIS Based Approach. International Journal of Science, Engineering and Technology Research (IJSETR). 5 (10); 3041-3046 (2016a).
- Pettorelli, N., Vik, J.O., Mysterud, A., Gaillard, J.M., Tucker, C.J. and Stenseth, N.C. Using the satellite-derived NDVI to assess ecological responses to environmental change. Trends in Ecology and Evolution.20; 503-510 (2005).
- Alves, D.B., Pérez-Cabello F and Mimbrero, M.R. Land-use and land-cover dynamics monitored by ndvi multitemporal analysis in a selected southern amazonian area (brazil) for the last three decades. The International Archives of the Photogrammetry, Remote Sensing and Spatial Information Sciences, Volume XL-7/W3, 2015.
- Reddy, A.S. and Reddy, M.J. NDVI Based Assessment of Land Use Land Cover Dynamics in A Rainfed Watershed Using Remote Sensing and GIS. International Journal of Scientific & Engineering Research. 4(12); 87-93 (2013).
- Patil, R.J. and Sharma, S.K. Estimation of crop management factor (C) of Universal Soil Loss Equation for soil erosion modeling using RS and GIS techniques in Shakkar river watershed, Chhindwara, Madhya Pradesh, India. JNKVV Research Journal. 47(1); 111-115 (2013).
- Jensen, J.R. 2005. Introductory Digital Image Processing: A Remote Sensing Perspective Pearson Prentice Hall, New Jersey.
- Lillesand, T.M., Kiefer, R.W. and Chipman, J.W. 2004. Remote Sensing and Image Interpretation. 5th edition, New York: John Wiley and Sons, Inc.


