Statistical Models in Estimating Air Temperature in a Mountainous Region of Greece
Stelios Maniatis1
*
, Kostas Chronopoulos2
 , Aristidis Matsoukis1
and Athanasios Kamoutsis1
, Aristidis Matsoukis1
and Athanasios Kamoutsis1
1
Department of Crop Science,
Iera Odos 75,
Agricultural University of Athens,
Athens,
11855
Greece
2
Department of Biotechnology,
Iera Odos 75,
Agricultural University of Athens,
Athens,
11855
Greece
http://dx.doi.org/10.12944/CWE.12.3.07
Copy the following to cite this article:
Maniatis S, Chronopoulos K, Matsoukis A, Kamoutsis A. Statistical Models in Estimating Air Temperature in a Mountainous Region of Greece. Curr World Environ 2017;12(3). DOI:http://dx.doi.org/10.12944/CWE.12.3.07
Copy the following to cite this URL:
Maniatis S, Chronopoulos K, Matsoukis A, Kamoutsis A. Statistical Models in Estimating Air Temperature in a Mountainous Region of Greece. Curr World Environ 2017;12(3). Available from: http://www.cwejournal.org/?p=1062
Download article (pdf)
Citation Manager
Publish History
Introduction
Mountainous areas (MAs) provide major gathering grounds of water supplies for human and animal consumption as well as for hydroelectric power production and may also contain valuable mineral resources1. These areas may be considered as optimum recreation ones, offering visitors a wide variety of activities and being a favorite tourist destination2. Despite MAs importance and the fact that they account for 20% of the Earth’s land surface, their climatic and weather conditions haven’t been adequately explored1.
Air temperature (T) is the most important determinant of mountain climate1, 3 but, unfortunately, mountain T data is usually very difficult or impossible to obtain directly because of the small number of the existing meteorological stations (MS) covering MAs and MS insufficient spatial distribution4, especially in high altitudes (alts). Thus, many times, a necessity arises to estimate T data of high alts based on T data of lower alts.
In order to carry out the aforementioned estimation, a lot of researchers have developed a variety of techniques. Among them, the linear regression analysis has been used in a constructive way to extrapolate T in MAs5. Also, in recent years, artificial neural networks (ANNs), a new, relatively, computational method, have been applied to extrapolate T data in MA, contributing promising results6, 7.
Taking the aforementioned issues into account, the objective of our study is to estimate the T at high alt sites of mountain (Mt) Aenos in the island of Cephalonia, Greece based on T data of lower alt sites, by applying linear regression and ANNs models and investigating the hypothesis of their satisfactory performance. To our knowledge, this is the first time such a type of study takes place at this MA which is of utmost ecological importance.
Materials and Methods
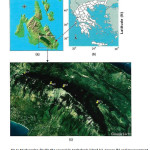
The study was conducted in the National Park of Mt Aenos located in the southeastern part of the Cephalonia island (Figure 1a), Greece (Figure 1b). Aenos is one of the most important ecological locations of the Ionian Islands in Western Greece with a maximum alt of about 1620 m. It hosts a wealthy flora, e.g. the well-known endemic plant species cephalonian fir (Abies cephalonica L.)8. It is also an attractive tourist destination because of the great variety of activities that offers, such as mountaineering, trekking and birdwatching.
Four sites were selected in the study region (Figure 1c). Their selection was based mainly on alt and orientation of the respective locations. Thus, there were two different orientations (northwest and southeast) with each of them to comprise two different alts (1100 and 1580 m). Specifically, the first site, W1 (38ο09´38.3´´N, 020ο37´25.0´´E, alt of 1100 m), was located in the northwestern side, characterized by dense and tall vegetation. The second site, E1 (38ο07´30.3´´N, 020ο42´14.6´´E, alt of 1100 m) was located in the southeastern side, characterized by the aforementioned vegetation. The third site, W2 (38ο08´27.7´´N, 020ο39´36.0´´E, alt of 1580 m) was located in the northwestern side, characterized by the existence of an open area which was much less forested. The fourth site, E2 (38ο08´16.2´´N, 020ο40´21.6´´E, alt of 1580 m), was located in the southeastern side, characterized by dense and tall vegetation. The orientation, alt., latitude and longitude of each site were evaluated using a mobile Global Positioning System (Garmin eTrex Vista) and cross-checked against 1:65000 topographic maps.
 |
|
Air temperature was monitored simultaneously every 10 min by sensors with the help of data microloggers (Hobo Pro v2 U23-001, Onset Computer Corporation, USA, accuracy ±2.0o for T over 0o to 50o) for the time period of one year (2012). These instruments were enclosed in appropriate shelters to protect them from direct radiation and precipitation and mounted under trees 1.5 m above the ground surface. The shape of the shelters allowed acceptable air ventilation. The above instruments were tested in the laboratory and in situ without appearing any problem. Data were collected every 3 months and mean, maximum and minimum T were calculated for each site on hourly basis and then on daily basis5.
In order to estimate the mean, maximum and minimum T of the high alt (1580 m) based on the respective T data of the lower alt (1100 m), for each orientation, the multi-layer perceptron (MLP) model10, one of the most commonly used ANNs, with one hidden layer6 as well as the simple linear regression (SLR) model were developed11.
The performance of both models (SLR and MLP) was evaluated by two statistical parameters, the coefficient of determination (R2) and the Mean Absolute Error (MAE). Moreover, the validation of the studied models was confirmed through the graphical analysis of the residuals by means of normal probability plots and scatterplots of residuals versus predictors. In the present study, it was assured that the results were significant at P≤0.0511,12.
Results and Discussion
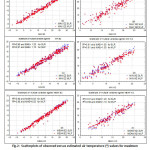
The estimation of T at the sites with the high alt (1580 m) based on T at the sites with the lower alt (1100 m) of Mt Aenos at both examined orientations (northwest and southeast), after the application of SLR and MLP models is shown in Figure 2. Based on the analysis of the scatter plots and the R2 values regarding E1 and E2 sites which were located in the southeastern side, it was demonstrated that both methods of analysis, SLR and MLP, provided very satisfactory results with regard to the estimation of mean, maximum and minimum T (Figure 2a, c and e).
Comparing the aforementioned graphs, it was clear that the mean T estimation was relatively better from the respective maximum and minimum T estimations. This finding was confirmed mainly by the appearance of the lowest MAE (0.83) in the case of the mean T estimation, in relation to the maximum and minimum T estimations. The satisfactory estimations which were achieved using the two aforementioned techniques (MLP and SLR) may be attributed to the fact that both E1 and E2 sites were characterized by similar surroundings. In other words, the domination of tall and dense vegetation in these sites impacted their T resulting in similar thermal differences, taking into account the effect of alt.
 |
|
On the contrary, the sites W1 and W2 in the northwestern side of Mt Aenos were located in areas with different plant cover. The W1 site was located under tall and dense vegetation, while W2 was located in a scarcely plant covered location. This fact resulted in the alteration of T differences between these two sites, in agreement with Ferrez et al13 and Maria Karlsson14, and this alteration had a serious impact on the different image of the respective scatter plots (Figure 2b, d and f) compared to those of Figure 2a, c and e. Specifically, the coefficients of determination R2 were lower and the MAE, in general, higher in northwest (Figure 2b, d and f) compared to southeast orientation (Figure 2a, c and e). Nevertheless, R2 values regarding W1 and W2 sites may be considered satisfactory (0.88-0.92), and, this, in combination with the respected MAE values (1.0-1.4), indicates that both the estimation methods (SLR and MLP) provide adequate results.
From an overall point of view, comparing scatter plots, R2 and the respected MAE of sites E1, E2 and W1, W2 (Figure 2a, b, c, d, e and f), it was demonstrated, in general, that the estimations of the mean T were better than those of the extreme ones (minimum and maximum T). This fact could be attributed, in a high degree, to the fundamental characteristic of the mean T to express average and more normalized thermal conditions, instead of maximum and minimum T which expresses instant thermal conditions15, leading thus to a more integrated view of the thermal environment.
In conclusion, it was confirmed that better results (higher R2 and lower, in general, MAE) were obtained when T estimations were based on T data derived from sites located at areas with similar surroundings, as in the case of dense and tall vegetation of E1 and E2 sites, irrespective of applied method (SLR and MLP). On the contrary, when the surroundings of the studied sites were different, as in the case of W1 (dense and tall vegetation) and W2 (sparsely forest covered site), the respective estimations were less accurate.
Conflict of Interest
The authors declare that there is no conflict of interest.
References
- Barry, R. G. Mountain Weather & Climate, 2nd edition, Routledge, Taylor & Francis Group, London, UK, 402 p (1992).
CrossRef - Nepal, K. S. and Chipeniuk, R. Mountain tourism: Toward a conceptual framework. Tourism Geographies, 7(3), 313-333 (2005).
CrossRef - Lookingbill, T. R. and Urban, D.L. Spatial estimation of air temperature differences for landscape-scale studies in montane environments. Agricultural and Forest Meteorology, 114(3-4), 141-151 (2003).
CrossRef - Running, S. W., Nemani, R. R. and Hungerford, R. D. Extrapolation of synoptic meteorological data in mountainous terrain and its use for simulating forest evapotranspiration and photosynthesis. Canadian Journal of Forest Research, 17(6), 472-483 (1987).
CrossRef - Maniatis, S., Kamoutsis, A., Chronopoulou-Sereli, A. and Nastos, P. T. Air temperature estimation over the Ainos mountain, Kefallinia island using linear regression analysis. In: Karacostas T. S. et al. eds, Perspectives on Atmospheric Sciences, Springer International Publishing, Switzerland, 349-354 (2017).
CrossRef - Kamoutsis, A. P., Matsoukis, A. S. and Chronopoulos, K. I. Air temperature estimation by using artificial neural network models in the greater Athens area, Greece. ISRN Meteorology: 1-7 (2013).
- Kisi, O. and Shiri, J. Prediction of long-term air temperature using geographical inputs. International Journal of Climatology, 34(1), 179-186 (2014).
CrossRef - Phitos, D. and Damboldt, J. The flora of Kefallinia island. Botanica Chronica, 5(1-2), 1-204 (1985).
- Anonymous. Google Earth, 2017. . Accessed 2017 Apr 27.
- Chronopoulos, K. I., Kamoutsis, A. P. and Matsoukis, A. S. Thermal comfort estimation in relation to different orientation in mountainous regions in Greece by using artificial neural networks. Global Nest Journal, 14(4), 532-539 (2012).
- Matsoukis, A. and Chronopoulos, K. Estimating inside air temperature of a glasshouse using statistical models. Current World Environment, 12(1), 01-05 (2017).
- Matsoukis A., Gasparatos D. and Chronopoulou-Sereli A. Impact of shading and chlormequat chloride on Lantana specific leaf area and mineral content. The Journal of Animal & Plant Sciences, 25(5), 1371-1376 (2015).
- Ferrez J., Davison A.C. and Rebetez M. Extreme temperature analysis under forest cover compared to an open field. Agricultural and Forest Meteorology, 151, 992-1001 (2011).
CrossRef - Maria Karlsson I. Nocturnal Air Temperature Variations between Forest and Open Areas. Journal of Applied Meteorology, 39, 851-862 (2000).
CrossRef - Matsoukis, A., Kamoutsis, A. and Chronopoulou-Sereli, A. Meteorological conditions and growth of lantana (Lantana camara L.) after treatments with ‘onium-type’ growth regulators. In: Chronopoulou-Sereli A., ed., Proceedings of 8th Conference on Meteorology-Climatology-Atmospheric Physics Volume A., GDI Studio, Piraeus, Greece, 370-376 (2008).


