Soil Nutrient Evaluation and Crop Management for Sustainable Growth of PatiyaVillage Cluster in Almora, Uttarakhand
Prabhas Kumar Pande1
*
 , Rakesh Kumar2
, Seema Gupta3
, Rajesh Sachdev3
, Mukta Datta Mazumder3
and Loveleen Satapathy4
, Rakesh Kumar2
, Seema Gupta3
, Rajesh Sachdev3
, Mukta Datta Mazumder3
and Loveleen Satapathy4
http://dx.doi.org/10.12944/CWE.16.3.14
Copy the following to cite this article:
Pande P. K, Kumar R, Gupta S, Sachdev R, Mazumder M. D, Satapathy L. Soil Nutrient Evaluation and Crop Management for Sustainable Growth of PatiyaVillage Cluster in Almora, Uttarakhand. Mouth. Curr World Environ 2021;16(3). DOI:http://dx.doi.org/10.12944/CWE.16.3.14
Copy the following to cite this URL:
Pande P. K, Kumar R, Gupta S, Sachdev R, Mazumder M. D, Satapathy L. Soil Nutrient Evaluation and Crop Management for Sustainable Growth of PatiyaVillage Cluster in Almora, Uttarakhand. Mouth. Curr World Environ 2021;16(3). Available From:
Download article (pdf)
Citation Manager
Publish History

Introduction
The mountainous regions have a wide range of macro and micro climate due to a great influence on soil genesis processes and vegetation1. The genesis and characteristics of soils derived from various metamorphic rocks in Kumaon Himalayas were studied, and the soils were classified under three soil orders viz. Entisols, Inceptisols, and Alfisols1,2.
The study area, falling in the Almora District, Uttarakhand (India), covering nearly 25 km2 of geographical area, lying between an elevation of 1300 m to 1550 m above MSL, is located between the latitude of 29º38’N to 29º42’N and longitude of 79º.38’E to 79º.43’E.The temperature range was found to be between 31.3ºC and 3.43ºC. The average annual rainfall in the region is around 1013.9 mm, mainly confining to the rainy season. Agriculture was one of the major occupations of the hill people because of the presence of various agro-climate zones along the altitudinal gradient. In the past few decades, it has been greatly affected due to the harsh climatic conditions resulting in un-predictable rains and drying natural run-offs. The presence of a large number of fallow lands indicates that villagers are no more interested in this occupation; whatever little agricultural activities that have been seen are done as customary in a traditional way only, which is not enough to support livelihood. The present study relates to assessment of the macro- and micro-nutrient present in soils to understand soil fertility and recommend fertilizers for optimum growth of the indigenous crops. Fallow lands measuring approximately 10 acres have been identified in four villages, namely, Kasoon, Bhatgaon, Patiya and Kotyura (Figure 1), for solar fencing to mitigate Human Wildlife Conflict and rejuvenate agricultural operations in the region.
 |
Figure 1: Study Area Map Showing Four Villages (1- Patiya; 2- Bhatgaon; 3- Kotyura; 4- Kasoon) Selected for Soil Analysis. Click here to view Figure |
Materials and Methods
Soil, a mixture of minerals and organic materials essential for plant life, contains 15 out of the 18 elements vital for plant growth3,4,5,6. The essential elements used by the plants in large quantities (primary and secondary macronutrients) and in small quantities (micronutrients) are responsible for plant growth is supplied by soil only6.The determining factor in the crop yield happens to be the essential nutrients in the soil and its ability to sustain agricultural growth7.The evaluation of soil quality is important to determine the fertilizer recommendation to increase crop health and maximize yield and in turn help farmers to effectively manage their agricultural practices8,9.
Besides physico-chemical and biological conditions in the rhizosphere the nutrient uptake by plants is also dependent upon pH, available nutrients, organic matter content, and adsorptive surfaces7,10,4. Hence, the study of the available pool of nutrients and their balance in the soil along with the evaluation of fertility status of the soils is foremost to understand soil health and plant-soil nutrient relationship for sustainable agriculture production10.
Collection and Preparation of Samples
A total of 26 representative soil samples, from a depth of 0-20 cm were collected using a hand-held soil auger of 1inch core diameter and 10-inch length. Soil samples were air-dried in shade, discarding plant residues, gravels, and other materials. These were then pulverized and sieved to obtain 2 mm size fraction for chemical analysis and the samples were stored in airtight containers for further examination.
Sample Soil Analysis
The soil samples were examined for pH, EC, Organic-C, available-N, -P, -K, -S, -B, -Mn, 0.1M HCl, and DTPA extractable-Fe, -Zn, and -Cu. The analysis was carried out using PUSA (STFR) soil Meter Kit, recommended by ICAR which analyzes soil parameters quantitatively and gives crop-specific fertilizer recommendation including field crops, horticultural crops, and spices.
Categorization of Soil Nutrient Status
Categorization of soil nutrients, pH, and EC has been done based on the values provided along with the instrument. Figure 2 shows the ranges of the soil nutrients, pH, and EC value categorization based on STFR standards. Based on these values, the various nutrients were classified into Low-Medium-High, Sufficient-Deficient, and subsequent fertilizers were recommended for the soils.
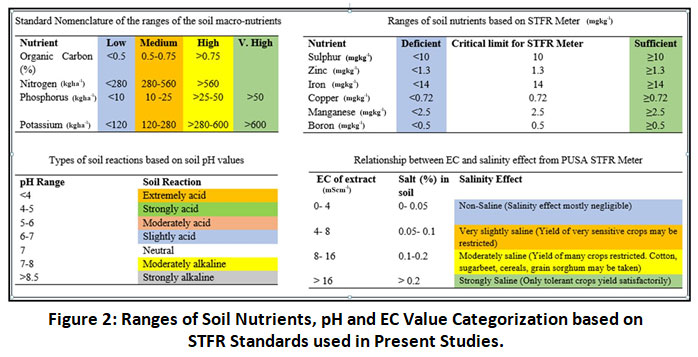 |
Figure 2: Ranges of Soil Nutrients, pH and EC Value Categorization based on STFR Standards used in Present Studies. Click here to view Figure |
Nutrient Indices (NI)
The nutrients present in the soil were calculated for their index values on the basis of the formula suggested by Parker et al.11wherein indices were classified as low (<1.67), medium (1.67-2.33), and high (>2.33)4.
Where,
Nt = the Total number of samples analyzed for a nutrient in any given area.
Nl = number of samples falling in low category of nutrient status.
Nm = number of samples falling in medium category of nutrient status.
Nh = number of samples falling in high category of nutrient status.
Nutrient supplying capacity of soil to plants is measured by Nutrient Index and comparative analysis of the soil fertility of an area is carried out using a single value for each nutrient12,13.
Results and Discussion
Physico-Chemical Properties of Soil
The soil of the study region has good natural drainage with mean thickness ranging between 0.1 to 0.5 m) and colour varying from light to moderately dark showing varying physico-chemical properties.
Textural classification of soil14 revealed the dominance of silty to sandy loam type of soil in the study region. Bhatgaon, Kotyura, and Kasoon exhibit Loam, Sandy loam (+Organic Content), and Sandy loam texture, respectively. Patiya has been further divided into four regions, namely, Samdeo-Nigad,Tanala, Aegra, and Samdeo, based on varying altitude and terrain, the textural class of these soils varied from silty loam, loam, sandy loam (+ organic content) &sandy loam in these four regions, respectively.
pH, EC, and OC%
Table 1(Appendix I) elaborates the physico-chemical properties of each of the collected soil samples and its classification. Figure 3, 4, and 5 represent the graphical comparison of these physico-chemical properties of the collected samples soil samples.
Based on the values obtained from PUSA STFR Meter Kit, the pH of soil samples from Patiya displayed variance from 6.34 to 6.98 having a mean value of 6.6 (slightly acidic). The soils of Samdeo-Nigad, Tanala, Aegra, and Samdeo have 6.61, 6.475, 6.4625, and 6.735 mean pH values respectively. The pH of soil samples has a mean value of 5.4 (moderately acidic) in Bhatgaon, 5.9 (moderately acidic) in Kotyura, and 3.7 (extremely acidic) in Kasoon (Figure 3).
 |
Figure 3: pH Values of the Collected 26 Samples. Click here to view Figure |
The EC of soil samples from Patiya shows a wide range that varies from 0.078 mScm-1 to 7.375 mScm-1. The soils of Samdeo-Nigad, Tanala, Aegra and Samdeo have 7.37 mScm-1 (slightly saline), 4.93 mScm-1 (slightly saline), 2.63 mScm-1 (non-saline) and 0.086 mScm-1 (non-saline) mean EC values, respectively. The average EC values of soil samples are 1.01325 mScm-1(non-saline) in Bhatgaon, 1.14825 mScm-1 (non-saline) in Kotyura, and 1.1865 mScm-1 (non-saline) in Kasoon. Electrical Conductivity analysis shows that the study area has low salinity on average (Figure 4).
 |
Figure 4: EC (mScm-1) Values of the Collected 26 Samples. Click here to view Figure |
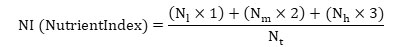
The organic-Ccontent in the soils of Patiya ranges between 0.1239-0.7592% with an average value of 0.353%. The soils of Samdeo-Nigad, Tanala, Aegra and Samdeo have 0.3687% (low), 0.3845% (low), 0.3157% (low) and 0.3621% (low) mean OC% content respectively. This content has a mean value of 0.298% (low) in Bhatgaon, 0.5113% (medium) in Kotyura, and 0.3993% (low) in Kasoon (Figure 5).
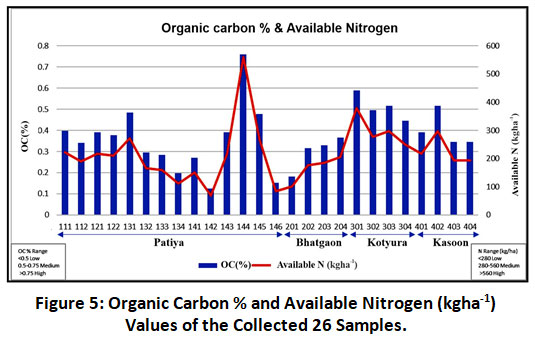 |
Figure 5: Organic Carbon % and Available Nitrogen (kgha-1) Values of the Collected 26 Samples. Click here to view Figure |
Available Nutrients (Primary and Secondary)
The available primary nutrients (N, P, and K) and secondary nutrient (S) in the soil, as obtained from the PUSA STFR Meter Kit, have been tabulated in Table 2, along with their classification. Figure 6, 7, and 8 show the graphical comparison of P, K, and S content of the collected soil samples respectively. The fertilizers for these major macronutrients such as N-P-K are crop recommended. Table 2 (Appendix I) also summarizes the crop RDF to be applied based on the obtained category of these nutrients15.
Available-N (Figure 5) of soil samples from Patiya has a mean value of 206.928 kgha-1 (low). The soils of Samdeo-Nigad, Tanala, Aegra, and Samdeo have 206 kgha-1 (low), 214.5 kgha-1(low), 176.75 kgha-1 (low) and 224.833 kgha-1 (low) mean available N values, respectively. The average available-N value of soil samples is 166.5 kgha-1(low) in Bhatgaon, 300.75 kgha-1 (medium) in Kotyura and 225.25 kgha-1 (low) in Kasoon.
Phosphorus level has an average value of 47.45 kgha-1 (high) in Patiya; 3.275 kgha-1 (low) in Bhatgaon; 86.075 kgha-1 (very high) in Kotyura; and 6.3 kgha-1 (low) in Kasoon (Figure 6).
 |
Figure 6: Phosphorus (kgha-1) Values of the Collected 26 Samples. Click here to view Figure |
Potassium level has an average value of 45.2714 kgha-1 (low) in Patiya; 32.75 kgha-1 (low) in Bhatgaon; 150.65 kgha-1 (medium) in Kotyura; and 36.4 kgha-1 (low) in Kasoon (Figure 7).
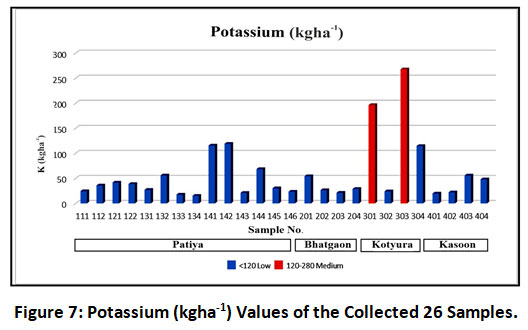 |
Figure 7: Potassium (kgha-1) Values of the Collected 26 Samples. Click here to view Figure |
Sulfur content in the all the soil samples were found to be sufficient. It has a mean value of 48.29 mgkg-1 (sufficient) in Patiya; 72.9 mgkg-1 (sufficient) in Bhatgaon; 94.025 mgkg-1(sufficient) in Kotyura and 42 mgkg-1(sufficient) in Kasoon (Figure 8).
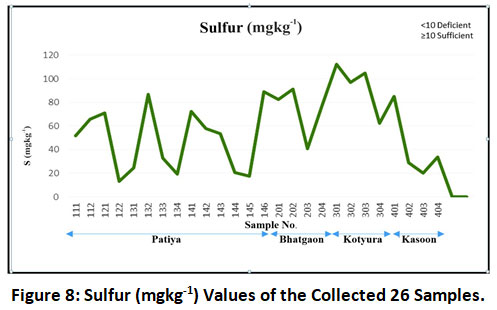 |
Figure 8: Sulfur (mgkg-1) Values of the Collected 26 Samples. Click here to view Figure |
Available Micronutrients
Table 3 (Appendix I) tabulates the micronutrients along with their category and the recommended dose of fertilizer for the deficiency of these micronutrients by the STFR Meter and Figure 9 shows the trend of these micronutrients in the study region. The STFR Meter Kit recommends the dose of fertilizer for these micronutrients directly based on their obtained values and category.
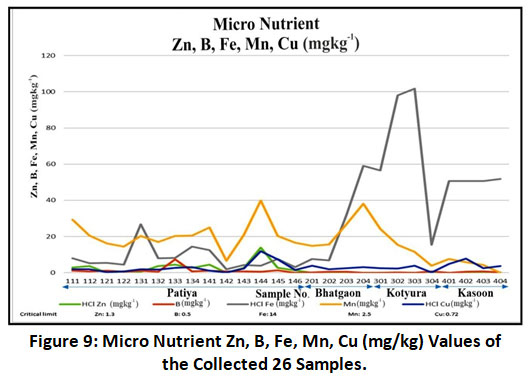 |
Figure 9: Micro Nutrient Zn, B, Fe, Mn, Cu (mg/kg) Values of the Collected 26 Samples. Click here to view Figure |
HCl and DTPA Zn content were found to have a mean value of 3.25 mgkg-1 and 1.5 mgkg-1 respectively in Samdeo-Nigad (sufficient); 0.35 mgkg-1 and 0.15 mgkg-1 respectively in Tanala (deficient); 2.825 mgkg-1and 1.275 mgkg-1 respectively in Aegra (sufficient); and 4.1667 mgkg-1 and 1.9 mgkg-1 respectively in Samdeo (sufficient) in Patiya; and 0 mg/kg in Bhatgaon, Kotyura and Kasoon (deficient). The STFR Meter recommended the 10 kgha-1 ZnSO4 for the deficient soils.
Boron content was found to have a mean value of 1.2124 mgkg-1 (sufficient) in Patiya; 0.2455 mgkg-1 (deficient) in Bhatgaon; 0.21175 mgkg-1 (deficient) in Kotyura; and 0.2985 mgkg-1 (deficient) in Kasoon. Further, the STFR Meter recommended the 4 kgac-1 Borax for deficient soils.
HCl and DTPA Fe content were found to be deficient in Patiya (mean value of 8.111 mgkg-1and 2.6043 mgkg-1 respectively); sufficient in Bhatgaon (mean value of 26.3725 mgkg-1and 8.475 mgkg-1 respectively); sufficient in Kotyura (mean value of 67.975 mgkg-1and 21.805 mgkg-1 respectively); and sufficient in Kasoon (mean value of 50.9225 mgkg-1and 16.36 mgkg-1 respectively). The STFR Meter recommended the 40 kgac-1 FeSO4 for the deficient soils of Patiya.
Mn content in all the soil samples was found to be sufficient except for one sample from Kasoon. The Mn content has an average value of 20.573 mgkg-1 (sufficient) in Patiya, 23.8375 mgkg-1 (sufficient) in Bhatgaon; 13.749 mgkg-1 (sufficient) in Kotyura; and 4.47 mgkg-1(sufficient) in Kasoon.
HCl and DTPA Cu content were found to have a mean value of 1.84 mgkg-1 and 0.51 mgkg-1 respectively in Samdeo-Nigad (sufficient); 0.56 mgkg-1 and 0.175 mgkg-1 respectively in Tanala (deficient); 2.335 mgkg-1 and 0.645 mgkg-1 respectively in Aegra (sufficient); and 4.0233 mgkg-1 and 1.11333 mgkg-1respectively in Samdeo (sufficient) in Patiya; 2.825 mgkg-1 and 0.781 mgkg-1 respectively in Bhatgaon (sufficient); 2.2 mgkg-1 and 0.61 mgkg-1 respectively in Kotyura (sufficient); and of 4.7125 mgkg-1 and 1.285 mgkg-1 respectively in Kasoon (sufficient). The STFR Meter recommended the 4 kgac-1 CuSO4 for the deficient soils of Tanala in Patiya.
Nutrient Index
To examine fertility of the region and nutrient supplying capacity of these soils to plants, Nutrient Index (NI) was calculated.
For calculation, in the case of primary nutrients, samples of high and very high categories have been placed in “High” class of nutrient status. Following the same methodology, in case of S and micronutrients, “Deficient” samples have been placed in “Low” and “Sufficient” samples have been placed in “Medium” class of nutrient status.
The nutrient indices and the categories are tabulated in Table 4 (Appendix I).
The soils of Patiya show low N, P, K, and Fe fertility, and medium S, Zn, B, Mn, and Cu fertility. Bhatgaon soil has low NI and fertility of N, P, K, Zn, B, and Fe, and medium NI and fertility of S, Mn, and Cu.
The soil of Kotyura has low N, K, Zn, and B fertility, medium S, Fe, Mn, and Cu fertility, and high P fertility, whereas the soil of Kasoon has low N, P, K, Zn, B fertility, and medium S, Fe, Mn, and Cu fertility.
On average, the study area shows the medium category of NI values for S, Mn, and Cu in all the locations, indicating sufficient fertility of these nutrients for plant growth.
Fertility status as revealed by Nutrient Index is very significant in selecting the biofertilizers as the region is applying traditional organic manure16. Biofertilizers are comprised of living microbial cells and promote plant growth by increasing nutrient availability and acquisition17and play an important role in functioning of ecosystem by facilitating many biogeochemical cycles and organic matter degradation18. Sustainable agriculture which has a long-term effect on soil fertility of this region can be achieved by the application of biofertilizers19,20,21.
Conclusion
The overall fertility status of the soil of the region is low of N, P, K, Zn, B, and Fe; and medium of S, Mn, and Cu. These are indicative of a requirement for additional farmyard manure (FYM) and fertilizers to make them suitable for the cultivation of crops. Since the agricultural system in the region is largely organic, the use of bio-fertilizers such as Nitrogen and Phosphorus bio-fertilizer is recommended.
Further, high yield indigenous cash crops suited for the region along with their ecological and nutrient requirements were studied in detail from various digital platforms22-33 run by the government and non-government agencies, and the outcome was categorically tabulated in Table 5 s(Appendix II). The tabulated data displays that the lands of Patiya such as Samdeo-Nigad and Samdeo are more suited for fruit trees such as Pear, Guava, Mango, Litchi, etc., and Bhatgaon and Kotyura are more suited for pulses such as Horse gram, Black gram, Lentil, etc. It also reveals that Soyabean and Black Soyabean is well suited to the type of soil and irrigation facilities available in the study region. Hence, it was recommended to sow Yellow Soyabean in Patiya and Kasoon; Black Soyabean (Kala Bhat) in Kotyura; and Pigeon Pea (Arhar) in Bhatgaon for the current season (June-July 2020). Table 6 (Appendix II) presents the manure, nutrient, and fertilizer requirements of these Kharif crops to be used as a reference to maximize the use and production from these fallow lands and enhance the agricultural activities in the region, and provide better livelihood options. Based on the above outcome four self-help groups were created and villagers with identified lands were motivated for deep plowing of the land with handheld scooter tractor and crops of beans and peas were selected for sowing of seeds with line-makers to maintain essential distance between them. This resulted in an encouraging yield convincing farmers that crop can have a substantial impact on their income which led to an enthusiasm in all villages to adapt cooperative farming as per the suggestions utilizing (Figure 10)
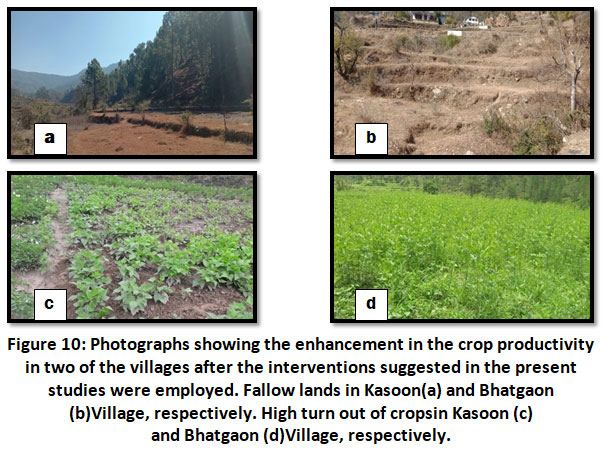 |
Figure 10: Photographs showing the enhancement in the crop productivity in two of the villages after the interventions suggested in the present studies were employed. Click here to view Figure |
Acknowledgments
The authors are thankful to NMHS (under Ministry of Environment, Forest and CC) for funding the project (GBPNI/NMHS-2019-20/MG59-01/07.02e1 dated 02/07/2019) under which the present research work was carried out. We are immensely grateful to the residents of Patiya and surrounding villages for providing access to their lands for conducting the study. We would also like to show our gratitude to the field attendants and support staff for their assistance.
Funding Source
National Mission on Himalayan Studies (NMHS) [Ministry of Environment, Forest and Climate Change] Grant No.: GBPNI/NMHS-2019-20/MG59-01/07.02e1 dated 02/07/2019.
References
- Mhalla, B., Ahmed, N., Datta, S., Singh, M., Shrivastava, M., Mahapatra, S, Moursy, A. Role of Topography on Characteristics, Fertility Status and Classification of the Soils of Almora District in Uttarakhand. Journal of the Indian Society of Soil Science. 2019;67:309-320. 10.5958/0974-0228.2019.00034.3.
CrossRef - Surya, J.N., Walia, C.S., Ahmad, N., Singh, H., Goyal, V., Khajuria, V. Characterization and clay minerals composition of soils derived from metamorphic formation of Kumaon Himalayas. Clay Research.2015;34(1):15-24.
- Brady, N.C., Weil, R.R.The Nature and Properties of Soils, 13th Ed. Prentice- Hall Inc., New Jersey, USA. 2002.
- Yurembum, G.S., Chandra, H., Kumar, V. Status of Available Macro and Micronutrients in the soils of Someshwar Watershed in Almora District of Uttarakhand. The Ecoscan. 2015;9:725-730.
- Maurya, B., Singh, Vimal, Dhyani, P., Kashyap, S. Impact of Altitudes on Soil Characteristics and Enzymatic Activities in Forest and Fallow Lands of Almora District of Central Himalaya. Octa Journal of Environmental Research. 2014;2:1-9.
- NRCCA. Basic Concepts of Plant Nutrition. NRCCA Study Resources- Cornell University. 2010; Retrieved from https://nrcca.cals.cornell.edu/soilFertilityCA/CA1/CA1_print.html.
- Athokpam, H., Wani, H. S., Kamei, D., Athokpam, S. H., Nongmaithem, J., Kumar, D., Singh, Y. K., Naorem, B. S., Devi, T. R, Devi, L. 2013. Soil macro-and micro-nutrient status of Senapati district, Manipur (India). African J. Agricultural Research. 2013;8(39):4932-4936.
- Subash, T., Vincent, P., Karuppasamy, S., Kushnappa, K. Analysis of Nutrient Index of Soil for Green Environment. Asian Journal of Chemistry.2020;29: 2311-2315.
CrossRef - Doran, J.W. and T.B. Parkin. 1994. Defining and Assessing Soil Quality. Soil Sci. Soc. Amer. Madison, Wisconsin. 1994;1-21.
CrossRef - Nigam, G., Pandey, V.K., Tripathi, M. P., Sinha, J. Assessment of macro and micronutrients of soil in a small agricultural watershed. International Journal of ChemTech Research. 2014; 6:3658-3664.
- Parker, F. W., Nelson, W. L., Winter, E., Miller, I. E. The broad interpretation of soil test information. Agronomy Journal. 1951;43:105-112.
CrossRef - Singh, G., Sharma, M., Manan, J., Singh, G. Assessment of soil fertility status under different cropping sequences in District Kapurthala. J Krishi vigyan. 2016;5(1):1-9. http://dx.doi.org/10.5958/2349-4433.2016.00023.4.
CrossRef - EnviStats India.Soil Nutrient Indices. EnviStats India 2019, Volume – II Environment Accounts, Ministry of Statistics and Programme Implementation. New Delhi. Retrieved from http://www.mospi.gov.in/sites/default/files/reports_and_publication/statistical_publication/EnviStats/b14_Chapter%202.pdf.
- Thien, S. J. A flow texture by feel analysis. Journal of Agronomic Education. 1979; 8:54-55.
CrossRef - WS Telematics. PUSA STFR Meter: User Manual, Delhi diagram for teaching. WS Telematics Pvt. Ltd.2018.
- Sneha, S., Anitha, B., Anjum Sahair R., Raghu N., GopenathT.S., Chandrashekrappa G.K., Kanthesh M Basalingappa. Biofertilizer for crop production and soil fertility. Academia Journal of Agricultural Research. 2018;6:299-306.
- Riaz, U., Mehdi, S. M., Iqbal, S., Khalid, H. I., Qadir, A. A., Anum, W., et al. Ahmad, M., Murtaza, G.Bio-fertilizers: eco-friendly approach for plant and soil environment, In: Bioremediation and Biotechnology: Sustainable Approaches to Pollution Degradation, eds K. R. Hakeem, R. A. Bhat, and H. Qadri (Cham: Springer). 2020;188–214. doi: 10.1007/978-3-030-35691-0_8.
CrossRef - Paul, E. A. Soil Microbiology, Ecology and Biochemistry. London: Elsevier. 2015. doi: 10.1016/C2011-0-05497-2.
CrossRef - Bargaz, A., Lyamlouli, K., Chtouki, M., Zeroual, Y., and Dhiba, D. (2018). Soil microbial resources for improving fertilizers efficiency in an integrated plant nutrient management system. Frontiers in Microbiology.2018; 9:1606. doi: 10.3389/fmicb.2018; 01606.
CrossRef - Singh, M., Singh, D., Gupta, A., Pandey, K. D., Singh, P. K., and Kumar, A. Plant growth-promoting rhizobacteria, In PGPR Amelioration in Sustainable Agriculture, eds A. K. Singh, A. Kumar, and P. K. Singh (Cambridge, MA: Elsevier). 2019; 41–66. doi: 10.1016/B978-0-12-815879-1.00003-3.
CrossRef - Mitter, E. K., Tosi, M., Obregón, D, Dunfield, K. E., Germida, J. J. Rethinking Crop Nutrition in Times of Modern Microbiology: Innovative Biofertilizer Technologies. Frontiers in Sustainable Food System.2021; 5:606815. doi: 10.3389/fsufs.2021;606815.
CrossRef - Agropedia. 2009. Nutrient management in Litchi. Agropedia. Retrieved fromhttp://agropedia.iitk.ac.in/content/nutrient-management-litchi#:~:text=1%2F3%20dose%20of%20nitrogen,main%20trunk%20of%20the%20tree.
- TNAU. 2015. Fertilizer Schedule for Fruit Crops. TNAU AgritechPortal. Retrived from: http://agritech.tnau.ac.in/horticulture/FERTILIZER%20SCHEDULE%20FOR%20FRUIT%20CROPS.pdf.
- TNAU. 2016. Nutrient Management: Sesame. TNAU Agritech Portal. Retrieved from http://agritech.tnau.ac.in/agriculture/agri_nutrientmgt_sesame.html.
- Directorate of Millets Development. Department of Agriculture, Co-operation & Farmers Welfare, Ministry of Agriculture & Farmers Welfare, Government of India. 2016 Retrieved from http://millets.dacfw.nic.in/
- National Horticulture Board. 2019. Guava- Manuring & Fertilization. National Horticulture Board, Ministry of Agriculture and Farmers Welfare, Government of India. http://nhb.gov.in/pdf/fruits/guava/gua006.pdf.
- Vikaspedia. 2020. Vikaspedia, India Development Gateway (In DG) initiative, Centre for Development of Advanced Computing (C-DAC)https://vikaspedia.in/InDG.
- ApniKheti. Digital platform for farmers and agri industry.https://www.apnikheti.com/
- IndiaAgroNet.Com. https://www.indiaagronet.com/
- Kisan Suvidha. https://www.kisansuvidha.com/
- Krishi Vigyan Kendra Almora. http://almora.kvk4.in/district-profile.html
- Krishi Vigyan Kendra Imphal. Tips for Lentil Cultivation. Krishi Vigyan Kendra, Imphal West, ICAR Research Complex for NEH Region https://kvk.icar.gov.in/API/Content/Ppupload/k0196_58.pdf.
- Horse gram farming information guide.https://www.agrifarming.in/horse-gram-farming/
APPENDIX I:
Table 1: Soil Properties- Physical and Chemical.
|
Village Name |
Sample Code |
Soil Type |
pH |
Soil Reaction |
EC |
Salinity Effect |
OC (%)& |
|
Patiya
Samdeo |
111 |
silty loam |
6.44 |
slightly acidic |
7.375 |
slightly saline |
0.3966 (L) |
|
112 |
6.78 |
slightly acidic |
7.37 |
slightly saline |
0.3408(L) |
||
|
121 |
loam |
6.61 |
slightly acidic |
4.752 |
slightly saline |
0.391(L) |
|
|
122 |
6.34 |
slightly acidic |
5.113 |
slightly saline |
0.3781(L) |
||
|
131 |
sandy loam (OC+) |
6.35 |
slightly acidic |
5.72 |
slightly saline |
0.4841(L) |
|
|
132 |
6.38 |
slightly acidic |
4.458 |
slightly saline |
0.2964(L) |
||
|
133 |
6.58 |
slightly acidic |
0.165 |
non-saline |
0.284(L) |
||
|
134 |
6.54 |
slightly acidic |
0.161 |
non-saline |
0.1983(L) |
||
|
141 |
sandy loam (OC+) |
6.69 |
slightly acidic |
0.078 |
non-saline |
0.2697(L) |
|
|
142 |
6.96 |
slightly acidic |
0.086 |
non-saline |
0.1239 (L) |
||
|
143 |
6.75 |
slightly acidic |
0.089 |
non-saline |
0.3902 (L) |
||
|
144 |
6.75 |
slightly acidic |
0.104 |
non-saline |
0.7592 (H) |
||
|
145 |
6.52 |
slightly acidic |
0.078 |
non-saline |
0.4765 (L) |
||
|
146 |
6.74 |
slightly acidic |
0.083 |
non-saline |
0.153 (L) |
||
|
Bhatgaon |
201 |
loam |
6.99 |
slightly acidic |
0.09 |
non-saline |
0.1814 (L) |
|
202 |
6.5 |
slightly acidic |
0.076 |
non-saline |
0.3153 (L) |
||
|
203 |
4.07 |
strongly acidic |
1.849 |
non-saline |
0.3291 (L) |
||
|
204 |
3.95 |
strongly acidic |
2.038 |
non-saline |
0.3662 (L) |
||
|
Kotyura |
301 |
sandy loam (OC+) |
6.74 |
slightly acidic |
1.321 |
non-saline |
0.5895(M) |
|
302 |
6.78 |
slightly acidic |
1.07 |
non-saline |
0.4951 (L) |
||
|
303 |
6.84 |
slightly acidic |
1.181 |
non-saline |
0.516 (M) |
||
|
304 |
3.38 |
strongly acidic |
1.021 |
non-saline |
0.4447 (L) |
||
|
Kasoon |
401 |
sandy loam |
3.26 |
strongly acidic |
1.013 |
non-saline |
0.3899 (L) |
|
402 |
4.14 |
strongly acidic |
1.165 |
non-saline |
0.5154(M) |
||
|
403 |
4.37 |
strongly acidic |
1.215 |
non-saline |
0.3458 (L) |
||
|
404 |
3.05 |
strongly acidic |
1.353 |
non-saline |
0.3462 (L) |
Table 2: Available Primary (N, P, K) and Secondary (S)Nutrient in the Soil and Crop RDF to be Applied based on Category of N-P-K.
|
Village Name |
Sample Code |
N(kgha-1) & |
P (kgha-1)& |
K (kgha-1) & |
S(mgkg-1) & |
|
(L)- Low, (M)- Medium, (H)- High, (VH)- Very High |
|||||
|
Patiya Aegra
Samdeo |
111 |
222 (L) |
2.5 (L) |
24.5 (L) |
51.7 (S) |
|
112 |
190 (L) |
7.6 (L) |
35.8 (L) |
66 (S) |
|
|
121 |
218 (L) |
9.7l (L) |
41.6 (L) |
71.2 (S) |
|
|
122 |
211 (L) |
9.2 (L) |
38.7 (L) |
13 (S) |
|
|
131 |
271 (L) |
3.5 (L) |
27 (L) |
24.6 (S) |
|
|
132 |
166 (L) |
12.1 (M) |
55.8 (L) |
86.8(S) |
|
|
133 |
159 (L) |
0 (L) |
17.6 (L) |
33(S) |
|
|
134 |
111(L) |
0 (L) |
15.1(L) |
19.2(S) |
|
|
141 |
151 (L) |
145.9 (VH) |
115.5 (L) |
72.3(S) |
|
|
142 |
69 (L) |
453.3 (VH) |
119.1 (L) |
57.9(S) |
|
|
143 |
218 (L) |
0.9 (L) |
21(L) |
53.4(S) |
|
|
144 |
560 (H) |
19.6 (M) |
68.5(L) |
20.4(S) |
|
|
145 |
266(L) |
0(L) |
30.2(L) |
17.6(S) |
|
|
146 |
85(L) |
0(L) |
23.4(L) |
89(S) |
|
|
Bhatgaon |
201 |
101(L) |
13.1 (M) |
54.4(L) |
82.4(S) |
|
202 |
176(L) |
0 (L) |
26.5 (L) |
91.2 (S) |
|
|
203 |
184 (L) |
0 (L) |
21.2(L) |
41 (S) |
|
|
204 |
205 (L) |
0 (L) |
28.9(L) |
77 (S) |
|
|
Kotyura |
301 |
380 (M) |
25.6 (H) |
196.3 (M) |
112.1(S) |
|
302 |
277 (L) |
0(L) |
24.1 (L) |
96.8 (S) |
|
|
303 |
297 (M) |
37.4 (H) |
267.7 (M) |
104.9(S) |
|
|
304 |
249 (L) |
281.3 (VH) |
114.5 (L) |
62.3 (S) |
|
|
Kasoon |
401 |
218 (L) |
0(L) |
19.8 (L) |
85.1 (S) |
|
402 |
297 (M) |
2.4 (L) |
22 (L) |
29 (S) |
|
|
403 |
193 (L) |
11.7 (M) |
55.7 (L) |
20.2(S) |
|
|
404 |
193 (L) |
11.1 (M) |
48.1 (L) |
33.7(S) |
|
|
Crop RDF to be applied as per Category of N-P-K |
|||||
|
Low category- 25% more than crop RDF, Medium category- Exact crop RDF, High Category- 25% less than crop RDF, Very High category- No fertilizer of that nutrient |
|||||
Table 3: Micronutrient (Zn, B, Fe, Mn, and Cu) values of soil by the STFR Meter and the recommended dose of fertilizer for the deficiency.
|
Village Name |
Sample No. |
Zn (mgkg-1) HCl /DTPA (Category) |
B(mgkg-1) (Category) |
Fe (mgkg-1) HCl/DTPA (Category) |
Mn(mgkg-1) (Category) |
Cu (mgkg-1) HCl/DTPA (Category) |
|
(S)- Sufficient (D)- Deficient |
||||||
|
Patiya
Aegra
Samdeo |
111 |
2.8/1.3 (S) |
1.035 (S) |
7.9/2.54(D) |
29.31 (S) |
1.84/0.51 (S) |
|
112 |
3.7/1.7 (S) |
0.648(S) |
5.26/1.69(D) |
20.56 (S) |
1.84/0.51 (S) |
|
|
121 |
0/ 0 (D) |
1.087(S) |
5.48/1.76(D) |
16.23 (S) |
0.39/ 0.1 (D) |
|
|
122 |
0.7/0.3 (D) |
0.463 (D) |
4.5/1.44 (D) |
14.43 (S) |
0.73/0.25(S) |
|
|
131 |
0.5/0.2 (D) |
1.06 (S) |
26.74/8.59 (S) |
20.3 (S) |
1.84/0.51(S) |
|
|
132 |
3.7/1.7(S) |
0.465 (D) |
7.87/2.52 (D) |
17.04(S) |
1.7/0.47(S) |
|
|
133 |
4.4/2(S) |
7.343(S) |
8.18/2.63 (D) |
20.33(S) |
2.64/0.73(S) |
|
|
134 |
2.7/1.2(S) |
0.692(S) |
14.49/4.65 (S) |
20.56(S) |
3.16/0.87(S) |
|
|
141 |
4.4/2(S) |
1.067(S) |
12.48/4.01(D) |
25.08(S) |
1.05/0.29(S) |
|
|
142 |
0/0 (D) |
0.645(S) |
1.86/0.6(D) |
6.68(S) |
0.04/0.01(D) |
|
|
143 |
2.7/1.2(S) |
0.765(S) |
4.32/1.39(D) |
20.8(S) |
2.25/0.62 (S) |
|
|
144 |
13.9/6.4(S) |
0.461 (D) |
3.81/1.22(D) |
39.83(S) |
11.9/3.31(S) |
|
|
145 |
2.7/1.2(S) |
1.241 (S) |
7.6/2.44(D) |
20.35(S) |
7.4/2.05(S) |
|
|
146 |
1.3/0.6(S) |
0.001(D) |
3.06/0.98(D) |
16.52(S) |
1.47/0.4(S) |
|
|
Bhatgaon |
201 |
0/0(D) |
0.042(D) |
7.58/2.43(D) |
14.79(S) |
3.92/1.08(S) |
|
202 |
0/0(D)) |
0.504 (S) |
6.84/2.2 (D) |
15.55(S) |
1.86/0.51(S) |
|
|
203 |
0/0(D)) |
0.435(D) |
31.93/10.26(S) |
26.85(S) |
2.54/0.7(S) |
|
|
204 |
0/0(D) |
0.001(D) |
59.14/19.01(S) |
38.16(S) |
2.98/0.83(S) |
|
|
Kotyura |
301 |
0/0(D) |
0.001(D) |
56.56/18.18(S) |
24.21(S) |
2.41/0.67(S) |
|
302 |
0/0(D) |
0.155(D) |
98.03/31.51(S) |
15.43(S) |
2.35/0.65(S) |
|
|
303 |
0/0(D) |
0.001(D) |
101.81/32.7(S) |
11.42(S) |
3.89/1.08(S) |
|
|
304 |
0/0 (D) |
0.69 (S) |
15.5/4.81(S) |
3.9(S) |
0.15/0.04(D) |
|
|
Kasoon |
401 |
0/0(D) |
0.001 (D) |
50.58/16.25(S) |
7.63(S) |
4.89/1.36(S) |
|
402 |
0/0(D) |
0.438 (D) |
50.64/16.27(S) |
5.91(S) |
7.76/2.06(S) |
|
|
403 |
0/0(D) |
0.651 (S) |
50.58/16.25(S) |
4.33(S) |
2.45/0.68(S) |
|
|
404 |
0/0(D) |
0.104 (D) |
51.89/16.67(S) |
0.01 D |
3.75/1.04(S) |
|
|
Nutrient Deficiency/ Recommended Fertilizer (with Quantity in mg/Kg) Zn/ZnSO4(10) B/Borax(4) Fe/FeSO4(40) Mn/MnSO4(50) Cu/CuSO4/4 |
||||||
Table 4: The Categories of Nutrients and Nutrient Indices (Low, Medium and High) of the Soil in the Study Region.
|
Village Name |
Sample Size |
Category |
N |
P |
K |
S |
Zn |
B |
Fe |
Mn |
Cu |
|
Patiya |
14 |
Low |
13 |
10 |
14 |
- |
4 |
4 |
12 |
- |
2 |
|
Medium |
- |
2 |
- |
14 |
10 |
10 |
2 |
14 |
12 |
||
|
High |
1 |
2 |
- |
- |
- |
- |
- |
- |
- |
||
|
NI |
1.1428 |
1.4286 |
1 |
2 |
1.7143 |
1.7143 |
1.1428 |
2 |
1.8571 |
||
|
NI |
Low |
Low |
Low |
Medium |
Medium |
Medium |
Low |
Medium |
Medium |
||
|
Bhatgaon
|
4 |
Low |
4 |
3 |
4 |
- |
4 |
3 |
2 |
- |
- |
|
Medium |
- |
1 |
- |
4 |
- |
1 |
2 |
4 |
4 |
||
|
High |
- |
- |
- |
- |
- |
- |
- |
- |
- |
||
|
NI |
1 |
1.25 |
1 |
2 |
1 |
1.25 |
1.5 |
2 |
2 |
||
|
NI |
Low |
Low |
Low |
Medium |
Low |
Low |
Low |
Medium |
Medium |
||
|
Kotyura |
4 |
Low |
2 |
1 |
2 |
- |
4 |
3 |
- |
- |
1 |
|
Medium |
2 |
- |
2 |
4 |
- |
1 |
4 |
4 |
3 |
||
|
High |
- |
3 |
- |
- |
- |
- |
- |
- |
- |
||
|
NI |
1.5 |
2.5 |
1.5 |
2 |
1 |
1.25 |
2 |
2 |
1.75 |
||
|
NI |
Low |
High |
Low |
Medium |
Low |
Low |
Medium |
Medium |
Medium |
||
|
Kasoon |
4 |
Low |
3 |
2 |
4 |
|
4 |
3 |
|
1 |
- |
|
Medium |
1 |
2 |
|
4 |
|
1 |
4 |
3 |
4 |
||
|
High |
|
|
|
|
|
|
|
|
|
||
|
NI |
1.25 |
1.5 |
1 |
2 |
1 |
1.25 |
2 |
1.75 |
2 |
||
|
NI |
Low |
Low |
Low |
Medium |
Low |
Low |
Medium |
Medium |
Medium |
APPENDIX - II:
Table 5: Recommended Crops and their Ecological, Manure and Nutrient Requirements. (Data used from various sources 22-33)
|
Crop & Season |
Soil properties and Irrigation |
Manure Requirement |
Nutrient Requirement (kgha-1) |
Suitable location |
|||
|
N |
P2O5 |
K2O |
S |
||||
|
Mustard & Rapeseed Rabi (Oct-Nov) |
Sandy loam to clay loam soils, better yield on light loam soils. Neutral pH is ideal. Requires watering at pre-bloom and pod filling stages. [22-25°C; 25-40 cm] |
15-20 FYM |
60-90 |
60 |
40 |
- |
Aegra |
|
Sesame Kharif (July) |
Well-drained light to medium textured soils is preferred. Optimum pH range - 5.5 to 8.0. Usually grown under rain fed conditions. [25-35ºC] |
12.5 FYM |
20 |
10 |
0 |
- |
Patiya |
|
Turmeric Kharif (May-June) |
Better yield in well-drained sandy or clayey loam having pH range of 4.5-7.5. Grown as a rain fed crop so irrigation can be provided depending upon rainfall. [24-28º C; 70-230 cm] |
30-40 FYM |
60 |
50 |
120 |
- |
Aegra, Samdeo Kotyura |
|
Ginger Kharif (May-June) |
Provides best yield on well-drained soils (sandy loam, clayey loam, red loam or lateritic loam). Not desirable to grow in the same soil repeatedly as it is an exhausting crop. Ideal pH range- 6-6.5. Grown as rain fed crop so irrigation can be provided depending upon rainfall intensity and rainfall frequency. [12-35°C; 150 cm] |
30-40 FYM |
180 |
15 |
100 |
- |
Tanala Kotyura |
|
Pear Rabi (Jan-July) |
Good results can be achieved when grown in deep and well drained fertile soil without having any hard pan up to 2-meter depth. pH of soil should not be more than 8.7. A well distributed average rainfall of 75–100 cm is required throughout the year for pear cultivation. [10-25º C; 75-100 cm] |
FYM per tree |
0.5 kg/ tree |
1 kg/ tree |
1 kg/ tree |
- |
Aegra, Samdeo Kasoon |
|
Guava Kharif |
Gives good yield in all type of soil. Best results can be achieved when grown under deep, well drained, sandy loam to clayey loam soil. Young plants require water at weekly interval in summer month and 2-3 watering cycle during winter month. [15-30º C; 100 cm] |
FYM /tree 10-20 kg 1-3 yr 25-40 kg 4-6 yr 40-50 kg7-10yr 50 kg>10 yr |
0.4 kg/ tree |
0.25 kg/ tree |
0.35 kg/ tree |
|
Samdeo-Nigad Aegra Samdeo Kasoon |
|
Mango Rabi (February-July) |
Grows on variety of soils. pH of soil should be less than 8.5. Summer irrigation- interval of 5-7 days; winter irrigation- interval 25-30 days; Rainy season- irrigation depends upon rainfall intensity. [22-27º C; 100 cm] |
Kg/tree (Age) Well decomposed cow dung 5-20 (1-3yr), 25 (4-6 yr),60-90 (7-10 yr), 100 >10 yr |
65 |
20 |
75 |
- |
Aegra, Samdeo |
|
Litchi Rabi (August- Sept) |
Also grows on variety of soils. Deep, fertile, well drained, medium texture soils are suitable. pH- 5.5 to 7. Cannot tolerate high pH and saline soils. Irrigation required at all stages of development. [25-35º C; 120 cm] |
Kg/tree (Age) Well decomposed cow dung 10-20(1-3 yr) 25-40(4-6 yr) 40-50(7-10 yr) 60 >10 yr |
kg/ tree 0.36 0.72 1.08 1.20 |
kg/ tree 0.15 0.30 0.45 0.50 |
kg/ tree 0.18 0.36 0.54 0.60 |
- |
Samdeo |
|
Barley Rabi (Mid Oct-Nov) |
Gives yield in moderate loam to sandy soils with neutral to saline response and moderate fertility. Acidic soils are not suitable. Two or three irrigation are required during its life cycle. [12-32º C; 80-110 cm] |
30 FYM |
60 |
30 |
15 |
- |
Patiya Kotyura |
|
Barnyard millet (Madira) Kharif (April-May) Uttarakhand |
Cultivated in soils of marginal fertility. Gives best results on sandy loam to loam soil. Grown as a rain fed crop and does not require any irrigation. |
5-10 FYM |
20 |
20 |
0 |
- |
Tanala, Bhatgaon Kotyura |
|
Fingermillet (Manduwa/ Ragi) Kharif (June-Oct) Uttarakhand |
Grows on a variety of soils and is alkaline resistant to some extent. Suitable soil is alluvial, loamy and sandy with good drainage. Finger millet sown during Kharif ordinarily does not require much water. [20-34º C; 10 cm] |
5-10 FYM |
40 |
20 |
20 |
- |
Tanala, Bhatgaon Kotyura |
|
Horsegram (Gahat) Kharif |
Grows on wide range of soils which are free from alkalinity. A drought-resistant crop requiring a rainfall of about 800 mm. Performs well even under low rainfall areas. [25-30º C; 80cm] |
10-15 FYM |
20 |
30 |
- |
- |
Bhatgaon Kotyura |
|
Blackgram (Urad) Kharif |
Appropriate soil is well-drained loam, pH of 6.5 to 7.8. Inability to grow on saline soils. If needed, irrigation is provided depending upon the climatic conditions. [15-30º C; 50-75 cm] |
10-15FYM |
20 |
40 |
20 |
20 |
Bhatgaon Kotyura |
|
Lentil (Masoor) Rabi (Oct-March) |
Grown on all types of soil. Saline, alkaline, or waterlogged soils should be avoided. Mainly grown as a rain fed crop. [18-20º C; 100 cm] |
4-5 FYM |
20 |
40 |
20 |
20 |
Bhatgaon Kotyura |
|
Soyabean Kharif (Mid-June) |
Well drained, fertile loamy soils. Optimum pH range- 6 to 7.5. Waterlogged or saline soils are not suitable for cultivation. Overall crop requires three to four irrigations. Irrigation applied depending upon rainfall conditions. [18-38º C; 30-60 cm] |
15 FYM |
20 |
60 |
40 |
20 |
Patiya Kotyura Kasoon |
|
Black Soyabean (Kala Bhat) Kharif (Mid-June) |
Grows in natural drainage and fertile loamy soils. Optimum pH range- 6 to 7.5. Waterlogged or saline soils are not suitable for cultivation. Overall crop requires three to four irrigations. Irrigation applied depending upon rainfall conditions. [18-38º C; 30-60 cm] |
15 FYM |
20 |
60 |
40 |
20 |
Patiya Kotyura Kasoon |
|
Pigeon Pea Kharif (June-July) |
Fertile and well drained loamy soils. Optimum pH range - 6.5 to 7.5. Three to four weeks after sowing first irrigation must be applied. Remaining irrigation is dependent upon rainfall intensity. [35-38º C; 60-65 cm] |
5-6 FYM |
25 |
40 |
30 |
20 |
Patiya, Bhatgaon |
Table 6: Manure, Nutrient, and Fertilizer Requirement for the Pulses to be Grown in the Areas Studied in the Project.
|
Village Name |
Crop |
Manure Requirement |
Soil Treatment |
Nutrient Requirement (kgha-1) |
Fertilizer Requirement (kgha-1) |
|||||||
|
N |
P2O5 |
K2O |
S |
ZnSO4 |
CuSO4 |
FeSO4 |
MnSO4 |
Borax |
||||
|
Patiya |
Soyabean |
15tha-1 FYM |
_ |
20 |
60 |
40 |
20 |
_ |
_ |
100 |
_ |
_ |
|
Since low, Add 25% extra |
Since high, Add 25% less |
Since low, Add 25% extra |
||||||||||
|
Bhatgaon |
Pigeon Pea |
5-6tha-1FYM |
2tha-1 lime - 7 days before sowing |
25 |
40 |
30 |
20 |
25 |
_ |
_ |
_ |
10 |
|
Since low, Add 25% extra |
Since low, Add 25% extra |
Since low, Add 25% extra |
||||||||||
|
Kotyura |
Black Soyabean |
15tha-1 FYM |
2tha-1lime - 7 days before sowing |
20 |
60 |
40 |
20 |
25 |
_ |
_ |
_ |
10 |
|
Since medium, add exact amount. |
Do not apply |
Since medium, add exact amount. |
||||||||||
|
Kasoon |
Soyabean |
15tha-1FYM |
2tha-1lime - 7days before sowing.
|
20 |
60 |
40 |
20 |
25 |
_ |
_ |
_ |
10 |
|
Since low, Add 25% extra |
Since low, Add 25% extra |
Since low, Add 25% extra |
||||||||||


