Traffic Emissions due to Changes in Road Layout in Developing Township Related to Double Track Rail Project Constructions
Maisarah Sulaiman1
 , Nor Azam Ramli1
, Wan Hashim Wan Ibrahim2
, Nur Baitul Izati Rasli1
, Mohd Rodzi Ismail3
*
and Syabiha Shith1
, Nor Azam Ramli1
, Wan Hashim Wan Ibrahim2
, Nur Baitul Izati Rasli1
, Mohd Rodzi Ismail3
*
and Syabiha Shith1
1
Environmental Assessment and Clean Air Research,
School of Civil Engineering, Engineering Campus,
Universiti Sains Malaysia,
Nibong Tebal,
Penang,
Malaysia
2
Universiti Malaysia Sarawak (UNIMAS),
Kota Samarahan,
Sarawak,
Malaysia
3
School of Housing Building and Planning,
Universiti Sains Malaysia,
Minden,
Penang,
Malaysia
http://dx.doi.org/10.12944/CWE.17.3.5
Copy the following to cite this article:
Sulaiman M, Ramli N. A, Ibrahim W. H. W, Rasli N. B. I, Ismail M. R, Shith S. Traffic Emissions due to Changes in Road Layout in Developing Township Related to Double Track Rail Project Constructions. Curr World Environ 2022;17(3). DOI:http://dx.doi.org/10.12944/CWE.17.3.5
Copy the following to cite this URL:
Sulaiman M, Ramli N. A, Ibrahim W. H. W, Rasli N. B. I, Ismail M. R, Shith S. Traffic Emissions due to Changes in Road Layout in Developing Township Related to Double Track Rail Project Constructions. Curr World Environ 2022;17(3).
Download article (pdf)
Citation Manager
Publish History

Introduction
Air pollutants can occur in the atmosphere in either gaseous or particulate form. There are many types of air pollutants, especially in gaseous form. For example, sulphur dioxide, nitrogen oxides, and carbon monoxide are three well-known gaseous pollutants. However, concern over the rise in the concentration of gaseous pollutants has also been increasing for many years, especially in the past two decades.
Humans are responsible for emitting particulate and gaseous pollutants into the atmosphere, but on the other hand, they are most adversely affected by inhaling polluted air. There are many significant sources of particulate pollutants including highways and airports.1 Motor vehicles release several pollutants, including gaseous and particulate matter, which harm humans, especially the young, the elderly, and sensitive people. As the number of vehicles on the roads has increased, concern for traffic-related air pollution and its possible effects has also grown. Hamilton and Harrison 2 indicated that the pollution inventory's main contribution came from vehicles in most urban sites in the UK. Besides, many of these facilities (buildings and roads) and quarrying may also cause air quality deterioration. The particulate matter has a vast chemical composition and comprises a variety of sizes, and both are influenced very much by the emitting source.3
There have been changes in the main contributors to air pollution emissions in the last few decades. Almost everywhere globally, especially in cities, emissions from motor vehicles have slowly taken over as the primary contributor. Vehicle emissions have been identified as the dominant gaseous and particulate emissions.4-7 Specifically, buses, coaches and lorries are the primary vehicle types that emit significant air pollutants. The portion of emissions from light vehicles such as cars is less critical than from larger vehicles.4 Gradually improvements in engine technology have reduced unit passenger-vehicle emissions, responding to more stringent legal requirements.8 However, the world has seen an increase in total vehicle numbers, contributing to the high concentrations of emissions from passenger vehicles. The marked increase in cars entering the roads has resulted in congestion, especially in cities. This trend is set to continue with an estimate that vehicle numbers will increase by, on average, 3% per annum.9 The increase of vehicle numbers, hence the increase of vehicle emissions in megacities and other major population centers that represent large and concentrated sources of anthropogenic pollutants to the atmosphere, will affect both local air quality and regional and global atmospheric chemistry.10
Vehicle emissions are unavoidable in many less-developed countries, mainly in urban areas. Generally, fewer vehicles tend to occur in rural areas as purchasing abilities are relatively low. However, vehicle ownership rationalisations have caused developing townships to be inundated with more and more private vehicles. In Malaysia, cities' gaseous and high particulate matter concentrations are closely linked to vehicle emission11. The compounded vehicle volume growth in Malaysia from 2008 to 2015 was 27.07%.12 Additionally, non-urban areas are also subjected to the effects of high particulate emissions. Most used passenger vehicles belonging to city dwellers are sold to lower-income groups in small towns. Maintenance of these vehicles is sometimes neglected, thus leading to more pollutants being emitted.
The industrial corridor policy has opened many new industrial estates to accommodate new jobs and investment opportunities. The new estates are usually located in or near small towns, turning these small towns into essential business areas. In urban atmosphere, vehicular emissions (VE) are among the significant sources of airborne fine particulate matter (PM2.5) that adversely affect the environment and public health. In Hong Kong, hourly monitoring of organic carbon (OC) and elemental carbon (EC) at strategically located spots was found to be an effective way of monitoring vehicle control measures.13 In another city area of Kuala Lumpur, Malaysia, it was found that private vehicles (i.e. cars and motorcycles) emitted the highest amount of particulate matter (PM10) due to traffic congestion, differences of fuel characteristic in vehicle movement processes, and morphology aspects of the urban background. 14 Hence, to improve the quality of environment in the urban area, the local authorities and government agencies should implement several strategies and policies to reduce emission of pollutants from vehicles.
Research on small and developing towns has shown that residents are subjected to the adverse influence of vehicle emissions due to congestion, road conditions and vehicle quality.15,16 Pollution concentrations, especially ozone and particulate matter, are critical concerning human exposure. A study on exhaust emission from passenger vehicles showed that emission levels of CO and HC were strongly related to the age and/or milage of cars, hence it was recommended that the existing emission certification infrastructure to be upgraded and there should be a policy for phasing out of cars.17 Another study on diesel-driven passenger cars in Delhi, India found that vehicles’ age, mileage, maintenance category, emission norm and engine aspiration affect its smoke emission, in which milage was considered as a significant parameter in upgrading the existing inspection and maintenance (I/M) programs in developing countries.18 In addition, the outcome of a study on emission from petrol-driven cars of Maruti in India also showed that the vehicle age and milage were the most crucial as after certain age and milage, vehicles would become non-compliant to pollution control systems.19
Nevertheless, air pollution in small towns is less studied hence in need for a systematic investigation to understand better its effect on human health and academic understanding.
Traffic Emission
The composition of emissions from vehicles is related to the quality of fuel. For example, the aromatic and sulphur contents of diesel fuel have been shown to strongly influence the emissions of PAHs (polycyclic aromatic hydrocarbons) and PM. The use of new alternative and less complex fuels could lead to optimisation of engines to a certain fuel which would result in better compliance with the legal emission requirements.
Emission rates depend on the traffic’s characteristics, types of vehicles and intersections. Other correlations to vehicle emission rates are the types, and sizes of engines and cars, the ages of the vehicle, the engine’s condition and characteristics, emission control equipment, vehicle maintenance, and the vehicle’s weight. Nevertheless, some studies prefer to estimate the emissions rate due to the traffic flow and speed because it's easier to quantify.21
According to Coelho et al., 22 vehicle emissions will likely increase due to excessive delays, queue formation, and the speed change cycle for approaching traffic (Figure 1). Based on the previous experimental measurements (modelling traffic) and emission performance of speed control traffic signals, the interaction between the signal and control variables influences the vehicle emissions’ value. The interaction between signal controls is the settings of signal phasing and optimum signal cycle, speed threshold and minimum green. Besides, the operational parameters (i.e., saturation flow and level of service (LOS)) could be determined by the signalised intersection.23 At the same time, the variables for environmental and traffic performance are carbon monoxide, nitric oxide, and hydrocarbon emissions.
Traffic congestion is a significant factor that affects the emissions of road traffic and air quality as congestion creates changes in driving patterns of individual vehicles in a traffic stream, and changes in emission levels, hence it should be taken into account in the predictions of local emissions and fuel consumption from road traffic.24
SIDRA Intersection 6.1, from the data on Passenger Car Unit volume, signal phasing and time, and its geometric design, the fuel consumption, operating cost and pollutant emissions can be estimated. This model provides a highly reliable general method for calculating fuel consumption and pollutant emissions. For each lane of traffic, its constructed four-mode elemental (Figure 1) drive cycles consist of the cruise, acceleration, deceleration, and idling (stopped time). These drive cycles vary according to specific traffic conditions (geometry design, traffic control, signal timings, driver characteristics and demand flows). In SIDRA Intersection 6.1, the drive cycles are constructed separately for stopped and unstopped and light and heavy vehicles. Then, the fuel consumption and emissions were calculated for each of the four driving modes for each drive cycle, and the results were added together for the entire driving manoeuvres.
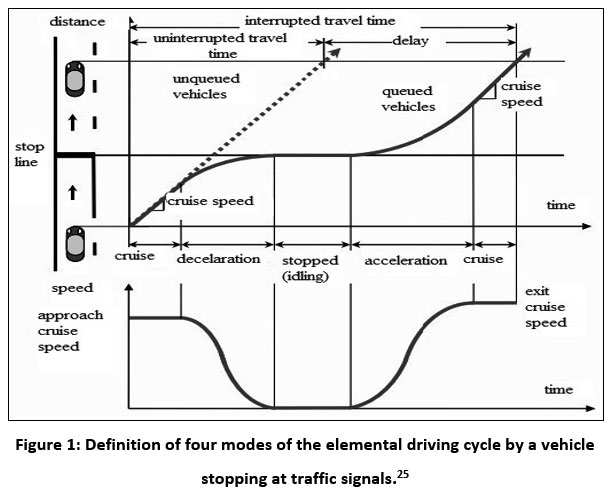 | Figure 1: Definition of four modes of the elemental driving cycle by a vehicle stopping at traffic signals.25
|
Level of Services (LOS)
A traffic facility's Level-of-Service (LOS) is a concept that relates traffic service quality to a given flow rate. HCM (Highway Capacity Manual) introduces LOS to denote quality from a local condition under different operation characteristics and traffic volume. HCM categorises LOS in the form of letters (A to F) for various ranges of operating conditions on a particular facility type, in which A denotes the best quality of service, whereas F indicates the worst. These definitions are based on that facility's Measures of Effectiveness (MoE). A typical measure of effectiveness includes speed, travel time, density, delay etc. According to the HCM 2000 method, the LOS criteria for motor vehicles are mentioned in Table 1.
Table 1: LOS criteria for motor vehicles at the intersection and roundabout
| Delay (Seconds per Vehicle) | ||
Level of Services | Unsignalised Intersection | Signalised Intersection | Roundabout |
LOS A | Less than 10.0 | Less than 10.0 | Less than 10.0 |
LOS B | 10.1 to 15.0 | 10.1 to 20.0 | 10.1 to 15.0 |
LOS C | 15.1 to 25.0 | 20.1 to 35.0 | 15.1 to 25.0 |
LOS D | 25.1 to 35.0 | 35.1 to 55.0 | 25.1 to 35.0 |
LOS E | 35.1 to 50.0 | 55.1 to 80 | 35.1 to 50.0 |
LOS F | Greater than 50.0 | Greater than 80.0 | Greater than 50.0 |
In SIDRA Intersection 6.1, LOS results are given for all major road lanes and movements, including continuous routes. Usually, LOS A or B will result from zero delays (or geometric delay only for turning vehicles).26
The Capacity of Intersection
According to Strokes 27, signalised intersection capacity is determined using a theoretical value in certain conditions. Commonly, an intersection's capacity is influenced by crossing its geometrical factors. Signal timing and phasing and the lane’s width could significantly control the flow of traffic (Table 2). One capacity of intersections typically affects saturation flow, hence causing higher emissions.
Table 2: Factors affecting the saturation flow.27
Factors | Elements that affect saturation flow |
Geometry | Width of approach Width of lane Number of lanes Gradient Turning radius Length of turn bay |
Operation condition | Signal timing and phasing Parking activities Bus stop operation Peak hour factor characteristic |
Traffic characteristic | Turning movement Pedestrian activities Classification of vehicles |
Environment and others | Driving behaviour Weather Road surface condition Land use Population area |
Methodology
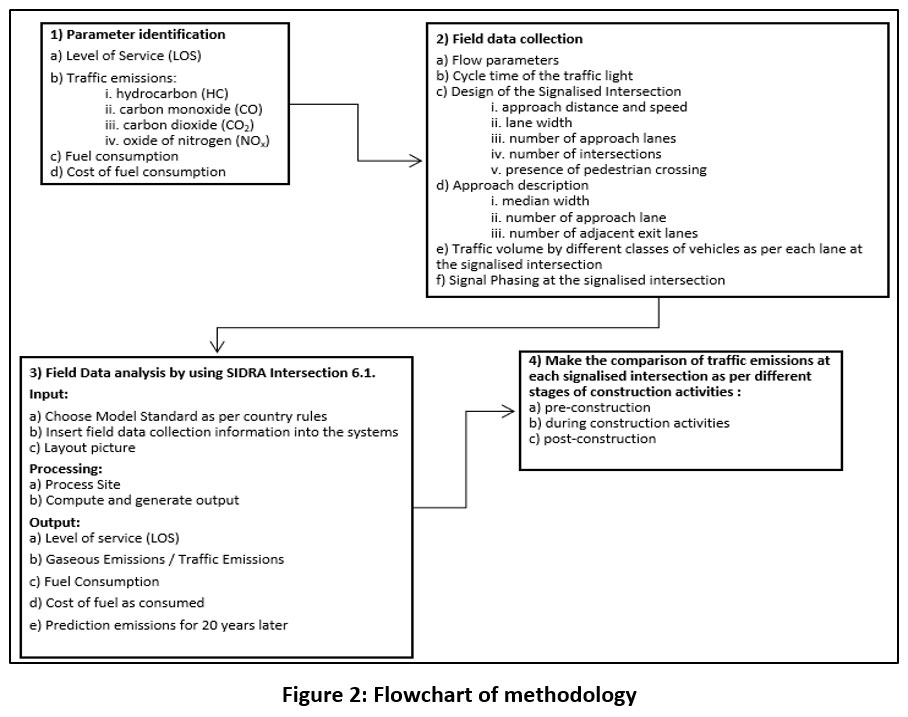 | Figure 2: Flowchart of methodology
|
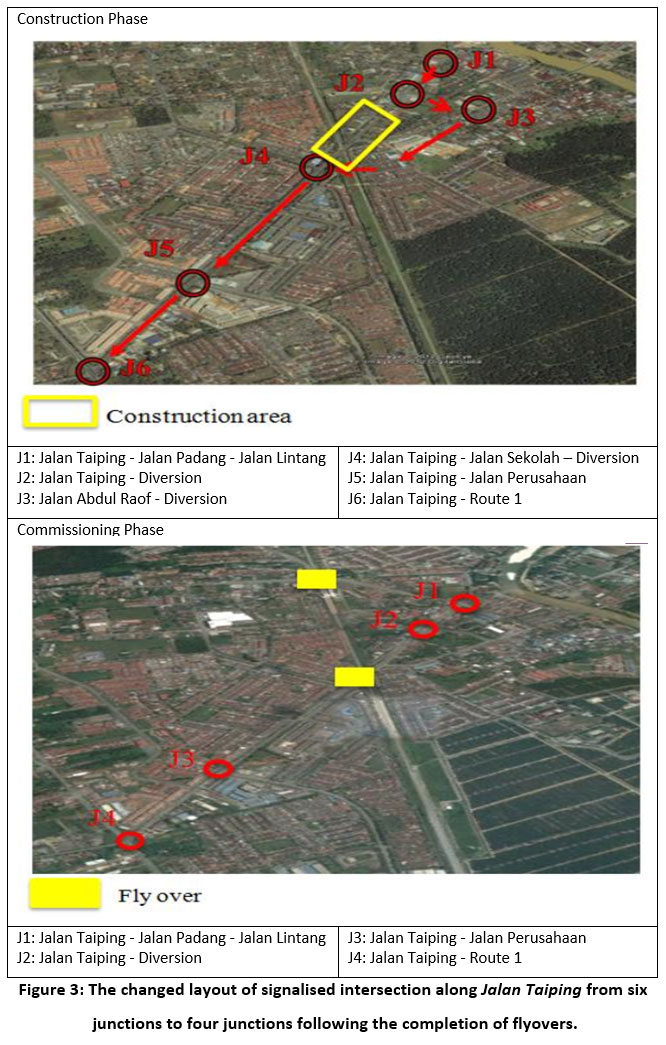
The methodology for gaseous emissions began with parameter identification, field data collection, field data analysis by using SIDRA Intersection 6.1, and finally, estimating the emission value between different phases of construction activities i.e., “pre-construction”, “during construction”, and “post-construction”. There were six-selected signalised intersections for gaseous emissions monitoring in the developing town, located at (5º 06’ 19. 41” N, 100º 29’ 07. 50” E) along Jalan Taiping in Parit Buntar (northern of Perak) illustrated in Figure 3. Only results for five junctions will be reported, i.e., J1 to J5. Results for J6 were reported elsewhere.
Traffic surveys were conducted to calculate the traffic volumes and subsequently estimate emission volumes; the data were continuously counted manually for 12 hours (07:00 until 19:00 hours) in four phases of construction in the Electrified Double-Track Project (EDTP) project crossing the land of Parit Buntar from 2010 until 2015. The traffic volumes were classified into five classes of vehicles (Table 3), and to standardise volume, each volume of the vehicles was converted into Passenger Car Units per hour (PCU/hr). The possible theoretical changes at selected intersections, the cycle time, signal phasing and level of service were identified.
Table 3: Classification of vehicles ATJ 8/86.28
Class | Vehicles Classification |
Class 1 | Passenger cars, including taxis, small vans and utilities |
Class 2 | Lorries with two axles and minibuses |
Class 3 | Trailer with more than two axles |
Class 4 | Buses |
Class 5 | Motorcycles |
There are four main stages in construction activities monitored, which are pre-construction (2010), during construction (2011), after-development (2012 until 2014), and present condition (2015). After-development and current conditions are also known as the commissioning phase (Figures 4 and 5). The specification of implication in the increasing concentration of gaseous emissions to the environment was monitored, i.e., the signal phasing, delay time, level of services (LOS), and geometry design. Hence, the number of trips made, the distribution of vehicles over space and time, the choice of routes, the driving mode (accelerate, decelerate, idling and stop) and where people spend time are other factors to be considered. Finally, we analyse the fuel consumption, cost, and gaseous emission (CO2, CO, HC, and NOx) between phases.
The first step in carrying out the study of vehicle emissions is referring to the literature review. All the information needed for this study is to improve the knowledge and idea about vehicle emissions. In this research, the study is generally about vehicle emissions at the signalised intersection. Hence, information about signalised intersections and air pollution is needed to thoroughly understand and elaborate on the subject matter in this research.
 | Figure 3: The changed layout of signalised intersection along Jalan Taiping from six junctions to four junctions following the completion of flyovers.
|
Traffic flow parameters affecting the vehicle's emission were identified as approach distance and speed, lane width, per cent of heavy vehicles, number of approach lanes, number of the intersection, presence of pedestrian crossing, flow parameters, the cycle time of the traffic light, intersection design of the junction, approach description, median width, number of approach lane, number of adjacent exit lanes, traffic volume for each lane of the traffic light junction and phasing of the traffic light systems.
Then, the traffic volumes data collected at all junctions were keyed into SIDRA Intersection 6.1 software (Signalized and Unsignalised Intersection Design and Research Aid). The parameters were analysed to generate the vehicle's emission at that signalised intersection. Vehicle emissions including hydrocarbon (HC), carbon monoxide (CO), carbon dioxide (CO2), and oxides of nitrogen (NOx) were determined using this software. The value of fuel and cost were also determined. Particulate matter, albeit emitted by vehicles, was not included as the software’s output. The effect of cycle time, signal phasing, and level of service at the signalised intersection on gaseous traffic emission were estimated. Then, the impact of improvements in cycle time, signal phasing and level of service at a signalised intersection in reducing traffic emissions were calculated. Lastly, the concentrations of gaseous emissions in developing towns during various construction activities, pre, during, and post-construction, were compared.
Result and Discussions
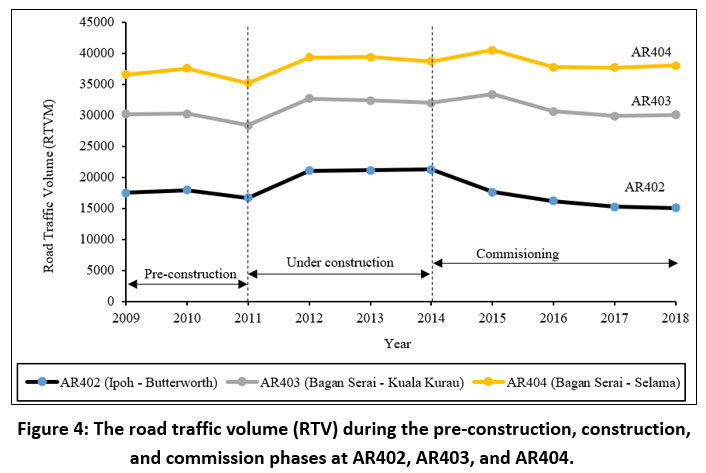 | Figure 4: The road traffic volume (RTV) during the pre-construction, construction, and commission phases at AR402, AR403, and AR404.
|
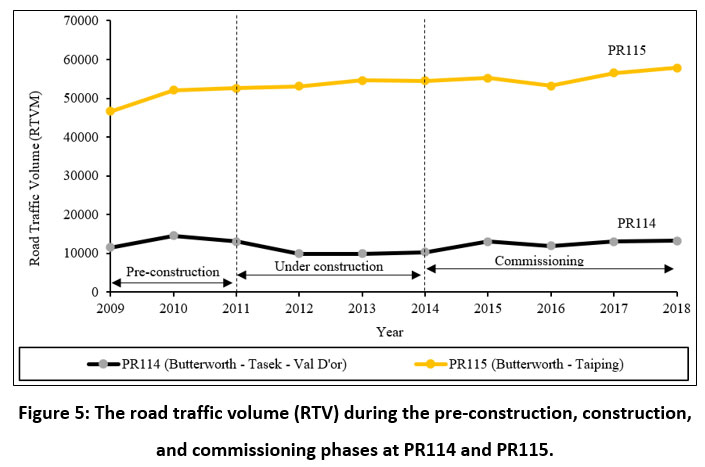 | Figure 5: The road traffic volume (RTV) during the pre-construction, construction, and commissioning phases at PR114 and PR115.
|
Figures 4 and 5 show the differences in vehicle volume during all phases of construction. Figure 4 indicated that vehicles using Route 1 increased during the construction of the flyover between 2011 to 2014. The volume of 2015 decreases to a level similar to preconstruction. Conversely, the volume at the road traversing JI to J6 during construction decreased but then returned to the level of preconstruction after 2015. This suggests that most road users divert their route to Route 1 during construction. All vehicles are traversing J1-J6 experience different LOS at all signalised intersections during construction.
Cycle Length
Four current phases are available to coordinate traffic movement in this intersection: the cycle time in 2011 (during construction) is less than in 2010 and 2014. This is due to the construction activities and the fixed-control operation of cycle time.
Table 4: The cycle length at J1
Construction Stage | Maximum Green Time (s) | Cycle Length (s) | |||
Phase 1 | Phase 2 | Phase 3 | Phase 4 | ||
Before construction (2010) |
50 |
20 |
30 |
50 |
170 |
During construction (2011) | 30 | 20 | 20 | 30 | 120 |
Post-Construction (2014) | 45 | 75 | 20 | 20 | 180 |
Table 5: The cycle length at J2
Construction Stage | Maximum Green Time (s) | Cycle Length (s) | |||
Phase 1 | Phase 2 | Phase 3 | Phase 4 | ||
Before construction (2010) |
- |
- |
- |
- |
- |
During construction (2011) | 16 | 53 | 47 | - | 131 |
Post-Construction (2014) | 46 | 25 | 42 | 50 | 183 |
Table 6: The cycle length at J3
Construction Stage | Maximum Green Time (s) | Cycle Length (s) | ||
Phase 1 | Phase 2 | Phase 3 | ||
|
50 |
37 |
50 |
152 |
During construction (2011) | 17 | 88 | 33 | 153 |
During construction (2012) | 27 | 56 | 60 | 158 |
Post-Construction (2014) | - | - | - | - |
Table 7: The cycle length at J4
Construction Stage | Maximum Green Time (s) | Cycle Length (s) | ||
Phase 1 | Phase 2 | Phase 3 | ||
Before construction (2010) |
45 |
50 |
50 |
163 |
During construction (2011) | 40 | 27 | 28 | 110 |
Post-construction (2014) | 20 | 20 | 33 | 88 |
Recent-Condition (2015) | 28 | 30 | 44 | 117 |
Table 8: The cycle length at J5
Construction Stage | Maximum Green Time (s) | Cycle Length (s) | |||
Phase 1 | Phase 2 | Phase 3 | Phase 4 | ||
Before construction (2010) |
30 |
38 |
24 |
43 |
155 |
During construction (2011) | 22 | 41 | 39 | 45 | 167 |
Post-Construction (2014) | 27 | 20 | 55 | 40 | 162 |
During the Electrified Double-Track Project (EDTP) implementation, the cycle length at J1 (Table 4) was reduced from 170 seconds to 120 seconds. The cycle time reduction aimed to minimise the delay time at this junction during construction activities. In the stage of post-construction, the cycle length increased to 180 seconds.
The cycle time for a traffic signal at the existing intersection between J2 (Jalan Taiping and diversion from Shell Petrol Station) conditions in the pre- and post-construction (commissioning phase) was shown in Table 5. This junction existed during the construction activities of the double-track project. It was recorded that cycle length increased in the post-construction stage compared with during construction indifference 52 seconds. In 2014 post-construction (commissioning phase), there was a new linkage of the junction. The original junction was connected to the main road of Jalan Taiping to the alternative way to the nearest schools (west approach).
The cycle length of signalised intersection between Jalan Taiping, Jalan Sekolah and the diversion from Bank Islam is shown in Table 6. It can be seen that the cycle length was increasing at each stage. Hence, the delay time at that intersection will reduce due to the cycle time reduction. Therefore, it will automatically minimise the congestion at the intersection. In 2014 at the post-construction stage, there was no signalised intersection at this route anymore.
In Table 7, the cycle length at Jalan Taiping and Jalan Sekolah diversion was minimised during post-construction to 88 seconds. The highest cycle length was the pre-construction stage at 163 seconds. While in Table 8, the cycle length of the hectic road was reduced in stages before construction in 155 seconds and increasingly at ongoing development in 167 seconds.
Passenger Car Unit (PCU/hr.) at Signalised Intersection
In 2011, during the construction activities at J1, the congestion time was recorded at 10:00 hours in 6375 PCU/hr. for all directions in the south, east, and northwest. In 2014, the traffic flow and congestion had shifted to 16:00 hours in vehicles of 2860 PCU/hr. The maximum flow was entering from the south in 1347 PCU/hr.
The highest peak of traffic volume during construction at J2 was at 15:00 hours. Compared with the J1, the peak volume was at 10:00 hours. The differences in traffic volume between these two junctions were due to the residents’ activities. At this hour, this route was actively used for students from the two nearest schools and people entering and out of the mosque. In the post-construction phase, the peak volume is still the same as J1 at 16:00 hour, when most residents start to use the road for evening activities, back from the office, schools and others. The highest PCU/hr at J3 during the construction activities was recorded at 15:00 hours at 2700 PCU/hr. The congestion at this junction occurred twice, from morning peak 9:00 to 11:00 am and afternoon peak 14:00 until 16:00. At the post-construction stage, the congestion occurred at the afternoon peak from 12:00 until 13:00.
In J4, it was shown that there are two peak hours during the construction stage: morning and evening peak. The peak decreased post-construction, which occurred in one peak hour (afternoon peak) and kept falling to the new condition, which is the congestion that happened in only one hour per day. In J5, the peak hour occurred in the morning, at 7:00 am. This was the busiest road that connected another town from a logical view. The total for the four directions at this hour was summarised in the highest value compared with another hour.
The conclusion for the total volume of PCU/hr. Was that the vehicles entering this town during construction activities were much higher than in the post-construction stage. This is due to the reduction of HGV that used this road during construction. The PCU/hr. at the construction stage dropped to the minimum value of PCU at 12:00 to 13:00 hours.
Delay at Signalized Intersections
The delay time at a signalised intersection and the LOS differences for each stage and approach were shown in Table 9 until Table 13.
Table 9: The average stopped delays for all approaches at J1
| Approach | Year | Stage | Delay (s) | LOS |
| South | 2010 | Before-construction | 190.55 | F |
| 2011 | During-Construction | 44.9 | D | |
| 2014 | Post-Construction | 42.93 | D | |
| East | 2010 | Before-construction | 97.4 | F |
| 2011 | During-Construction | 51.5 | D | |
| 2014 | Post-Construction | 50.14 | D | |
| North | 2010 | Before-construction | 73.95 | E |
| 2011 | During-Construction | 28.2 | C | |
| 2014 | Post-Construction | 33.38 | C | |
| West | 2010 | Before-construction | 130.6 | F |
| 2011 | During-Construction | 45.6 | D | |
| 2014 | Post-Construction | 20.69 | C |
Table 9 at J1 shows the average stopped delays for all lanes from all approaches and the decreasing values from before construction activities until post-construction. The west approach represented for Jalan Padang shows the most significant decrease from 130.6 seconds to 20.69 seconds. The level of service for that lane improved from LOS F to LOS C due to the efficient traffic lights. Hence, the vehicles experienced a decreasing delay LOS after the construction activities were completed for this condition.
Table 10: The average stopped delays for all approaches at J2
| Approach | Year | Stage | Delay (s) | LOS |
| South | 2010 | Before-construction | - | - |
| 2011 | During-Construction | 64.8 | E | |
| 2014 | Post-Construction | 59.7 | E | |
| East | 2010 | Before-construction | - | - |
| 2011 | During-Construction | 63.3 | E | |
| 2014 | Post-Construction | 11.4 | B | |
| North | 2010 | Before-construction | - | - |
| 2011 | During-Construction | 36.1 | D | |
| 2014 | Post-Construction | 73.2 | E | |
| West | 2010 | Before-construction | - | - |
| 2011 | During-Construction | - | - | |
| 2014 | Post-Construction | 90.6 | F |
Table 10 at J2 shows that all approaches' average stopped delays did not significantly increase or decrease. The south direction represented for Jalan Taiping shows the most significant decrement from 64.8 seconds to 59.7 seconds, both still in LOS E. While approaching the route from the East (the permanent diversion) shows a decrement from 63.3 seconds during construction to 11.4 s, the post-construction stage. The LOS for the North approach revealed the increasing LOS value from LOS D (36.1 s) to LOS E (73.2 s). At the same time, the west approaches were activated after the construction was completed. Unfortunately, the delay caused an increase in LOS F according to the increasing number of vehicles that used the main road of Jalan Taiping. This road was linked with intersection J1 and coupled with a new flyover. All these routes were connected to the main road, which road users actively used, i.e., hospitals, university, schools, and supermarkets.
Table 11: The average stopped delays for all approaches at J3
| Approach | Year | Stage | Delay (s) | LOS |
| South | 2010 | Before-construction | - | - |
| 2011 | During-Construction | 2434.25 | F | |
| 2014 | Post-Construction | - | - | |
| Northeast | 2010 | Before-construction | - | - |
| 2011 | During-Construction | 54 | D | |
| 2014 | Post-Construction | - | - | |
| West | 2010 | Before-construction | - | - |
| 2011 | During-Construction | 49.3 | D | |
| 2014 | Post-Construction | - | - |
Table 11 shows that the average stopped delays at J3 were very long. The LOS from the South was F, whereas the Northeast and West were D during the construction stage. A comparison could not be made between pre-construction and post-construction. The junction was created due to traffic diversions that allowed the least disruption regarding flyover developments related to the Electrified Double-Track Project (EDTP). J3 was later eliminated when the flyover came into operation. However, the motorists experienced long delays (maximum recorded 2434.25 seconds) during the junction. This is because it was a gated rail crossing, and whenever the train passed through the J3, the gate shall be closed, and the waiting time extended.
Table 12: The average stopped delays for all approaches at J4
| Approach | Year | Stage | Delay (s) | LOS |
South
| 2010 | Before-construction | 64.75 | E |
| 2011 | During-Construction | 73.1 | E | |
| 2014 | Post-Construction | 121.5 | F | |
| 2015 | Recent- Condition | 44.84 | D | |
East
| 2010 | Before-construction | 81.3 | F |
| 2011 | During-Construction | 294.2 | F | |
| 2014 | Post-Construction | 47.05 | D | |
| 2015 | Recent- Condition | 58.55 | E | |
| North | 2010 | Before-construction | 85.4 | F |
| 2011 | During-Construction | 398.1 | F | |
| 2014 | Post-Construction | 31.3 | C | |
| 2015 | Recent- Condition | 44.09 | D |
While in Table 12, the average stopped delays for the existing signalised intersection under prevailing cycle time in 2010, 2011, 2014 and 2015 for the signalised intersection between Jalan Taiping and Jalan Perusahaan. The average stopped delays for all lanes from all approaches show the decreasing LOS from 2010 to 2015. The level of service from North Lane improves from LOS F to LOS D. Hence, the vehicles experience a decreasing delay in time for this condition.
Table 13: The average stopped delays for all approaches at J5
| Approach | Year | Stage | Delay (s) | LOS |
| South | 2010 | Before-construction | 54.65 | D |
| 2011 | During-Construction | 246.77 | F | |
| 2014 | Post-Construction | 155.97 | F | |
| East | 2010 | Before-construction | 122.2 | F |
| 2011 | During-Construction | 662.1 | F | |
| 2014 | Post-Construction | 328.4 | F | |
| North | 2010 | Before-construction | 61.13 | E |
| 2011 | During-Construction | 1350.5 | F | |
| 2014 | Post-Construction | 405.18 | F | |
West
| 2010 | Before-construction | 54.65 | D |
| 2011 | During-Construction | 50.17 | D | |
| 2014 | Post-Construction | 102.32 | F |
In Table 13, the average stopped delays for all approaches at J5 show the increasing delay of time into LOS F condition from 2010 to 2014. The east and north approach shows reduced LOS. The percentage values for increasing the uncertainty from 2010 to 2014 kept growing by more than 50%. Hence, for this condition, the vehicles experience an increasing level of delay from time to time.
The Summary of Gaseous Emission, Fuel Consumption and Cost Estimation at Signalized Intersection along Jalan Taiping
At Junction J1, there are four main directions in Jalan Taiping-Jalan Sekolah and Jalan Lintang, which are Jalan Taiping from the South and North, Jalan Lintang from the east and Jalan Padang from the west. Jalan Taiping from the North showed the highest cost estimation value: 1932.50 RM/h before construction activities. Cost estimation showed the highest value at “before construction stages” for all four main directions (South, East, North and West). The highest total cost estimation is 3794.0 RM/h during “before construction stages. The entire vehicle volume was much higher than before construction phase activities during the construction stage. By referring to the cost consumption, even the vehicle volume during construction was higher than before. Before construction, the cost value recorded the highest value compared with other development periods. This factor occurred due to improper signal phasing in 2010 and was affected by the flow's bad LOS. The fuel consumption was higher before construction, recorded at 437.30 L/hr. than another upcoming phase state at 174.41 L/hr. and 198.78 L/hr. The value of fuel consumption before construction is high in developing towns. Due to the high amount of fuel consumption, automatically, it can be a catalyst for the increase of other gaseous emissions such as NOx, CO, CO2, and HC. Shrivastava et al.29 (2013) reported that around 70% of the environmental pollution was contributed by the transport sectors, with the highest (90 %) of the CO pollutant total emission. Andong and Sajor 30 also reported elevated CO2 emissions from the transport sector. Then, the fuel consumption was lowest in the post-construction stages. The relation between delay times significantly impacts the gaseous emissions values at a signalised intersection. It was shown that the more delay time is taken at a signalised intersection, the more gaseous emission, cost, and fuel consumption will be wasted. The total PCU/hr. at the stage of construction was much higher (4251 PCU/hr.) than at the stage before and during post-construction activities (2903 PCU/hr and 2005 PCU/hr), respectively, the gaseous emissions released during construction were lowered than before construction. Due to the proper delay time, signal phasing, and less congestion due to the correct traffic flow, the delay and gaseous emissions improved during post-construction activities. Besides that, Rhode et al. 31 found that the production of NOx and PMx could be decreased by lowering the speed limit and increasing delay.
The total vehicle volumes at Junction 2 were recorded as higher than the post-construction stage in the construction stage. The difference in vehicle volume between these stages was 1083 PCU/hr. The difference in cost estimation between these stages was 37162.72 RM/h. The fuel consumption during construction is much higher than in the post-construction phase. Hence, it will affect the total value of gaseous emissions at this signalised intersection. During construction, fuel consumption was 1650.96 L/hr., 5096.93 kg/h of CO2, and 16.00 kg/hr. of CO, 1.14 kg/hr. of HC, and 3.22 kg/hr. of NOx and 2983 vehicles volume in PCU/hr. Hence, the fuel consumption in the post-construction phase was 264.98 L/hr., 622.74 kg/h of CO2, and 0.06 kg/hr. of CO, 0.06 kg/hr. of HC, 0.16 kg/hr. of NOx and 1899 vehicles volume in PCU/hr. The whole traffic light junction showed a decrement in fuel consumption, traffic volume and vehicle emissions from the construction stage until the post-construction phase. The average fuel consumption and vehicle emissions in each direction decreased due to the reduction in vehicle volume. Using SIDRA Intersection 6.1 software, the analysis showed that the decrease in fuel consumption is more than 13.79%, and hydrocarbon emission has reduced by about 15.33%. Table 14 shows the average fuel consumption and vehicle emissions for each lane in 2011 at the signalised intersection between Jalan Taiping and Diversion from SJKC Sin Hwa since this intersection appeared in 2011, so no comparison of fuel consumption and vehicle emissions between 2010 and 2011.
At Junction 3, there are three main directions at Jalan Taiping - Jalan Sekolah and temporary diversion. The south direction was coming from Jalan Taiping; the northeast was from the diversion, and the west was the direction from Jalan Sekolah. The stage of ongoing construction showed the maximum amount in all aspects of gaseous emission: the CO2 was 5874 kg/h, CO was 65.64 kg/h, HC was 6.75 kg/h, and NOx was 6.75 kg/h. However, the estimated cost at this intersection was higher in phase 2 of ongoing construction. The highest amount of cost estimation was 48812 RM/h. This signalised intersection existed until 2013; once the flyover of the Electrified Double-Track Project (EDTP) project was finished, this intersection was eliminated. During the ongoing construction activities, there was a high traffic congestion level. The ongoing construction activities were the factor that influenced the traffic congestion. At this intersection, the traffic flow was obstructed by the train crossing two main roads at Parit Buntar town. Unfortunately, this railway track was crossing the road located at Junction 3. Hence, the delay time at this intersection was always in poor condition. After the Electrified Double-Track Project (EDTP) project was completed, the traffic flow improved.
Junction 4’s traffic light junction reduced fuel consumption and vehicle emissions from 2010 to 2015. The highest value for gaseous emissions, cost estimation and traffic volume were recorded during the construction stage. The average fuel consumption and vehicle emissions from Jalan Taiping to the North approach showed an increment compared with another approach. They showed a reduction in delay time for each lane. The analysis using SIDRA Intersection 6.1 revealed a decrease in fuel consumption of more than 36.38%, and hydrocarbon emissions had reduced by about 41.43% compared to the hydrocarbon emissions in 2010. Carbon dioxide emissions recorded a 36.38% reduction, followed by carbon monoxide at approximately 23.79% and oxide of nitrogen at 21.91%.
Meanwhile, at Junction 5, the highest value for cost estimation was recorded at the construction stage at 3845 RM/h. Fuel consumption was maximum before the construction stage at 332.6 L/h. The maximum gaseous emission was recorded before construction: 832.4 kg/h of CO2, 59.27 kg/h of CO, 1.56 kg/h of HC and 1.70 kg/h of NOx. After completing the Electrified Double-Track Project (EDTP) project, the current condition stage was shown the lowest amount of gaseous emission. This is due to proper traffic management and less delay at this intersection. In Table 14, the gaseous emissions, fuel consumption, cost estimation, and traffic volume during construction were much higher than at any stage of construction. The cost estimation was 246183 RM/h, 13996 L/h of fuel consumption, and 7784 PCU/hr. The traffic from the east (Route 1) was shown with the highest value for fuel consumption and vehicle emissions. The pre-construction and post-construction stages showed a decrement in fuel consumption and vehicle emissions in 2011 and 2014. During the construction stage, the average fuel consumption and vehicle emissions for the north approach (Jalan Taiping) decreased due to the reduced delay time of vehicle volume in each lane. The analysis using SIDRA Intersection 6.1, by comparing the value in 2010 and 2011, showed a reduction in fuel consumption by more than 74.24%, and hydrocarbon emissions had reduced by about 71.21% compared to the hydrocarbon emissions in 2010. For carbon dioxide, 74.42% has been deducted, followed by carbon monoxide at 47.70% and oxide of nitrogen is approximately 48.32%.
The gaseous emission value, cost estimation, and fuel consumption were poor during the construction activities. This result was supported by Sharma et al. 32, who found that the resultant effects of the idling of motor vehicles contributed to fuel losses, gaseous emission release, and monetary losses but could worsen the air quality and contribute to adverse health effects on wellbeing. Further, Goel and Kumar 33 reported that the high fuel consumption and the release of gaseous emission came from the high vehicular activities, traffic congestion, and the effect of red signal phase at the signalised traffic intersections. Meanwhile, Kwak et al. 34 found that the signalised traffic intersections contributing to lower on-road air quality were from low vehicle speeds with frequent acceleration of traffic congestion. In this stage (during construction activities), vehicles with more than two axles were recorded significantly compared to other years. This intersection was the busiest intersection linked with the main highway of Route 1 that connected between three states of Pulau Pinang, Kedah and Perak. To minimise the fuel consumption, gaseous emission value, and cost consumption at the signalised traffic intersections, Thanker and Gokhale 35, Satiennam et al. 36, and Xu et al. 37 recommended the proper traffic management plan such as the regulation of speed, the maximum traffic flow, the synchronisation of signal and the restriction of certain types of vehicles. El-Hansali et al.38 reported that the CO concentrations could be reduced by 25.6% by restricting the speed limit. Besides, intelligent transportation systems (ITS) and floating car data (FCD) regulated traffic signals have been suggested to enhance efficiency and safety, decrease traffic congestion and pollution emission, and promote better environmental air quality.39, 40 Therefore, the well-managed road network in terms of development, operation, and maintenance needs to be improved for the well-being of the developing township.41
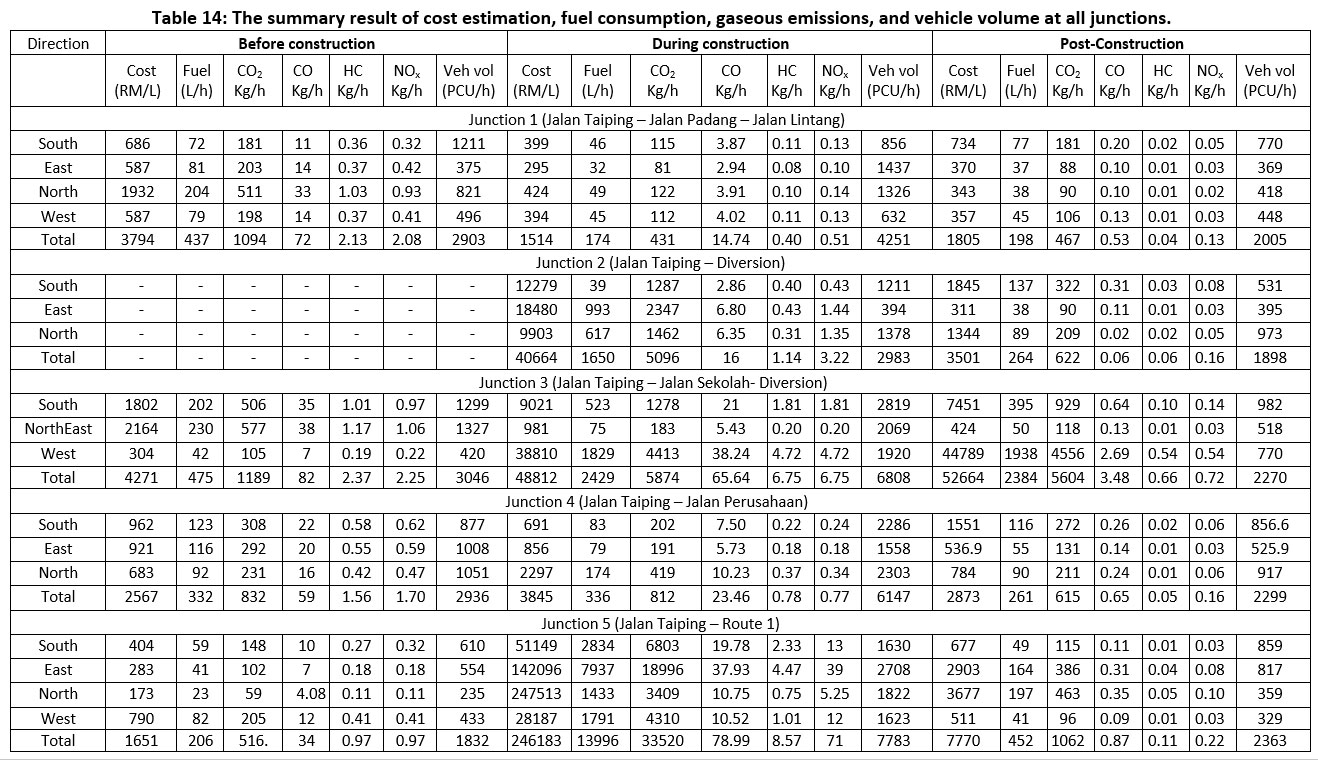 | Table 14: The summary result of cost estimation, fuel consumption, gaseous emissions, and vehicle volume at all junctions.
|
Conclusion
The number of vehicles that pass along Jalan Taiping per unit hour has been the primary factor contributing to the increasing value of vehicle emissions. Human activities are related to the variation of traffic flow patterns. For example, during construction, people still have to carry out their daily activities outside and hence choose to commute using their cars. In the developing town, the tendency to use public transport was lower than their vehicles; therefore, the number of cars increased. This is due to the low efficiency of the public transport in the developing town itself, coupled with disturbance by the activities to develop the town. In conclusion, the signalised intersection of Jalan Taiping-Route 1 recorded the highest emissions with 33520 kg/h of CO2, 78.99 kg/h of CO, 8.57 kg/h of HC, and 71 kg/h of NOx, during construction activities compared with other junctions. In the pre-construction stage, Jalan Taiping-Jalan Sekolah-Diversion (J3) was the most polluted junction in town with 5874 kg/h of CO2, 65.64 kg/h of CO, 6.75 kg/h of HC, and 6.75 kg/h of NOx. Jalan Taiping – Route 1 remained the most polluted junction following the commissioning phase beyond 2014.
Acknowledgement
This research data collection was funded by Universiti Sains Malaysia, PAWAM/60310035 and APC from EACAR Fund.
Conflict of Interest
The authors declare no conflict of interest.
Funding Source
This research data collection was funded by Universiti Sains Malaysia, PAWAM/60310035 and APC from EACAR Fund.
References
- QUARG. 1996; Airborne Particulate Matter in the United Kingdom. Third Report of the Quality of Urban Air Review Group. Department of Environment London.
- Hamilton R.S., Harrison R.M. (eds) Highway Pollution. 1991; Elsevier Science. London.
- Harrison R. M., Smith D., Piou C., Castro L. A. Comparative Receptor Modelling Study of Airborne Particulate Pollutants in Birmingham (United Kingdom), Coimbra (Portugal) and Lahore (Pakistan). Atmospheric Environment. 1997; 31(20): 3309-3321.
CrossRef - Ferguson M. Holman C. Atmospheric Emissions from the Use of Transport in the United Kingdom. The Effect of Alternative Transport Policies. World Wide Fund for Nature, Goldammer, 1990; 2: 57.
- Holman C. Control of Pollutant Emissions from Road Traffic. Chapter 13, In, Pollution: Causes, Effects and Control, Harrison R.M. (ed) 3rd edition. The Royal Society of Chemistry. Cambridge. 1996; 293-315.
- Harrison, R.M. (ed) Pollution: Causes, Effects, and Control. Royal Society of Chemistry. Cambridge. 1996.
- Keary J., Jennings S., O’Connor T. C., McManus B., Lee M. PM10 Concentration Measurements in Dublin City Urban Air Quality. Monitoring and Modelling. 1998; 3-18.
CrossRef - Fais A., Sturm P.J. Air Pollution and Road Traffic in Developing Countries. New Direction. Atmospheric Environment. 2000; 34: 4745-4746.
CrossRef - Clarke A.G., Tomlin A.S. The Atmosphere. In Understanding Our Environment. An Introduction to Environmental Chemistry and Pollution (3rd edition). R.M. Harrison (ed). The Royal Society of Chemistry. Cambridge. 1999; 10-70.
- Lawrence, M. G., Butler, T. M., Steinkamp, J., Gurjar, B. R., and Lelieveld, J.: Regional pollution potentials of megacities and other major population centers, Atmos. Chem. Phys., 7, 3969–3987, https://doi.org/10.5194/acp-7-3969-2007, 2007.
CrossRef - Ramli N.A, Ibrahim W.H.W. PM10 Concentration Measurements at Four Selected Sites in Semenanjung Malaysia: A Comparison between Sites with Different Backgrounds. In Proceeding ENVIRONMENT 2003 Pulau Pinang. 2003; 236-238.
- Ministry of Transportation. 2015; Retrieved April 2017 from http://www.mot.gov.my/en/Statistik%20Tahunan%20Pengangkutan/Transport%20Statistics%20Malaysia%202015.pdf
- Wong YK, Huang XHH, Cheng YY, Louie PKK, Yu ALC, Tang AWY, Chan DHL, Yu JZ. Estimating contributions of vehicular emissions to PM2.5 in a roadside environment: A multiple approach study. Sci Total Environ. 2019 Jul 1;672:776-788. doi: 10.1016/j.scitotenv.2019.03.463. Epub 2019 Apr 1. PMID: 30974367.
CrossRef - Mohd SHS, Mahmud M. Urban Air Pollutant from Motor Vehicle Emissions in Kuala Lumpur, Malaysia. Aerosol and Air Quality Research, 20: 2793–2804, 2020
CrossRef - Ibrahim W. H. W., Ramli N. A. Investigating Vehicle Emissions at Traffic Light Junction: Case Study at Parit Buntar Intersection. In Proceeding Ecological and Environmental Modelling Conference ECOMOD. Penang. 2001; 257-264.
- Ramli N. A., Ibrahim W. H. W. Quantifying Vehicles Emissions at Traffic Light Junction: Case Study at Intersections in a Developing Town. In Proceedings Southeast Asian Natural Resources and Environmental Management Conference SANREM, Sabah. 2002; Paper 1A-3.
- Pandey A., Mishra R.K., and Pandey G. Investigating Exhaust Emissions from In-Use Passenger Cars: Exploratory Analysis and Policy Outlook. Journal of Environmental Engineering/Volume 148 Issue 7 - July 2022, https://doi.org/10.1061/(ASCE)EE.1943- 7870.0002015, 2022.
CrossRef - Pandey A., Pandey G, and Mishra R.K. An in situ exploratory analysis of diesel cars' emission: a way forward on policy evaluation. Environ Sci Pollut Res Int. 2022 Dec;29(56):84434-84450. DOI: 10.1007/s11356-022-21719-4. Epub 2022 Jul 2.
CrossRef - Pandey A., Pandey G, and Mishra R.K. Tailpipe emission from petrol-driven passenger cars. Transportation Research Part D 44 (2016) 14–29
CrossRef - Krasenbrink A., Martini G., Wass U., et al. Factors Determining Emission in the WHO European Region. In Krzyzanowski M., Birgit K. D., Schneider J. Health Effects of Transport-related Air Pollution. 2005; Denmark: World Health Organization.
- Pandian S., Gokhale S., Ghoshal A. K. Evaluating the Effects of Traffic and Vehicle Characteristics on Vehicular Emissions Near Traffic Intersections. Transportation Research Part D. 2009; 14: 180-196.
CrossRef - Coelho M. C., Farias T. L., Rouphail N. M. A Methodology for Modelling and Measuring Traffic and Emission Performance of Speed Control Traffic Signals. Atmospheric Environment. 2005; 39(13): 2367-2376.
CrossRef - Mondal S., Arya V. K., Gupta A., Gunarta S. Comparative Analysis of Saturation Flow Using Various PCU Estimation Methods. Transportation Research Procedia. 2020; 48: 3153-3162.
CrossRef - Smit R., Brown A., Chan Y. Do Air Pollution Emissions and Fuel Consumption Models for Roadways Include the Effects of Congestion in The Roadway Traffic Flow? Environmental Modelling & Software. 2008; 23(10): 1262-1270.
CrossRef - Akcelik. R Operating Cost, Fuel Consumption and Pollution Emission Savings at A Roundabout with Metering Signal. In ARRB 22nd Conference. Canberra. 2006: 29 Oct - 2 Nov 2006.
- Akcelik R., Besley M. SIDRA Intersection User Guide. 2011: Akcelik &Associates Pty Ltd.
- Stokes R. W. Comparison of Saturation Flow Rates at Signalised Intersections. ITE Journal. 1988; 35-40.
- JKR. Arahan Teknik Jalan 8/86. A Guide to Geometric Design of Roads. 1986; JKR Malaysia.
- Shrivastava R.K., Neeta S. Geeta G. Air Pollution Due to Road Transportation in India: A Review of Assessment and Reduction Strategies. Journal of Environmental Research and Development. 2013; 8(1): 69-77.
- Andong R.F. Sajor E. Urban Sprawl, Public Transport, and Increasing CO2 Emissions: The Case of Metro Manila, Philippines. Environment, Development and Sustainability. 2017; 19(1): 99-123.
CrossRef - Rhode J., Wagner P., Ziemke T. The Effect of Speed Limits and Traffic Signal Control on Emissions. Procedia Computer Science. 2022; 201: 568-573.
CrossRef - Sharma N., Kumar P.P., Dhyani R., Ravisekhar C. Ravinder K. Idling Fuel Consumption and Emissions of Air Pollutants at Selected Signalised Intersections in Delhi. Journal of Cleaner Production. 2019; 212: 8-21.
CrossRef - Goel A. Kumar P. Zone of Influence for Particle Number Concentrations at Signalised Traffic Intersections. Atmospheric Environment. 2015; 123: 25-38.
CrossRef - Kwak K.H., Woo S.H., Kim K.H., Lee S.B., Bae G.N., Ma Y.I., Sunwoo Y. Baik J.J. On-Road Air Quality Associated with Traffic Composition and Street-Canyon Ventilation: Mobile Monitoring and CFD Modelling. Atmosphere. 2018; 9(3): 1-13.
CrossRef - Thaker P., Gokhale S. The Impact of Traffic-Flow Patterns on Air Quality in Urban Street Canyons. Environmental Pollution. 2016; 208: 161-169.
CrossRef - Satiennam T., Seedam A., Radpukdee T., Satiennam W., Pasangtiyo W. Hashino Y. Development of on-Road Exhaust Emission and Fuel Consumption Models for Motorcycles and Application Through Traffic Microsimulation. Journal of Advanced Transportation. 2017; 2017: 1-10.
CrossRef - Xu Z., Cao Y., Kang Y., Zhao Z. Vehicle Emission Control on Road with Temporal Traffic Information Using Deep Reinforcement Learning. IFAC-PapersOnLine. 2020; 53(2): 14960-14965.
CrossRef - El-Hansali Y., Farrag S., Yasar A., Malik H., Shakshuki E., Al-Abri K. Assessment of the Traffic Enforcement Strategies Impact on Emission Reduction and Air Quality. Procedia Computer Science. 2021; 184: 549-556.
CrossRef - Lin C., Gong B., Qu X. Low Emissions and Delay Optimisation for an Isolated Signalised Intersection Based on Vehicular Trajectories. PloS one. 2015; 10(12): 1-17.
CrossRef - Astarita V., Giofrè V.P., Guido G., Vitale A. A Single Intersection Cooperative-Competitive Paradigm in Real-Time Traffic Signal Settings Based on Floating Car Data. Energies. 2019; 12(3): 1-22.
CrossRef - Suprayitno H., Soemitro R.A.A. Preliminary Reflexion on Basic Principle of Infrastructure Asset Management. Jurnal Manajemen Aset Infrastruktur & Fasilitas. 2018; 2(1): 1-10.
CrossRef


