Impact of Different Land Use Management on Soil Enzyme Activities and Bacterial Genetic Fingerprints of North-Western Himalayas
Raj Deo Singh1 * , Arun Kumar2 , Ashok Kumar Patra3 , Sanjat Kumar Sahu4 , Minhaj Ahmad Khan2 and B S Bhople2
1
Indian Agricultural Research Institute,
New Delhi,
110012
India
2
Lovely Professional University,
Phagwara,
144411
India
3
Indian Institute of Soil Science,
Bhopal,
462038
Madhya Pradesh
India
4
Department of Environmental Sciences,
Sambalpur University,
768019
Orissa
India
http://dx.doi.org/10.12944/CWE.9.3.22
Copy the following to cite this article:
Singh R. D, Arunkumar K, Patra A. K, Sahu S. K, Khan M. A, Bhople B. S. Impact of Different Land Use Management on Soil Enzyme Activities and Bacterial Genetic Fingerprints of North-Western Himalayas. Curr World Environ 2014;9 (3) DOI:http://dx.doi.org/10.12944/CWE.9.3.22
Copy the following to cite this URL:
Singh R. D, Arunkumar K, Patra A. K, Sahu S. K, Khan M. A, Bhople B. S. Impact of Different Land Use Management on Soil Enzyme Activities and Bacterial Genetic Fingerprints of North-Western Himalayas. Curr World Environ 2014;9(3). Available from: http://cwejournal.org?p=580/
Download article (pdf)
Citation Manager
Publish History
Anthropogenic disturbance like agriculture are now getting more intensive in the Indian Himalayas to meet the demand for food and fodder. Indian Himalayan region required more nutrient inputs, which consequently leads to decline in organic matter of soil. Agricultural inputs through chemical fertilizers and pesticides adversely affect the ecosystem (Yang et al., 2000). Microbes are very sensitive to changing environmental conditions and so are the efficient functional indicators of heath of the environment. Soil microbes mediate many biochemical reactions and communicate through biochemical signal to facilitate biogeochemical cycles (Kolter and Greenberg, 2006; Kibblewhite et al., 2008). Chief constituent of these reactions are soil microbial enzymes, which also insinuate the quality change in soil with respect to environmental and anthropogenic factors such as climate, temperature, fertilizer etc. Soil enzymes regulate the nutrient supply and catalyze several reactions including organic matter decompositions (Burns, 1983; Sinsabaugh et al., 1991) and nutrient cycling (Tabatabai, 1994; Dick, 1997). In addition, it responds swiftly to environmental signals and therefore the use of soil enzyme activities as soil quality indicator will reveal biological status of the soil (Melero et al., 2006; García-Ruiz et al., 2008). There is strong relationship between microbial diversity and soil functionality as microbes mediate most of the processes of soil. To assess the microbial diversity culture dependent techniques seems bias, as only 1-4 % of microbes can be cultivated in-vitro. The introduction of culture independent techniques such as RISA (Patreze et al., 2009), 16S DGGE (Acosta-Martínez et al., 2007; Campbell et al., 2009), T-RFLP (Yi et al., 2009; Wang et al., 2012), RAPD (Baymiev et al., 1999; Yang et al., 2000; Sharma et al., 2008) is quite helpful to understand the genetic makeup of soil. Random Amplified Polymorphic DNA (RAPD) has been widely used in species classification and phylogenetic analysis of plants (Elmeer et al., 2009), animals (Stepniak et al., 2002) and microorganisms (Araujo et al., 2004). RAPD analysis is highly useful technique to compare the land use systems as it can illustrates the variance in genetic composition or structure for similar type of soils due to environmental or anthropogenic change.
There is limited documentation on Indian Himalayas on the effect of land use systems on microbial biochemical indicators (Ghosh and Dhyani, 2005; Justin et al., 2012). The objective of the present study was to investigate the impact of different land use systems of similar soil type on soil enzymes and genetic fingerprints of soil microbes in the North-Western Himalayan region. The information generated on soil enzymes, microbial biomass carbon and RAPD markers assisted genetic fingerprints would be useful to evaluate the effect of different land use systems on soil biological health.
Materials and Methods
Study Site
Nine land use systems located in Almora region of Uttarakhand, India were selected for the study. Of this, four systems of completely different management practices (organic farming, soybean-wheat, maize-wheat, fodder crops) are located at the experimental farm, Hawalbagh (29° 36'N and 79°40'E at 1250 m above mean sea level) of Vivekananda Institute of Hill Agriculture, Almora and upland rice from Someshwar valley, which is 25 km away from the farm. The forestland use systems represent undisturbed oak (2400 amsl) and pine (1800 amsl) forest of Binsar wildlife sanctuary (29º37’ N and 79º20’ E) and deodar forest of Jageshwar (29.65°N 79.58°E). Detail of sample locations and some physiochemical characteristics are shown in Table 1.
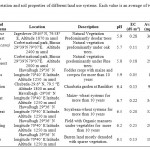 |
Table 1: Location, vegetation and soil properties of different land use systems. Each value is an average of two analyses Click here to View table |
Soil and Weather Characteristics
The parent material of these soils consists of mica, schist, slates, sand stone, and calcium deficient granite and seynite rocks (Singh et al. 2000). Genetically these soils come under climatogenic podsolized grey-brown forest soils. All the systems were having acidic soil reaction except the soils of cultivated fields, which were slightly acidic. The climate is sub temperate, characterized by moderate summer (May–June), extreme winter (Dec–Jan) and general dryness, except during the southwest monsoon season (June–Sept). During the sampling period in July 2012 the temperature was 30.1°C (max), 20.9°C (min) and average rainfall was 137.5 mm.
Soil Sampling
Three composite soil samples from each site of 0-15cm depth were collected in July 2012. For making one composite sample, five soil cores were taken and mixed. Like other workers (Patra et al. 2006) pseudo-replication approach of sampling was adopted. The field moist soil samples were kept stored in refrigerator at temperature less than 4oC for preserving the enzyme activities till the analysis were over. All chemical results are mean of triplicate analysis and expressed on oven dry basis. Soil moisture was determined after drying at 105°C for 24 h.
Soil Enzyme Activities
Dehydrogenase
Soil dehydrogenase activity was determined using the method of Klein et al. (1985) by the mixture of 0.2 ml of 3% triphenyltetrazolium chloride (TTC) solution and 0.5 ml of 1% glucose to 1 gm soil sample. Samples were incubated at 28o C for 24 hours and then 10 ml of methanol was added and again incubated at 28o C for 8 hours. The pull out triphenyl formazan (TPF) was measured by absorbance at 485nm.
Acid and Alkaline Phosphatase
Acid and Alkaline phosphatase activity was estimated calorimetrically using the method described by Tabatabai and Bremner (1969). For each soil, sample two sets of 1gm (2 mm sieved) soil were taken in 50 ml conical flasks. Out of these two sets, one set was used as control. 0.2 mL toluene and 4 mL of Modified Universal Buffer (MUB) at pH 6.5 (for acid phosphatase) and pH 11(for alkaline phosphatase) were added to all flasks. p- nitrophenyl phosphate (0.025 M) was added was used as substrate and samples were incubated at 37oC for one hour. After incubation, 1 ml of 0.5M CaCl2 and 4 ml of 0.5M NaOH were added and swirled for few seconds. The yellow color intensity of the filtrates were measure spectrophotometrically at a wavelength of 440 nm (blue filter). The amount of p-nitrophenol formed in each samples were calculated from the standard curve drawn. Acid phosphatase activity was expressed in terms of µg p-nitrophenol released per gram of soil per hour.
Nitrate Reductase
For soil nitrate reductase assay 5 ml of 0.1 M KNO3 solution was added to 5 g soil, incubated at 28 °C for 24 h and the amount of NO2– formed was estimated according to Roberg (1978)
Arylsulphatase
Arylsulfatase activity was estimated calorimetrically using the method described by Tabatabai and Bremner (1970). For each soil sample two sets of 1gm (2 mm sieved) soil were taken in 50 ml conical flasks. Out of these two sets, one set was used as control. Toluene 0.25 ml and 4 ml of acetate buffer at pH 5.8 were added to all flasks. p- nitrophenyl sulfate (0.025M) was added to samples as substrate and incubated at 37oC for one hour. After incubation, 1 ml of 0.5M CaCl2 and 4 ml of 0.5 M NaOH were added. In addition, 1 ml of p- nitrophenyl phosphate (0.025M) was added to remaining set (control) of the samples. The yellow color intensity of the filtrates were measure spectrophotometrically at a wavelength of 440 nm (blue filter). The amount of p-nitrophenol formed in each samples were calculated from the standard curve drawn. Arylsulfatase activity was expressed in terms of µg p-nitrophenol released per gram of soil per hour.
Phytase
Phytase activity was assayed by the method of Ames (1966). One gram sieved soil was placed in 15 ml capacity screw cap test tube. In samples, 100 M sodium acetate buffer (pH 4.5) and 1 ml of sodium phytate (1 mM) were added and incubated at 37°C for 1 h. The reaction was terminated by the addition of 0.5 ml 10% trichloroacetic acid (TCA) (CCl3COOH). Proteins precipitated by TCA were removed by centrifugation at 10,000 rpm for 10 minutes and the supernatant was analyzed for liberated inorganic P, using chlorostannous reduced molybdophosphoric blue colour method as described by Jackson (1973). One unit of phytase activity was defined as the amount of enzyme, which liberated 1 m mole Pi per minute at 37°C.
Soil Randomly Amplified Polymorphic DNA Analysis
Microbial Community DNA Extraction
The DNA was extracted using Power Soil DNA isolation kit (Mo Bio Laboratories Inc.) according to manufacture instruction. The soil DNA was loaded on 1 % agarose gel, run for 1 hour in horizontal electrophoresis unit (Biorad) with Tris-Borate-EDTA buffer at 80V to check the purity, and quantified by nanodrop.
Polymerase Chain Reaction (PCR) Amplification
PCR Reaction mixtures (25 µl) contains 2.5 µl of 10× dilution buffer 10pmol/reaction random primers, 200 µM of each dNTP, 1.0 U of PR DNA polymerase (Bangalore Genei, India), and 100 ng of purified soil DNA. Amplification was performed in a thermal cycler (Biorad) after a hot start at 94°C for 5 min, followed by 44 cycles consisting of 94°C for 1 min, 37°C for 1 min, and 72°C for 2 min, final extension of for 7 min at 72°C. Amplicons were resolved in 1 % agarose gel containing 0.5ug/ml ethidium bromide and run for 3 hours at 80 V with cooling.
Statistical Analysis
Two-way analysis of variance (ANOVA) and Duncan’s multiple range test (DMRT) for comparison of means were performed using software SPSS version 16. Unless otherwise stated, the level of significance referred to in the results is P < 0.05. Mean values by one way annova was subjected to principal component analysis (PCA) and hierarchical culturing by Wards method was performed by PAST 3.x statistical software. For RAPD amplified fragments were transformed into binary character matrix “1” for presence and “0” for absence of band using Total Lab 100 software (Clara Vision, France). The binary character matrices were assembled by the NTSYS-pc version 2.02 computer program (Rohlf, 2001). The dendrogram was constructed using the unweighted pairs group method with arithmetic average (UPGMA- Tree construction method). The pair wise association coefficients were calculated from the qualitative data matrix using Jaccard’s similarity coefficient.
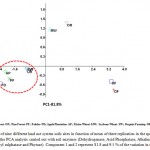 |
Figure 1: Ordination of nine different land use system soils sites in function of mean of three replication in the space defined by the PC1 and PC2 axis of the PCA analysis carried out with soil enzymes (Dehydrogenase, Acid Phosphatase, Alkaline Phosphatase, Nitrate Reductase, Aryl sulphatase and Phytase). Component 1 and 2 represent 81.8 and 9.5 % of the variation in the data respectively. Click here to View figure |
Result and Discussion
Soil Enzymes
Dehydrogenase activity was recorded highest in deodar forest soil while the fodder crop and apple plantation showed significantly lower values (Table 2). Contrary to inorganic fertilizer long term used agricultural farms, organically maintained agricultural farm exhibits higher DHA activity (11.6 µg TPF g-1 soil h-1). Agro-ecosystems in an average of one way annova mean found to have 36.54 % less DHA activity in comparison to forest ecosystems. Dehydrogenase enzymes involves in electron transport systems of oxygen metabolism and requires an intracellular environment to express its activity and so considered as efficient indicator of overall microbial function (Samuel, 2010; Abellan et al., 2011; Defrieri et al., 2011). Our result are in agreement with Pandey et al. (2005), Kang et al. (2009), Abellan et al. (2011) for forest soils and with Gaind and Nain (2011), Maurya et al. (2011) for agricultural soil and with Styla and Sawicka (2009) for orchid soil. Forest soil exhibits significantly higher DHA activity as compared to the cultivated lands. Generally, forest systems contain higher organic matter due to the regular litter availability and subsequent decomposition. Soil organic matter affects biochemical, chemical, biological and physical soil properties that control soil microbial activity (Dou et al., 2007). Long-term fertilizer used cultivated systems significantly affects the soil dehydrogenase activity (Doran et al., 1987). High dose or repeated use of fertilizers may restrict the microbial growth and consequently decrease the dehydrogenase activities in soil (Kozanecka et al., 1996; Kucharski et al., 1996). In our study the organic farm soil exhibits 40.5 % higher dehydrogenase activity as compared to other agricultural management practice soil similar to the results of García-Ruiz et al. (2008) which shows the positive impact of organic farming on soil dehydrogenase.
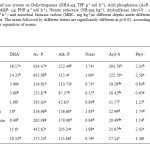 |
Table 2: Impact of Land use system on Dehydrogenase (DHA-µg TPF g-1 soil h-1), Acid phosphatase (AcP- µg PNP g-1 soil h-1), Alkaline Phosphatase (AlkP- µg PNP g-1 soil h-1), Nitrate reductase (NR-mg kg-1), Arylsulfatase (Aryl-S - µg PNP g-1 soil h-1), Phytase (Phyt- μg Pi g-1 h-1 ) and microbial biomass carbon (MBC- mg kg-1)at different depths under different land use systems in central Himalayan region. The mean followed by different letters are significantly different at p<0.05, according to DMRT (Duncan’s Multiple Range Test) for separation of means. Click here to View table |
Similarly acid phosphatase activity was also recorded higher in undisturbed deodar forest (914.4 µg PNP g-1 soil h-1) followed by oak forest (635.9 µg PNP g-1 soil h-1). Comparatively the cultivated soil exhibits lesser acid phosphatase activity: Fodder < Soybean–wheat < Upland rice < Apple plantation < Maize-wheat < Organic farm. Alkaline phosphatase was also found to vary significantly (p < 0.05) among the different land use systems. Alkaline phosphatase activity were recorded highest in oak forest (315.4 µg PNP g-1 soil h-1) followed by deodar forest (252.4 µg PNP g-1 soil h-1). Apple plantation soil shows significantly lower values of alkaline phosphatase (42.6 µg PNP g-1 soil h-1) than acid phosphatase (295 µg PNP g-1 soil h-1) values. Average mean values of alkaline phosphatase were 42.2% lesser in cultivated lands than natural forest systems. Acid and alkaline phosphatase activities were 31.8% and 42.3% higher in organic farm soil respectively in comparison to other long-term inorganic fertilizer maintain soil. Lower values of acid phosphatase in cultivated soils compared to forest soil was found in our studies was in agreement with Acosta-Martınez et al. (2007) and Shi et al. (2008). Acid phosphatase is one of the enzymes regulating phosphorus availability in soil and plant roots are the major producer of acid phosphatase (Speir and Cowling, 1991). Acidic nature of the studied soil is the contributing factor for the higher values of acid phosphatase as compared to alkaline phosphatase as phosphomonoesterases are pH sensitive enzymes most sensitive to soil pH (Lemanowicz, 2011). Higher values of acid phosphatase in acidic soil were also reported elsewhere (Dick et al., 2000; Wang et al., 2012). Lower values of acid phosphates in long term used cultivated ecosystem indicate the lesser potential mineralization of organic P as supported by studies of Huang et al. (2011). Our results for alkaline phosphatase were in agreement with Conn and Dighton (2000) and Ushio et al. (2010) that show positive impact of litter quality on the phosphatase enzyme activity as forest soil exhibits more alkaline phosphatase activities as compared to agricultural systems. The apple plantation and fodder crop soil showed lesser values of alkaline phosphatase suggesting lesser microbial activity in soil as microorganisms are major source of alkaline phosphatase in soil (Aseri et al., 2009).
Nitrate reductase activity was significantly (p < 0.05) higher in organic farm (1.98 mg kg-1) and maize wheat cultivated system (1.83 mg kg-1). The organic farming have regular dressing of pine bedded FYM, which might have influenced the process of dissimilatory nitrogen reduction (Tiedje et al., 1982). Nitrate reductase activity is efficient indicator of alteration in nutrient status in soil as reported by earlier studies by Ramana et al. (2008) and Poobathiraj et al. (2012). Forest soils experience anaerobic condition due to the continuous litter fall, which enhance nitrate reductase activities (Rutting et al., 2011). Similarly in our study forest soil showed higher nitrate reductase activity after organic farm and maize wheat farm systems. Many studies have been reported on impact of pH, soil organic matter, moisture and soil N on nitrate reductase activity (Gamble et al., 1977; Davidson and Stahl, 2000; Patra et al., 2006). However, there are not enough data available in the literature to make a comprehensive analysis on impact of land use on dissimilatory nitrate reductase activity.
The average arylsulfatase activity ranged from 11.57 µg PNP g-1 hr-1 in apple plantation soil to 222.78 µg PNP g-1 hr-1 in case of oak forest soil. Except oak and deodar soils, all the other ecosystem soil showed significantly reduced arylsulfatase activity followed in order: Upland rice > Maize-wheat farm > organic farm ≈ Soybean-wheat ≈ Pine forest ≈ Fodder crops > Apple Plantation farm. Mineralizations of sulfur were carried out by soil arylsulfatase (Tabatabai, 1994) and it catalyzes the hydrolysis of ester sulfate bonds. Arylsulfatase enzyme are highly sensitive to soil properties and management practices as observed by Bandick et al., 1999, Dick et al., 1988 and Frankenberger and Dick, 1983. Forest generally contains higher fungal biomass as reported by Arunkumar et al. 2013 and under acidic soil reactions enhances arylsulfatase activities due to its strong association with ergosterol (Balota et al., 2004) which is almost exclusively found in fungi (Newell et al., 1987). Similarly, in this study significantly higher values of arylsulfatase were recorded in oak and deodar forest soil in comparison to other cultivated lands.
The average phytase activity ranged from 0.84 μg Pi g-1 h-1 in pine forest to 2.58 μg Pi g-1 h-1 in case of oak forest. Inositol phosphatase (soil phytate) is the reservoir for organic P in soil (Rodríguez and Fraga, 1999) and hydrolysis by microbial phytases (Menezes-Blackburnace et al., 2013). Soil phytase effectively catalyzes the release of phosphate from phytate and phosphorylated compound (Kumar et al., 2013). Organic farming show higher phytase activity (2.03 μg Pi g-1 h-1) which indicates better P cycling abilities in organic amendments as compared to the inorganic fertilizer used cultivated systems which result in phosphorus immobilization.
Principal Component Analysis, Linear Regression and Hierarchical Clustering
The principal component analysis of soil enzymes and number of polymorphic bands by RAPD shows segregation of nine different land use systems. The first principal component axis (PC1) explained 81.8% while the second principal component axis (PC2) explained 9.5% of the variance in the data (Fig 3). Except maize-wheat and organic farming plot soils other cultivated ecosystem soils (soybean wheat, upland rice, fodder, apple system) were segregated to left of the PCA plot and while oak and deodar forest system soils segregated on lower right of the plot. The highest positive loading score of PC1 is for deodar soil (3.48) followed by deodar soil (3.34), organic farm soil (1) and maize-wheat soil (0.22). Our results were in accordance with Silva et al. 2012 that principal component analysis distinguish agricultural soil from forest soil based biological properties. In a similar study by Gonnety et al. (2012) different land use system are clustered based on enzymatic analysis on PCA plot and their study also suggest the use of soil enzymes for monitoring soil quality. Linear regression plot shows the positive and significant correlation between the soil enzymes and microbial biomass carbon, which suggest the sensitivity of these enzymes as ecological indicators of soil quality (Fig 2). These data are consistent with Moscatelli et al. (2005) that soil biological and biochemical indicator such as soil enzymes when linked with its origin carbon source i.e. microbial biomass carbon can be an efficient indicator for detecting deterioration of soil quality. Soil dehydrogenase activity highly correlated with microbial biomass carbon (Y = 0.022x – 4.429, r2 = 0.824, P < 0.05, n = 9×3=27) in comparison to other enzymes. Hierarchical clustering by Ward’s method of soil enzymes of different land use system clusters the land use systems in two major clusters. The deodar forest, oak forest and organic farm soil in one major cluster, however the pine forest and all other cultivated land soils were clustered in other major cluster. Our results are in accordance with Masto et al. 2012 that soil enzymes are highly sensitive and have the ability to cluster the different land use or treatments with respect to soil quality.
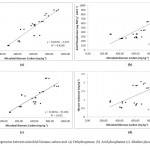 |
Figure 2: A,B,C,D Click here to View figure |
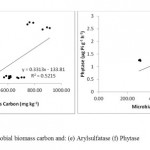 |
Figure 2: E, F Click here to View figure |
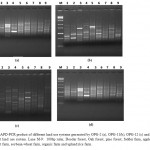 |
Figure 3: RAPD-PCR product of different land use systems generated by OPG-2 (a), OPG-11(b), OPG-12 (c) and OPG 14 (d) for different land use system. Lane M-9: 100bp ruler, Deodar forest, Oak forest, pine forest, fodder farm, apple plantation, maize-wheat farm, soybean-wheat farm, organic farm and upland rice farm. Click here to View Figure |
Soil Random Amplified Polymorphic DNA Analysis
RAPD analysis showed high polymorphism between the samples. In this study, 8 primers were used to analyze the soil microbial DNA profiles, 4 produced well defined bands (Table 4). A total of 148 bands were amplified, of which 65 bands were polymorphic (56 %). Figure 2 showed amplification profile of soils under different land use system by primer OPG-2, OPG-11, OPG-12 and OPG-14. Polymorphism in metagenomic DNA was used for clustering land use system by unweighted pairs group method with arithmetic average. Cluster analysis resulted in a dendrogram with four main clusters (Fig 3). Cluster I included oak forest soil and organic farming. Pine forest and fodder are grouped in cluster II. Cluster III included deodar forest and soybean-wheat and Cluster IV contained maize-wheat and upland rice. By observing dendrogram we can make out that samples of oak forest and organic farming (0.258) are more genetically closely related and sample Apple Plantation were showing very less similarity with other samples. Sub cluster-2 consist of samples of pine forest and fodder (0.192) which are closely related with each other and subcluster-3 consist of deodar forest and soybean-wheat (0.139) which are showing more similarity with each other, whereas subcluster-4 consist of samples of maize-wheat and upland rice (0.172) showing more similarity with each other. Distance matrix was used to make out the similarity value in between the samples. The genetic similarity based on RAPD has been presented in form of Jaccard similarity coefficient in Table 3. The average Jaccard similarity obtained was 0.105 with the range of 0.01-0.258. Very less values of similarity index indicate that these ecosystems have very high diverse microhabitats and microbial community structure in this region. Similarity index suggest that the studies land use systems have high variation in genetic composition with the average genetic similarity of 0.128. RAPD is cost effective and rapid technique to study the soil microbial communities and to understand the linkage between soil micro flora community structure and soil physio-chemical characteristics (Yang et al., 2000; Dexter et al., 2010). The oak forest and organic farm soil were clustered in one group, which indicates similar genetic makeup among them and indicates that long-term organic farming may improve soil quality. For instance in a similar study by Reganold et al. (2010) proved that organic farming soil posses higher microbial diversity than conventional farming soil by soil DNA using microarray technology. Use of agriculture chemicals and chemical fertilizer has negative impact on DNA sequence diversity of soil microbial community. Our results are in agreement with Yang et al. (2000) as less polymorphic bands were observed in agro ecosystems where agriculture chemical are used frequently as compared to undisturbed forest ecosystem.
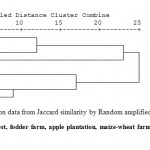 |
Figure 4: Dendrogram (UPGMA) based on data from Jaccard similarity by Random amplified polymorphic DNA analysis.1-9:- Deodar forest, Oak forest, pine forest, fodder farm, apple plantation, maize-wheat farm, soybean-wheat farm, organic farm and upland rice farm. Click here to View figure |
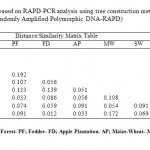 |
Table 3: Distance Similarity matrix based on RAPD-PCR analysis using tree construction method-Unweighted Pair Group Method with Arithmetic Mean- UPGMA. (Randomly Amplified Polymorphic DNA-RAPD) Click here to View table |
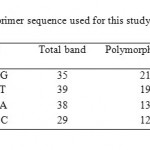 |
Table 4: Names and random primer sequence used for this study Click here to View table |
This study has shown that changing land use and cropping history have intense impact on soil biochemical indicators. The RAPD markers found to be an effective measure of soil biological health when linked with soil biochemical indicators. Soils under forest ecosystem showed invariably highest values of all the parameters and in contract, cultivated systems showed lower values of soil enzymes investigated in this experiment. The high deposition of leaf litters and no anthropogenic disturbances are perhaps the major reasons for such observation in forest soil as compared to cultivated soil where long term use of agricultural chemical may cause unfavorable conditions to soil health. RAPD analysis showed high polymorphism between the samples and thus proved to be an efficient indicator of change in land use pattern. Further studies are needed to identify the differences in genetic composition of different soil that will perk up our knowledge on sustainable agriculture in true sense.
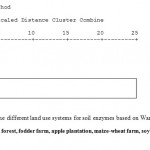 |
Figure 5: Dendogram of nine different land use systems for soil enzymes based on Ward’s hierarchical clustering methods 1-9:- Deodar forest, Oak forest, pine forest, fodder farm, apple plantation, maize-wheat farm, soybean- wheat farm, organic farm and upland rice farm. Click here to View figure |
Acknowledgement
We thank the Director and Dean and Joint Director (Education), Indian Agricultural Research Institute, New Delhi, and Department of Science and Technology (DST), Government of India, for providing necessary financial support for carrying out this work.
References
- Abellan M.A., Baena C.W., Morote F.A.G., Picazo M.I.C, Perez D.C. and Lucas-Borja M.E., Forest System, 20,379-388 (2011).
- Acosta- Martinez V., Cruz L., Sotomayor-Ramírez L. and Pérez-Alegría., Applied Soil Ecology 35,35-45 (2007).
- Araújo W.L., Angellis D.A. and Azevedo J.L., Brazilian Archives Biology Technology, 47, 375-380 (2004).
- Arunkumar K., Singh R.D., Patra A.K. and Sahu S.K, International Journal of Current Microbiology Applied Science, 2, 325-338, (2013)
- Ames B.N., Method in Enzymology, 8, 115-118 (1966).
- Aseri G.K., Jain N. and Tarafdar J.C., American-Eurasian Journal of Agriculture & Environmental Science, 5,564-570 (2009).
- Balota E.L., Kanashiro M., Filho A.C., Andrade D.S. and Dick R.P., Brazilian Journal of Microbiology, 35,300-306 (2004).
- Bandick A.K. and Dick R.P., Soil Biology and Biochemistry, 31, 1471-1479 (1999).
- Baymiev A.K., Chemeris A.V. and Vakhitov V.A., Russian Journal of Genetics, 35,1387-1393 (1999).
- Burns R.G., Extracellular enzyme-substrate interactions in soil. In: Slater, J.H., Whittenbury, R., Wimpenny, J.W.T. (Eds.). Microbes in their Natural Environments pp 249-298 (1983).
- Campbell J.H., Clark J.S. and Zak J.C., Microbial Ecology, 57,261-266 (2009).
- Conn C., and Dighton J., Soil Biology and Biochemistry, 32, 489-496 (2000).
- Davidson T.E. and Stahl M., Soil Science Society of America Journal, 64,1129–1136 (2000).
- Defrieri R.L., Sarti G., Tortarolo M.F., Escobar–Ortega J., García de Salamone I., D´Auria F. and Effron D., Journal of Soil Science Plant Nutrition, 11, 111-124 (2011).
- Dexter K.G., Penningto T.D. and Cunningham C.W., Ecological Monograph, 80, 267-286 (2010).
- Dick R.P., Biological Indicators of Soil Health. CAB International, Wallingford, pp 121-156 (1997).
- Dick R.P., Rasmussen P.E. and Kerle E.A., Biology and Fertility and Soils, 6,159-164 (1988).
- Dick W.A., Cheng L. and Wang P., Soil Biology and Biochemistry, 32, 1915-1919 (2000).
- Doran J.W., Biology of Fertility and Soils, 5, 68-75 (1987).
- Dou F., Wright A.L. and Hons F.M., Soil and Tillage Research, 94, 530-536 (2007).
- Elmeer K.M., Gallagher T.F. and Hennerty M.J., African Journal Biotechnology, 8, 3219-3222 (2009)
- Frankenberger W.T. and Dick W.A., Soil Science Society of America Journal, 47, 945-951 (1983).
- Gaind S., Nain L., World Journal of Agriculture Science, 7, 480-488 (2011).
- Gamble T.N., Betlach M.R. and Tiedje J.M., Applied Environment Microbiology, 33, 926–939 (1977).
- García-Ruiz R., Ochoa V., Hinojosa M.B. and Carreira J.A., Soil Biology and Biochemistry, 40, 2137-2145 (2008).
- Ghosh P. and Dhyani P.P., Tropical Ecology, 46, 173–181(2005).
- Gonnety J.T., Assemien E.F.L., Guei A.M., Dri A.A., Djina Y., Kone A.W. and Tondoh J.E., Biotechnology, Agronomy, Society and Environment, 16,478-485 (2012).
- Huang W., Liu J., Zhou G., Zhang D. and Deng Q., Biogeosciences, 8, 1901-1910 (2011).
- Justin G.K., Singh R.D., Patra A.K. and Arunkumar K., Acta Agriculturae Scandinavica, Section B - Soil & Plant Science, 63, 200-205(2012).
- Kang H., Kang S. and Lee D., Ecological Research, 24, 1137-1143 (2009).
- Kibblewhite M.G., Ritz K. and Swift M.J. Philosophical Transactions of the Royal Society B: Biological Sciences, 363, 685-701 (2008).
- Klein D.A., Sorensen D.L. and Redente E.F., Soil reclamation processes: microbiological analysis and applications. Marcel Dekker pp 141–171(1985).
- Kolter R. and Greenberg E.P., Nature, 441, 300–302 (2006).
- Kozanecka T., Rekosz-Burlaga H. and Russel S., Roczn Glebozn, 47, 75-84 (in Polish) (1996).
- Kucharski J., Cieüko Z., Niewolak T. and Niklewska-Larska T., Acta Academiae Agriculturae ac Technicae Olstenensis, 62, 25-35 (in Polish) (1996).
- Kumar D., Rajesh S., Balashanmugam P., Rebecca L.J. and Kalaichelvan P.T., Journal Modern Biotechnology, 2, 46-52 (2013).
- Lemanowicz J. Polish Journal of Agronomy, 4, 12–15 (2011).
- Masto R.E., Ahiwar R., George J., Ram L.C. and Selvi V.A., Open Journal of Soil Science, 1, 8-15 (2011).
- Maurya B.R., Singh V. and Dhyani P.P., International Journal of Soil Science, 6, 238-248 (2011).
- Melero S., Porras J.C.R., Herencia J.F. and Madejon E., Soil and Tillage Research, 90, 162-170 (2006).
- Menezes-Blackburn D., Jorquera M.A., Greiner R., Gianfreda L. and Maria L.M., Critical Reviews in Environmental Science and Technology, 43, 916-954 (2013).
- Moscatelli M.C., Lagomarsino A., De Angelis P. and Grego S., Applied Soil Ecology, 30, 162–173 (2005).
- Newell S.Y., Miller, J.D. and Fallon R.D., Mycologia, 79, 688-695 (1987).
- Pandey H.N., Ralte V., Barik S.K., Tripathi R.S. and Swapna D.P., Acta Oecologica 28, 163–172 (2005).
- Patra A.K., Chhonkar P.K. and Khan M.A., European Journal of Soil Biology, 42, 173-180 (2006).
- Patreze C.M., Paulo D., Martinelli A.P., Cardoso E.J.B. and Tsai S.M., Symbiosis 48, 164-172 (2009).
- Poobathiraj K., Palani N. and Ramesh A.C., Journal of Biosciences Research, 3, 106-111 (2012).
- Ramana S., Ramesh P., Panwar N.R. and Singh A.B., Indian Journal of Plant Physiology, 13, 2-3 (2008).
- Reganold J.P., Andrews P.K., Reeve J.R., Carpenter-Boggs L., Schadt C.W., Alldredge J.R, Ross CF, Davies N.M. and Zhou J., PLoS One 5, e12346 doi:10.1371/journal.pone.0012346, (2010).
- Roberg M.R., Methodology of soil enzyme measurement and extraction, in: R.G. Burns (Ed.), Soil Enzymes, Academic Press, London, p. 350 (1978).
- Rutting T., Boeckx P., Muller C. and Klemedtsson L., Biogeosciences, 8, 1779–1791 (2011).
- Samuel A.D., Research Journal of Agricultural Science, 42, 306-310 (2010).
- Sharma N., Sundersan Y., Sharma R. and Singh G., Current Science India, 94, 1058-1061 (2008).
- Shi Z.J., Lu Y., Xu Z.G. and Fu S.L., Plant Soil Environment 4, 341–346 (2008).
- Silva C.F., Pereira M.G., Miguel D.L., Feitora J.C.F., Loss A., Menezes C.E.G. and Silva E.M.R., Revista Brasileira De Ciencia Do Solo, 36, 1680-1689 (2012).
- Singh R.D., Ghosh B.N., Prakash V., Bisht J.K. and Gupta H.S., Soil Management for Agricultural Production in N-W Himalayas. VPKAS. Indian Council of Agricultural Research pp 11 (2000).
- Sinsabaugh R.L., Antibus R.K. and Linkins A.E., Agriculture, Ecosystems & Environment, 34, 43-54 (1991).
- Speir T.W. and Cowling J.C., Biology and Fertility Soils, 12, 189-194 (1991).
- Stepniak E., Zagalska M.M. and Oewitonski M., Journal of Applied Genetics, 43, 489-499 (2002).
- Styla K. and Sawicka A., Agronomy Research, 7, 855-864 (2009).
- Tabatabai M.A. and Bremner J.M., Soil Biology Biochemistry, 1, 301–307 (1969).
- Tabatabai M.A. and Bremner J.M., Soil Science Society of America, Proceedings, 34, 225-229 (1970).
- Tabatabai, M.A. Soil Enzymes. In Methods of Soil Analysis, SSSA Book, Series No.5. Soil Science Society of America, Madison, Wi. pp: 775-883 (1994).
- Tiedje J.M., Sexstone A.J., Myrold D.D. and Robinson J.A., Antonie van Leeuwenhock, 48, 569-583 (1982).
- Ushio B.M., KanehiroKitayama and Teri C.B. Pedobiologia 53, 227–233 (2010).
- Wang S., Gonzalez Perez P., Ye J. and Huang D.F., World Journal of Microbiology & Biotechnology, 28, 493-503 (2012).
- Yang Y.H., Yao J. and Hu S., Microbiol Ecology, 39, 72-79 (2000).
- Yi H., Kim H.J., Kim C.G., Harn C.H., Kim H.M. and Park S., Journal of Plant Biology, 52, 577-584 (2009).


