Seasonal Variations and Assessment of Water Quality of Nagchoon Pond of Khandwa District (M. P.) India
Saroj Mahajan1 * and Dilip Billore2
1
Government Maharani Laxmi Bai girls P.G. College Indore,
(M.P.),
India
2
Government Mundi College Khandwa,
(M.P.),
India
http://dx.doi.org/10.12944/CWE.9.3.33
Copy the following to cite this article:
Mahajan S, Billore D. Seasonal Variations and Assessment of Water Quality of Nagchoon Pond of Khandwa District (M. P.) India. Curr World Environ 2014;9 (3) DOI:http://dx.doi.org/10.12944/CWE.9.3.33
Copy the following to cite this URL:
Mahajan S, Billore D. Seasonal Variations and Assessment of Water Quality of Nagchoon Pond of Khandwa District (M. P.) India. Available from: http://www.cwejournal.org/?p=7115
Download article (pdf) Citation Manager Publish History
Water is a critical issue for the survival of all living organisms. Water is the basic and primary need of all vital life processes and it is now well established that the life first arose in aquatic environments. Ever since the pre-historic times man has been intimately associated with water, and the evidences of past civilization that all historic human settlements were around inland freshwater recourses has conclusively proved it. Water is the basis of life, a universal solvent and one of the most precious commodities required for survival of any form of life. Singh et.al. (2006).Wetzel (1975) defined ‘Limnology’ as Study of the functional relationship and productivity of fresh water affected biotic communities by the physical, chemical and biotic environmental factors. Limnological investigation on water bodies were aimed to assess the deterioration of water quality due to pollution. The statistical techniques to interpret the data of various aquatic habitats were also used by Somashehara Rao (1990). Dnembare and ponde(1997).The correlation analysis method is very useful tool for assessing the water quality parameters. Limnological on ponds and reservoirs is carried out like Adefemi, et.al. (2007) worked on the physico-chemical condition of a dam in Nigeria and showed the level of significance between different physico-chemical state variable. Limnological features of manmade lakes were analyzed and observed by Ayoade, et.al. (2006). Daily physico-chemical dynamics of Sicmianowka reservoir lies in north eastern Poland was studied by Jcktierynczuk- Rudezyk . E; et.al. (2002). Khanna,et.al. (2000) analyzed the abiotic factors of a pond at Hardwar.
Study Area
The climate of the Khandwa district is pleasant and healthy the district fall in drier part of India. (Fig. No. 1) Annual rainfall 980.75 mm. distributed an over 86 rainy days. The maximum temperature has been recorded in the month of May is 42°C and minimum temperature has been recorded in the month of December 10°C. The ecoclimate of the area is semiarid, second-degree mega thermal type, of summer concentration with winter water deficit (Sharma, 1976).
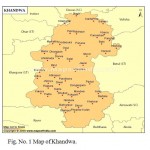 |
Figure 1: Map of Khandwa. Click here to View figure |
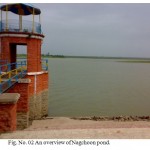 |
Figure 2: An overview of Nagchoon pond Click here to View figure |
Material and Methods
Sampling and laboratory analysis Water samples were collected from all four sampling stations from July 2008 to june 2010. Monthly samples of sub-surface water in triplicate were collected during first week of each month in the early hours of the day (7 a.m. to 9 a.m.). Iodine treated double Stoppard polyethylene bottles were used for collection of water samples.( Fig. No.02) Some of the physico-chemical characteristics of water including air and water temperature, determined using mercury thermometer, pH were determined using digital pH meter, transparency through Sechidisc,While dissolved oxygen, free carbon dioxide, total alkalinity, total hardness, calcium and magnesium, chlorides,were analyzed using titrimetric method other parameters including turbidity, electrical conductivity, nitrite nitrogen, sulphates, phosphates by spectrophotometer sodium and potassium were analyzed by flame photometer in the laboratory within the 6 to 8 h .
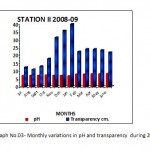 |
Figure 3: Monthly variations in pH and transparency during 2008-09 Click here to View graph |
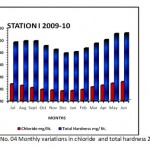 |
Figure 4: Monthly variations in chloride and total hardness 2009-10 Click here to View graph |
Result and Discussion
Water is a prime natural resource, so for conservation and management basic human needs appropriate planning, development and management. Therefore, it is necessary to study the physico- chemical characteristics of water and significant in monitoring the water quality, yet the Physico-chemical conditions are primary concerns. The quality of water is designated as per its, physico-chemical characteristics.
Temperature is one of the essential and driving variable in the environment, since it influence the growth and distribution of flora, fauna of an aquatic ecosystem. It also play crucial role in physico-chemical and metabolic behavior of an aquatic ecosystem. The Nagchoon pond being a shallow water body the water temperature changes according to air temperature. Observations on monthly fluctuation in water temperature recorded that the maximum water temperature recorded 39.00 OC in the month of June at station IV in the first year of study 2008-09. In the second year of study year 2009-10 recorded, the maximum water temperature 39.10 O C in the month of may at the station IV. The minimum water temperature was recorded 8.5 OC at station III during the month of January year 2008-09. While, during the year 2009-10 the minimum water temperature was recorded 9.8 O C at station II in the month of January. During rainy months decline in the water temperature.
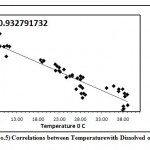 |
Figure 5: Correlations between Temperature with Dissolved oxygen 2008-09 Click here to View graph |
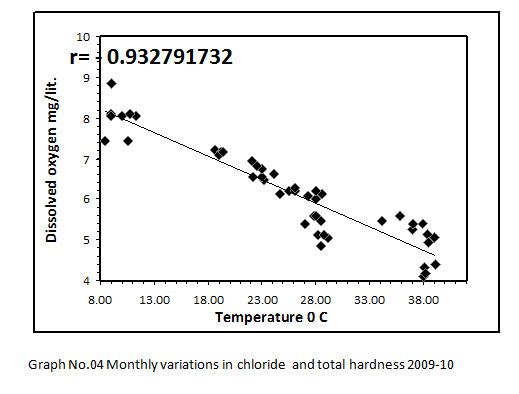 |
Figure 6: Correlation between Temperatures with Dissolved oxygen 2009-10. Click here to View graph |
Summer season > Rainy season >winter season. (Both study year)
Air and water temperatures observed to go more or less, hand in hand in the present study, suggesting that water temperature governed by the atmospheric temperature. Shrivastave (1996), Jain (2008), Garg (2009), were also recorded same investigations on reservoirs and lakes of india.
Water alkaline throughout the study of first year whereas in the second year of study in the month of October it was neutral. The monthly variations of pH and most of the water is alkaline in nature due to presence of carbonates and bicarbonates of alkaline earth metals. The present investigation pH were ranged from 7.10 (December) to 8.80 (June) during first year of study period (2008-09) while, during second year of study period 7.05(November) to 8.28(June) (2009-10).see the (Graph No.03) Mahajan and kanhere (1995), Rasool et.al. (2003) reported that the alkaline pH is favorable for planktonic growth and indicate unpolluted nature of water. Factor like air temperature bring about the change in pH. This suggested by Ramakrishana N. (2003), reported that pH increased in summer due to increses bicarbonates in water similar findings recorded in water of Nagchoon pond. The water transparency speaks the trophic status of a water body.The present investigation of Secchi transparency recorded in ranged from 42.50 cm. to 11.00 cm. and maximum and minimum value showed in (Table No.I and II). Turbidity is a condition of water resulting from the presence of suspended matter in the water.The biological productivity, suspended non-living particles and watercolor, wind velocity rainfall and nature of bottom such factors mainly affect the transparency. Transparency inversely proportional to the turbidity of water. During the study period (July2008-June 2010), in the first year of study transparency, it was in July 11.00 cm. in January 42.00 cm. (2008-09) and in the second year of study 11.00 cm. in August and in January 42.50 cm. (2009-10).(GraphNo.03) Diwedi et.al.(2000), recorded the maximum value in winter season; may be explained because of minimum wind velocity and calmness of water and sedimentation of suspended matter. There data coincide with the observations of Shrivastava (1996), Diwedi et.al.(2000), Devaraju et.al.(2005)in naktara reservior.The maximum value of turbidity and minimum value of turbidity showed in (Table No.I and II) turbidity inversely proportional to transparency. The sources of substances producing turbidity are innumerable.Clay, silt, organic matter, plankton and other microscopic organisms cause turbidity in natural water. This has been recognized as a valuable limiting factor in the biological productivity of the water bodies. The value of turbidity recorded in the present investigation. Specific conductance, which is indicative of the total concentration of dissolved ions; it is a valuable tool in assessing water quality. The Specific conductance is proportional to the amount of dissolved substances. Specific conductivity measure the capacity of a substance or a solution to conduct electric current. In Nagchoon pond the specific conductivity ranged from 281 micro mohs to 178 micro mohs.The specific conductivity was found to fluctuatation between 108.00 micro mohs (September 2004) to 246.30 micro mohs in the Ramsagar reservior Garg, (2009). Falls within the range observed for Indian waters. Rawson (1960), regarded oligotrophic lakes to have conductivity values less than 100 micro mohs, intermediate lakes between 101 and 125 micro mohs, and eutrophic between 126 and 200 micro mohs.
Dissolved oxygen is the fundamental fuel of life in water. Dissolved oxygen is of great importance to all aquatic organisms .Among the chemical factors dissolved oxygen shows stratification at all stations throughout the both study year.In study pond D.O. show negative corelation with temperature, during both the study year (Graph No- 05 & 06)the data ranged from 9.04mg/lit.to 4.11 mg/lit. (Table No.I and II).
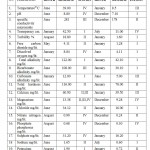 |
Table 1: Physico chemical analysis of water of Nagchoon Pond 2008-09. Click here to View table |
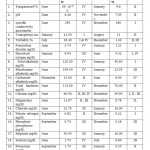 |
Table 2: Physicochemical analysis of water of Nagchoon Pond 2009-10. Click here to View table |
Winter season>rainy season>summer season (Both the year of study).
Dissolved oxygen concentration more than 5.00mg/lit. favors good growth of flora and fauna Das, (2000). In different Indian water bodies, the dissolved oxygen ranged from 3.41 to 6.21 mg/lit.in Seetadwar lake Tewari and Mishra, (2005), from 5.30 to 9.00 mg/lit.in Deoria tal Rawat and Sharma,( 2005) and from 3.00 to 6.00 mg/lit.in Kandhar dam Surve et.al. (2005).
Total Alkalinity measures the buffering capacity of water. The present study showed that in summer season, the maximum value was found while, in winter season the minimum values was found. (Table No.I and II) Summer season> rainy season> winter season (Both the year of study)
Total alkalinity level used as a criterion for assessing the nutrient status.Many workers in Indian water bodies also reported similar findings, Ramakrishana (2003), who argued that total alkalinity, is usually higher during pre-monsoon than monsoon. Radhika et.al.(2004) observed an increase in alkalinity during summer in Vellayani Lake, Kerala. Narayan et.al. (2007), Bajaj (2010) who argued that total alkalinity is usually higher during pre-monsoon than monsoon. Iqbal & Katariya (1995), reported that in the Upper Lake of Bhopal, the maximum total alkalinity was during monsoon and the minimum value was during summer. Chloride occurs naturally in all types of water in variable concentration. Indian inland water has been reported, chloride content in to show wide variations in amount as well as seasonal fluctuations. When present in higher concentration, it is usually, assigned to pollution by human agencies. See the (Graph No. 04) Several workers like Adoni( 1975) have reported that organic pollution influences the chloride concentration between 4 ppm and 10ppm indicate the purity of water . Observations in the context of the present study reveal that the concentration of chloride in Nagchoon pond ranged from16.00 mg/lit. (January) 34.12gm/lit.(June) in the study year, (2008-09) while, in the study year, (2009-10) 16.00 mg/lit. (January) 34.00 mg/lit. (June). (Table No.I and II) Chloride serves as an indicator of pollution by sewage Trivedi & Goel (1986). The water polluted in this pond due to organic matter of animal origin, sewage from adjacent villages and agricultural runoff. The hardness of water measure the capacity to precipetate soap. Calcium is exacorbated through leaching of limestone, Dolamite, Gypsum and Gypsiferous state. It is an important element influencing the flora of ecosystem. Seasonal fluctuation recorded in (Table No I & II) subsequently decreases during the rainy season with the minimum reaching in the winter similar report were observed by Kaushik and saxena (1991), suraj kund. Pathak and Mudgal (2005), in their study on Virla reservior, Keseray et.al.(2007), in Moghat reservior, Jain (2008), in their study Singwasa reservior Guna. The succession pattern of total hardness in the present investigation comes from (Table No.I and II) Summer season > Rainy season> winter season. (Both the year of study)
The area of study falls within the calcium rich water.The general acceptable limit of Calcium in waters is usually 75 mg /lit whereas its maximum permissible limit is 200 mg /lit.ICMR, (1975).
Magnesium is often associated with calcium in all kinds of waters, but its concentration remains generally lower than the calcium Venkatasubramani and Meenambal, (2007).Generally water bodies polluted by organic matter exhibited higher values. Nitrogen is present in the form of organic nitrogen compounds, ammonia, nitrates and as nitrite. In Nagchoon pond the nitrate nitrogen value ranged from 0.90 mg/lit. to 0.22 mg/lit. (Table No.I and II) The maximum concentration of nitrates, in the study area recorded in rainy season confirms that its sources are through the runoff waters, during rainy season the importance of incoming of nitrogen through the runoff water in the fresh water bodies. This is logical, in view of the fact that the nitrogen salts leached from soil more easily, while compaired in case of many other elements. In addition, minimum value in winter is due to consumption by biota. A similar explanation offered by Ramkrishana (2003) Telkhade et.al. (2008), Latha N. (2010).The main origin of Phosphate is due to the mechanical and chemical weathering of rocks. In rocks most of the phosphorus bound, are generally insoluble in water. The close perusal of data recorded from Nagchoon pond revealed that the phosphate-phosphorus ranged from 0.70 mg/lit. to 0.28 mg/lit.Phosphorus has often suspected to be the limiting nutrient in the primary production of fresh waters. Verudin (1972) called it a ‘Sub-optimum’ element, it being present in, most of the water in lesser quantities than required by the biotic community. A number of Indian workers like, Das(2000),Ramakrishna(2003),Pathak and Mudgal(2005),Telkhade(2008), Shinde et.al.(2010).
Sulphates are naturally occurring anions in all kinds of natural waters. Seasonal fluctuation showed that, in summer season showed higher value of sulphate and in winter month showed lower values. These findings reported by several workers Kadam et.al.(2005).Sodium is one of the important cation occurring naturally. The value of sodium in present study were ranged from 1.74 mg/lit. to 0.60 mg/lit.During both year of study period in Nagchoon pond the maximum value recorded in summer and minimum value recorded in rainy months. This investigation supported by Raj Narayan et.al. (2007), Garg et.al. (2009).Evaporation of water is a significant factor in increasing sodium level during summer season. Potassium a close relative of sodium, is usually the fourth ranking cations in fresh water. It is weathered from various feldspar but does not remain in solutions. The present investigation showed that potassium concentration high during rainy season and low during winter season. Similar, investigation coincides with the workers. Jain (2008) Garget al.(2009), Khajuria (2009).
The present study show detailed physico-chemical characteristics and quality of potable water of Nagchoon pond, it reveales that the assessment of water quality deterioration is due to various reasons. The summer, monsoon and winter seasons shows different seasonal fluctuations in various physico-chemical parameters. The water parameters indicate that the reservoir is rich in nutrients.The chloride; Nitrate and phsophate are found to be beyond permissable limit. On the basis of two years study of physicochemical characteristics it may be said that the nagchoon pond reaches towards eutrophication. The trophic status of water body warrants a proper conservation and management strategy and checks siltation process and removes weeds from pond time to time and improves quality of water there should be continuous monitoring of pollution level in pond.
Acknowledgement
The author thankful to University Grants Commission for awarding T.R.F, Teaching staff of Mata JiJa Bai College Indore,( M.P.) and teaching staff of S.N.P.G. College Khandwa. ( M.P.)
References
- Adefemi, O. Asaolu , S.S. and Olaofe , O: Assessment of the physic chemical status of water samples from majo dams in Ekiti state , Nigeria . Pakistan Journal of Nutrition. 6(6):657- 659. (2007)
- Adoni, A.D. and Chourasia. : Eutrophication and production studies of some lentic ecosystems around Sagar (M.P. ); Ann. Rept. MAB proj: 100-108.(1975)
- Ayoade, A. A. Fagade , S. O. and Adebisi, .A.A. (2006): Dynamics of limnologicals features of two manmade lakes in relation to fish production. African journal of Biotechnology, 5(10):1013-1021.(2006).
- Bajaj, S. : Seasonal changes of abiotic factors in the Adbandha pond of Durg. Research link. 71 Vol.VIII (12), 29-31.(2010).
- Devaraju, T.M. Venkatesha MG, Singh, S. : Studies on physicochemical parameters of Muddur lake with reference to suitability for aquaculture. Nat. Environ. Poll. Tech. 4: 287-290.(2005).
- Dnembare , A.J. and ponde, G. M. : correlation of ground water quality parameters. sonai area Maharastra poll. Res. 16: 188-190.(1997).
- Diwedi ,R.K. Khan, M.A. Singh, H.P. Singh, D.N. Tyagi ,R.K : Production Dynamics and fisheries development in Naktara Reservoir, Madhya Pradesh, India. J. Inland Fish. Soc. India 32: 81-86.(2000).
- Garg, R.K. Saksena, D.N. Rao, R.J.: Water quality and conservation management of Ram sager reservior, Datia, M.P. Journal of Environmental Biology; 30(5) 909-916.(2009).
- ICMR, : Manual of standards of quality for drinking water supplies, Special report series .No44, 2ndedition(1975):.
- Iqbal, and Katariya, H.C. : Physico-chemical analysis and water quality assessment of upper lake of Bhopal, International Journal of Environment and Pollution, 15 (7) pp. 504-509.(1995).
- Jain, R.: Physicochemical seasonal analysis of Singwsasa reservior Guna, M.P. ( India). J. Env. Research and Development. Vol. 3 No.I.191-197.(2008).
- JcktierynczukRudezyk.E.Gorniak,A.Zielinski,P.Dziemian,J : Daily dynamics of water chemistry in low land olyhumic dam reservoir. Polish. Journal of Environmental studies.11(5):521-526.(2002)
- Kadam, M.S. Nanware ,and Ambhore. : Physicochemical status of water in Asana River , Dist. Nanded, J. Comp. Toxical. Physiol, Vol. 2 ( I & II) 13-17.(2005).
- Kaushik, S. and Saxena, D.N. : Water quality of Suraj kund, Gwalior and its management. Env. Poll. and resources of land and water, 181-188.(1991).
- .Keshare, V. Mudagal, L.K. Khanna, D .R. Matta, Gagan. Kumar,D. :Study of Physico-chemical parameter for a reservior at Khandwa District (M.P.) Env. Cons. Journal ,8(3) : 127-132.(2007).
- Khajuria, M. and Dutta, S.P.S. : Physicochemical characteristics of raw water of river Tawi, near Sitlee water treatment plant, Jammu. Environment conservation Jouranal10 (3)45-47.(2009).
- Khanna, D. Gautam, .R. A. chugh, T-and Sarkar, Praveen. : Impact of abiotic on the phytoplanktonic population of a pond at Haridwar. Environment Conservation Journal,(1):41-46.(2000).
- Latha, N. Ramchandaran M. Mohan : Seasonal variation of physicochemical and bacteriological parameters of Kengari lake, Banglore, Karnataka. Indian hydrobiology13 (1): 68-74.(2010).
- Mahajan, A. and Kanhere, R.R. Seasonal Variation of abiotic factors of a fresh water pond at Barwani, Poll. Res. 14:347-350.(1995).
- Narayan, R. Saxena K.K. and Chauhan,S. : Limnological investigations of taxi temple pond in district Etawah.J.Environ.Biol.28 (1), 155-157.(2007).
- Pathak, S.K. and Mudal L.K. : Correlation of physicochemical parameter in Virla reservoir, M.P. Environment conservation Journal 7,(1-2)79-82.(2006).
- Radhika, C. Mini, I. G. & T. Gangadevi T. : Studies on Abiotic parameters of tropical fresh water lake – Vellayani Lake, Trivandrum, Kerala, Pollution Research, 23(1),(2004).
- Ramakrishnan, N. : Bio-Monitoring approaches for water quality Assessment in two Water Bodies at Tiruvannamalal, TamilNadu. Proc. of the third Inter. Conf. on Env. and Health, Chennai. 15-17 Dec.(2003).
- Rasool, S. Harikishore, K. Satyakala, M. and Surynaryan, M. U. Studies on the physic-chemical parameters of Rankala lake, Kolhapur, Ind. J. Envron. Protection 23: 961-963.(2003).
- Rawat, M.S, and Sharma, R.C. : Phytoplankton population of Garhwal himalyanlake Deoria Tal, Uttaranchal. J.Ecophysiol. occup. Hltth.,5,73-76.(2005).
- Rawson, J.A. : A limnological comparison of twelve large lakes in northern saskatchewan; Limno.Ocenogr.,5:195-221.(1960).
- Sharma, S. Ecological studies on the herb layers of hills at Udaipur (South Rajasthan). Ph.D. Thesis University of Udaipur..(1976).
- Shinde, S.E. Pathan,T.S. Raut, K.S. More, P.R. and. Sonawane, D.L. Seasonal variations in physico-chemical characteristics of Harsool-savangi Dam, Auanangabad, India. The Ecosan 4(1): 37-44.(2010).
- Shrivastava, A. Studies on the macrophytic vegetation of Pipalyapala talab. Indore. Ph.D. Thesis. D.A.V.V. Indore.(1996).
- Singh, J.P. Singh. S , and Khanna, D.R. Water quality status of river Ganga in respect of physico-chemical, microbial characteristics at Anupshahar Dist. Buland ( U.P.).(2006).
- Somashehara Rao, K.: Correlation among water quality parameters. of ground water of Nazvid town and Nazvid mandalam. Ind. J. Environ. Pro. 13: 261-266.(1990).
- Surve, P.R, Ambore, N. E. Pulle, J. S. (2005): Hydrobiological studies of Kandhar dam water, dicstrict Nanded (M.S.) India J. Ecophysiol. occup. Hltth.,5,61-63
- Telkhande, P.. Dhangaonkar , M Zade , S.B. Khune and Lonker, A.V.: Studies on physicochemical and biological parameters of chargaon Lake Distt. Chandarpur , Environmental conservation Journal, 9(1&2) 23-26.(2008)
- Tiwari, D. D. andMishra, S. M. : Limnological study during rainy season of Seetadwar Lake at Shrawasti District. J. Ecophysiol. occupat.(2005).
- Trivedi, R.K. and Goel, P.K. : Chemical and biological methods for water pollution studies. Environmental publication, Karad. 1-251.(1984).
- Venkatasubramani R, Meenambal ,T : Study of sub-surface water Quality in Mattupalayam Taluk of Coimbatore district Tamil Nadu. Nat.Environ. Poll. Tech. 6: 307-310.(2007).
- Wetzel, R. G. : Limnology, W.B. Saunders Company, Philadelphia, W.B.Saunders. 357. pp. (1975).


