The Applications of Rasch Measurement Model for Calibrating Survey Instrument for Analysing the Criteria of Sustainable Construction
Mohd Nor Rashidi1 * , Rawshan Ara Begum2 , Mazlin Bin Mokhtar1 and Joy Jacqueline Pereira1
1
Institute for Environment and Development (LESTARI),
National University of Malaysia,
Bangi, Kajang,
43600
Selangor D. E.
Malaysia
2
Institute of Climate Change (IKP),
National University of Malaysia,
Bangi, Kajang,
43600
Selangor D. E.
Malaysia
http://dx.doi.org/10.12944/CWE.9.3.14
Copy the following to cite this article:
Rashidi M. N, Begum R. A, Mokhtar M. B, Pereira J. J. The Applications of Rasch Measurement Model for Calibrating Survey Instrument for Analysing the Criteria of Sustainable Construction. Curr World Environ 2014;9 (3) DOI:http://dx.doi.org/10.12944/CWE.9.3.14
Copy the following to cite this URL:
Rashidi M. N, Begum R. A, Mokhtar M. B, Pereira J. J. The Applications of Rasch Measurement Model for Calibrating Survey Instrument for Analysing the Criteria of Sustainable Construction. Curr World Environ 2014;9(3). Available from: http://cwejournal.org?p=573/
Download article (pdf)
Citation Manager
Publish History
Perception is a phenomenon that is very difficult to measure whether it is a qualitative or quantitative research (Wan Nur’ashiqin, 2013). Because of that, validation of the measuring instrument is very important for any study involved. Rasch measurement model consists of a set of instructions to meet the needs and requirements of scientific measurement which shall be applied in the social science research (Bond, 2003). With the application of this measurement model, the ordinal observation could be converted to the linear type of measurement, that also known as logits (Mok & Wright, 2004; Rasch, 1980), which in turn allows the measurement interval to be utilized (Wright & Linacre, 1989). The model also allows the researcher especially from the social sciences to run a calibrated measurement, which involves separating the misfit raw data to ensure a statistically more accurate analysis result. With the conduct of fit and unidimensionality analysis as part of the measurement model processes, the objective to calibrate the measurement instruments that would enhance the quality of the measuring instrument in measuring the construct. Accordingly this paper aims to high light the methods of measurement and analysis involved, utilizing the Win steps® Rasch Measurement Version 3.68.2 software. With the application of this model, the technical aspects for each of the involved item in the measurement are evaluated which could indirectly serve the purpose of calibrating the instrument to ensure a more accurate measurement for producing a meaningful and accurate analysis.
The Rasch Measurement Model
Rasch measurement model is an important instrument for analyzing data involving various fields (Shea et al., 2012) which includes the field of management (Mcnamara & Knoch, 2012). It helps the researchers, especially from social science background to conduct a calibrated measurement as previously implemented by Azrilah et al., (2008). During the analysis, both items and respondents in the measurement were adjusted or calibrated, which represents the unique characteristics and advantages of Rasch measurement model compared to the use of any other measurements models.
Fit Statistics
One of the key principles of Rasch measurement model is its ability to detect the mismatch or misfit data. In applying this model, it is of paramount importance to assess the technical quality of the measurement items involved (Smith, 1992). Because of that, analysis of fit is used to evaluate the extent of which the research participants and the measurement items could be gathered in the same rules and constructs. Referring to the needs of fit statistic, the research participants should have been consistently ranked by related items that measuring in the same construct, in which the misfit items should be considered for deletion or revision (Wan Nur’ashiqin, 2013).
In the context of fit statistic in the Rasch measurement model, several aspects are to be observed which include; the in fit, outfit, mean-square (MNSQ) and standardized mean (ZSTD). During the observations, adherence of the data to the modelled expectations can be clearly shown. According to Linacre (2002), the value of MNSQ between 0.5 and 1.5 is considered productive for measurement purpose. He also stressed that the Z STD value between -1.9 and 1.9 is an indicator that the raw data have reasonable predictability. In addition, the MNSQ value that range from 1.5 to 2.0 is still being acceptable even if it is not productive for the purpose of measurement.
Item Unidimensionality
According to McNamara (1996), unidimensionality of the items need to be measured to ensure that the items in the measurement instrument functioning together to form a single basic pattern in the matrix of measured data. Approximately, the measurements instrument that capable of measuring the quality latent variable could be determined (Sick, 2010). During the measurement of item unidimensionality, the correlation value for the residual data will be considered. The value equals to, or greater than 0.70 for any two items clearly indicates that there is a possibility that these two items are not free in locality, or in other words the two measured items are considered identical and carry the same meaning in the perspective of the research participants.
Method of Implementation
The data were analyzed by applying the Rasch measurement model (Rasch, 1960; Rasch, 1980), using Rasch Measurement Win steps ® Version 3.68.2 (Linacre 2009). Based on the mathematical formula of this model, the relationship is set between research participants and measurement items which in this study are previously identified criteria of sustainable construction (Rashidi, 2014). The objective of establishing the relationship is to measure an attribute in the measurement. By using this measurement model as well, the ability of the research participants and the difficulty of the items were considered (Rasch, 1980).
According to Linacre (2009), the first important step that needs to be taken into consideration is to observe any point measure correlation (PMEA) with negative value. Nevertheless, the correlation that should be obtained is a positive value (Abu Bakar, 2012). Apart from that, as being recommended by Linacre (2009), three observation steps were followed during the analysis;
- Observations of Outfit before In fit
- Observations of Mean Square (MNSQ) prior to Z-Standard (Z STD)
- Observations of the high value prior low or negative value
Results and Discussion
In overall the raw data were analyzed in accordance to Rasch measurement model using Win steps ® software version 3.68.2. For the purpose of discussion, the criteria of sustainable construction are described as the items and research participants as the person to facilitate the explanation part of this section.
Summary Statistic
Summary statistics in Figure 1 clearly shows the reliability of the person is valued at 0.84 which according to Fisher (2007) could be adopted for further analysis. Meanwhile, the reliability of the item is measured at 0.77 which is a good level and the separation index of the item is valued at 1.85, which is considered a moderate level (Fisher, 2007).
By using the formula of [4 * Separation 1) / 3], two strata of item are generated. Separation index for person has been evaluated at 2.30, which according to Fisher (2007) is categorized as good, and by using the same formula [4 * Separation 1) / 3] three numbers of strata are obtained for the research participants.
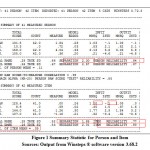 |
Figure 1: Summary Statistic for Person and Item Sources Output from Winsteps ® software version 3.68.2 |
Inability to separate the research participants to a higher number of strata may be due to low quality or a small number of measurement items, as pointed out by Bond and Fox (2007). However, the acquisition of good items reliability of 0.80 had clearly shown that the measurement instrument has been working well to perform further analysis. Referring to Figure 1, the measurement instrument has the standard error of item mean valued at ± 0.09. In fit MNSQ for the item is 1.00 log it, which clearly shows that the observation is compatible with the expectation. As for the ZSTD which is the deviation value of the normal curve, it has been measured at -0.1 log it. This value indicates that the probability of the sample divided into separate profiles is at odds of 0.99, which is a high probability.
Item Fit
The observation of the misfit item is shown in Figure 2, in which the PMEA for each item has the positive value. It is observed that the outfit and in fit MNSQ for most items are within the range of productive measurement, except for three items i.e. items 1 (E_SustPro), item 37 (e_EPW Costs) and item 28 (S_Heritage), in which the value is above 1.5. However it is still acceptable for measurement purposes, though it is basically not productive (Linacre, 2002). However the ZSTD value for each of the three items is outside the allowable range of -1.9 to 1.9. From the measurement of ZSTD also found that the value of item 9 which equals to 2.0 had also reduced the reasonable predictability of the measurement instrument. The summary of MNSQ and ZSTD of the involved items are shown in Table 1.
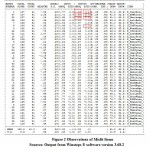 |
Figure 2: Observations of Misfit Items Sources |
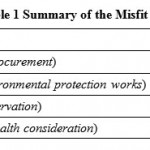 |
Table 1: Summary of the Misfit Items |
For the purpose of calibrating the measurement instrument; item 1, 37, 28 and 9 should be excluded for the next measurement. However, further review is deemed necessary as the cause of the misfit of these four items may be due to a mismatch among the research participants (misfit person). Besides, these items which are the criteria of sustainable construction that were identified during the earlier stage still need to be considered for further measurements.
Person Fit
Referring to Figure 3, observations were only performed at the top of the list whereas the list at the bottom position with either low or negative value should be maintained for later stage of analysis (Linacre, 2009). Based on the value of PMEA, in fit and outfit for both MNSQ and Z STD; eight misfit persons were identified, which in this study are referring to the mismatch research participants. The eight misfit persons identified were considered to be excluded from the next measurement.
From the observation, PMEA for person with the entry number of 41, 39, 28 and 40 are negative. Meanwhile the MNSQ for person of entry number 25 and 33 are not productive for measurement purposes, in which the outfit value exceeded the maximum allowable of 2.0. For the measurement of ZSTD there are two outliers being observed, the person of entry number 21 and 38. From the results of analysis, eight research participants that were found to be incompatible with this model should be considered for elimination.
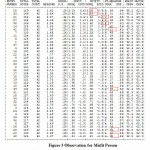 |
Figure 3: Observation for Misfit Person Sources |
Figure 4 shows list of misfit items after the removal of eight misfit persons which had been identified. The result of analysis with the demerger of eight misfit persons was then compared with the original result before the removal. The comparisons of ZSTD for four misfit items that were previously identified are shown in Table 2. From the observation, it is clear that there is an improvement in the ZSTD value for item 1, 28 and 9. However, item 37 remains in the range according to Linacre (2002), is statistically difficult to predict.
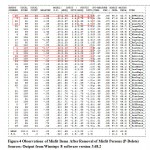 |
Figure 4: Observations of Misfit Items After |
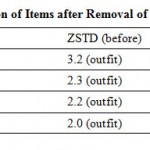 |
Table 2: Comparison of Items after |
Referring to Figure 4, it is also noted that apart from item 37 there are still three other items which are in the same range, such as item 3 (E_WsteMinz), item 22 (E_ISO 14000) and item 18 (E_QualProf). According to Linacre (2002), these items are difficult to predict or there were different views among the research participants on these three items. However, as these items are the previously identified criteria of sustainable construction, then the items shall be maintained for the purpose of further analysis of the study.
Statistics after the Cleaning of Data
The result of fit statistics for person and item after the cleaning of data is shown in Figure 5. The cleaned data was then compared with the results of the raw data (preliminary data) as shown in Table 3.
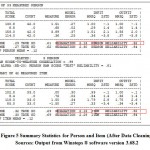 |
Figure 5: Summary Statistics for Person and |
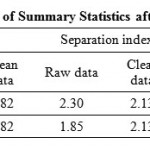 |
Table 3: Comparison of Summary |
Referring to Table 3, the data indicate impairment of reliability and separation index for the category of person, never the less the separation strata remains the same. However, the elevation of value can be observed in the category of item. The reliability of the item is registered at 0.82 compared to 0.77 (at the earlier stage), which is considered as a good level. Item separation index which is measured at 2.13 (increment from 1.85) is also regarded as good level (Fisher, 2007). Separation strata of the items are also increased to three strata as compared to two strata before. This clearly shows that the clearing of misfit raw data enhances the reliability of the items, which indirectly serves the purpose of instrument calibration to ensure a more accurate measurement. Therefore the removal of misfit data is a strong statistical justification for this study.
Unidimensionality of Items
As shown in Table 4 the variance is measured at 24.8%, which is well below the minimum point of 40.0% as required by the Rasch measurement model. How ever, the variance is higher by 0.1% than the modelled value of 24.7%. The result of low score is likely to be explained by examining the "unexplained variance in 1st contrast" which is recorded at 12.2%. According to Fisher (2007), this percentage shows that noise interference is high as it approaches maximum value of 15.0%.
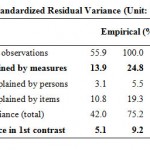 |
Table 4: Standardized Residual |
The noise reaches up to 12.2% is due to the dependent elements identified by observing the aspect known as "largest standardized residual correlations" (Table 5). High correlation value (≥0.70) of data residual of the two identified items indicates that both items are likely not free in locality. Referring to Table 5, correlated residue of the items (in couple) is low, where the value of "largest standardized residual correlations” is still lesser than the maximum allowable limit of 0.70. Hence all the items listed are retained for the purpose of further measurement.
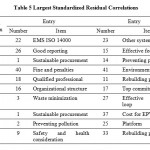 |
Table 5: Largest Standardized Residual Correlation Click here to View table |
Conclusion
Overall from the results obtained, the measurement instrument is found to have acceptable validity based on the analysis of item reliability. The value of item reliability of 0.82 is greater than 0.80, which is strongly acceptable according to Bond and Fox (2007). This is an improvement from the previous value of 0.77. As for the separation index of the item, the obtained value is 2.13 which exceed the minimum allowable limit of 2.0 as suggested by Keefe (1989). The PMEA for all items show the positive values, which prove that all used items, are parallel with the measurement of the construct. This study has also ensured that; each of the measurement items is unidimensional, have different level of difficulty, and fair to all research participants involved. Hence, with the calibration of the measurement instrument through the conduct of analysis of fit and unidimensionality, the reliability and validity of the measurement items can be determined and reviewed, as well as improvements can be made to the measurement instrument. This is very important especially in improving the quality of the instrument in measuring a construct.
Acknowledgement
The author would like to thank Prof. Joy Jacqueline Pereira, Prof. Mazlin bin Mokhtar and Associate Prof. Dr. Rawshan Ara Begum for reading and commenting the earlier version of this paper. The author acknowledges the support and also ï¬nancial support provided by the ZAMALAH LESTARI of Institute for Environment and Development (LESTARI) and COE-LESTARI (XX-07-2012) of University Kebangsaan Malaysia for realizing this study.
References
2. Azrilah, A.A., Azlinah, M., Noor Habibah, A., Hamzah, A.G., Sohaimi, Z., & Saidfudin, M., Application of Rasch Model in Validating the Construct of Measurement Instrument. International Journal of Education and Information Technologies, 2: 105-112 (2008)
3. Bond, T., & Fox, C., Applying The Rasch Model: Fundamental Measurement In The Human Sciences, Mahwah, Lawrence Erlbaum Associates, NJ (2007)
4. Bond, T. G., Validity and Assessment: A Rasch Measurement Persepective. Metodologia de las Ciencias del Comportamient,
5(2): 179- 194 (2003) 5. Fisher, W., Rating Scale Instrument Quality Criteria, Rasch Measurement Transactions 21(1): 1095 (2007)
6. Keefe, J.W., Learning Style Profile Handbook: Accommodating Perceptual, Study and Instructional Preferences, 2nd ed., National Association of Secondary School Principals, Reston, VA. (1989)
7. Linacre, J. M., Patent No. Version 3.68.2. (2009)
8. Linacre, J. M., What Do Infit and Outfit, Mean-Square and Standardized Mean?, Rasch Measurement Transactions, 16(2): 878 (2002).
9. Mcnamara, T., & Knoch, U., The Rasch Wars/ : The Emergence of Rasch Measurement in Language Testing, Language Testing, 29(4): 555 – 576 (2012).
10. McNamara, T., Measuring Seconperformanced Language, Longman, New York (1996).
11. Mok, M., & Wright, B., An overview of Rasch model families, in introduction to rasch measurement: Theory, model and applications, Jam Press, Minnesota. 1-24pp (2004).
12. Rasch, G., Probalistic models for some intelligence and attainment tests. (Copenhagen, Danish Institute for Educational Research), expandend ed. with foreword and afterword by B.D. Wright, The University of Chicago Press, Chicago (1960/1980).
13. Rashidi, M. N., Begum, R. A., Mokhtar, M., & Pereira, J.J., Criteria Towards Achieving Sustainable Construction Through Implementation of Environmental Management Plan (EMP). Advanced Review on Scientific Research, 1(1): 43–64 (2014).
14. Shea, T., Cooper, B.K., De Cieri, H., & Sheehan, C., Evaluation of a Perceived Organisational Performance Scale Using Rasch Model Analysis, Australian Journal of Management, 37(3): 507–522 (2012).
15. Sick, J., Rasch Measurement in Language 662 RASHIDI et al, Curr. World Environ., Vol. 9(3), 653-662 (2014) Education Part 5: Assumptions and Requirements of Rasch Measurement, SHIKENhlm: 23-29 (2010).
16. Smith, R.M., Applications of Rasch measurement, Mesa Press, Chicago, ILL (1992).
17. Wan Nur’ashiqin, W.M., Memprofilkan Guru Bahasa Inggeris Yang Berpotensi Untuk Mendidik Amalan Penjimatan Air di Institusi Pengajian Tinggi Awam di Negeri Selangor, Bangi, Universiti Kebangsaan Malaysia (2013).
18. Wright, B.D., & Linacre, J.M., Observations Are Always Ordinal; Measurements, However Must Be Interval, Archives of Physial Medicine and Rehabilitation, 70: 857-860 (1989)


